 Triplex
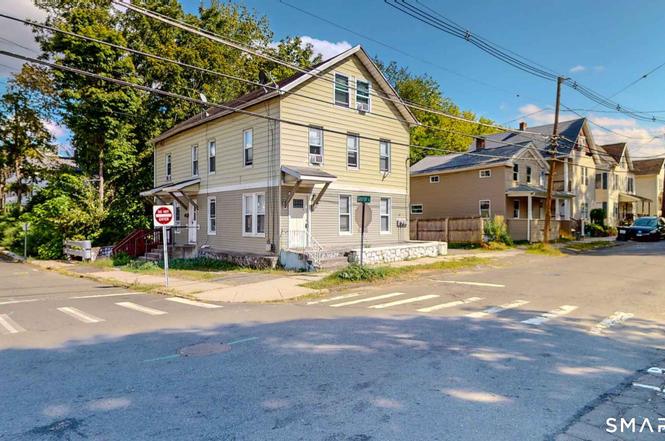
31 William St · Danbury, CT
Flood risk 9/10 · Severe
- FEMA flood zone
- X (unshaded)
- Chance of flooding over 30 yrs
- 0.98%
- Est. flood insurance / yr
- $473 – $860
Fire risk 1/10 · Minimal
- Est. fire insurance / yr
- $829 – $1,539
Heat risk 5/10 · Moderate
- Hot days now (above 99°F)
- 7 days/yr
- Hot days in 30 yrs
- 15 days/yr
Wind risk 5/10 · Moderate
- Chance of severe wind over 30 yrs
- 26.0%
Air-quality risk 3/10 · Minor
- Unhealthy air days now
- 3 days/yr
- Unhealthy air days in 30 yrs
- 4 days/yr
Risk factors via First Street. Map © Google.
Why this score? — see what drove the D+ grade
The composite is a weighted blend of 9 inputs, each scored 0–100. Each bar is that input's sub-score; the figure is the points it added to the 100-point composite (weight × sub-score).
- Cash flow +21.6/30.0
- DSCR +6.9/10.0
- 1% rule +5.0/10.0
- Livability +3.8/5.0
- Rent growth +3.3/5.0
- ARV discount +2.8/15.0
- Condition / age +2.5/5.0
- Schools +2.4/10.0
- Appreciation +0.0/10.0
$685,000
🖨 Deal sheet 📄 Offer letter ✓ Due diligence
Multi-family units
County records classify this as Multi-Family (2-4 Unit). Listing-text estimate: 3 units. confirmed
Listing remarks MLS
Nice 3 family house in a great location of down town Danbury. Gross income $4,000.00 monthly
Key facts
- Separate utilities
- Three family home
- Conveniently located
Tags
Property features AI
Exterior
- Utilities: Public water connected; Public sewer connected; Natural gas hot water
- Home design: Multi-family property (3-family)
- Construction: Frame construction; Stone foundation; Built as a multi-family building
- Exterior features: Corner lot; Aluminum siding; Asphalt shingle roof
Interior
- Bedrooms: 7 bedrooms total
- Bathrooms: 3 full bathrooms
- Heating & cooling: Baseboard heating; Natural gas heating fuel; Window units and ceiling fans for cooling; 50-gallon natural gas hot water tank
- Interior features: Total of 17 rooms; Home automation wiring and electric outlets throughout; Ceiling fans; Window air conditioning units; Has a walk-up attic; Crawl space with dirt floor
Neighborhood map
What this means for you Summary
Snapshot
- This is a 3 × 2-bed/1.0-bath units multifamily listed at $685k.
Deal economics
- At list price, monthly cash flow is $989 ($12k/yr) — positive. Per door: $330/mo.
- The deal already cash-flows at list — no discount required.
- To meet the 1% rule (rent ≥ 1% of price), the offer needs to be $684k (0.1% below list).
- Recommended offer: $644k (6.0% below list) — sets the bar for market timing.
- Cap rate 8.1% vs local median 3.6% in Danbury — top-decile yield for the area; either an underpriced asset or a hidden risk that comps aren't pricing in. Stress-test before assuming the spread holds.
Location & tenants
- Location reads 76/100 on livability (#51 in CT, #3,379 nationally) — a middle-class / working-renter tenant base. Strengths: commute A+, housing A+, health & safety A+; Watch: amenities F, cost of living F.
- Danbury School District (urban): math 19% / reading 32% proficiency, ranked #131 of 153 in CT (top 86%) — low school quality limits family demand, transient renter base, plan for 1-2y turnover.
- Zoned schools: Park Avenue School (math 16% / reading 17%, grade F, #466 of 553 statewide, top 84%, 608 students, 53% FRL); Danbury High School (math 19% / reading 41%, grade F, #137 of 194 statewide, top 70%, 3,590 students, 48% FRL).
- Market conditions: Rents rising (+3.1%/yr); 197 active listings in the ZIP; solid renter incomes; 1,151 units permitted in Western Connecticut Planning Region in 2024 (714 in 5+ unit buildings).
- At $6,845/mo this rent would consume 107% of the median local household income ($77k/yr) (locally 3255% of renters already pay >50% of income on rent) — very limited rent-growth headroom before tenants either downsize or default.
Forward outlook
- Local home prices are declining (-3.0%/yr); year-one equity from $5k of loan paydown is wiped out by about $21k of value loss. Plan a longer hold.
Negotiation context
- It's been on market 74 days — a 6% lower offer ($644k) is reasonable based on typical stale-listing flexibility.
- 12 sale attempts since 30y ago; this cycle's ask has dropped $65k (9%) from the opening price — seller is motivated, your offer sets the floor, not the list.
- Current owner paid $350k; list at $685k implies a 96% gain — meaningful room to come down on a strong offer.
Risks & watch-outs
- Watch-outs: flood insurance adds $56/mo; built in 1900 — expect roof / HVAC / electrical / plumbing capex.
- Climate carrying-cost: severe flood risk; moderate wind risk, 26% chance of damaging wind over 30y; extreme-heat days projected 7→15/yr by 2055 (HVAC capex compounding) — expect insurance premiums to compound above CPI over the hold.
Questions for the listing agent
- It's been on market 74 days. Have you received any prior offers? Is the seller open to a 6% concession, seller financing, or rate buy-down credit?
- Can we see the unit-by-unit rent roll, current vacancy, and any below-market leases? What's the average tenancy length?
- What capital expenditures (roof, boiler, parking lot, exteriors) have been made in the last 5 years, and what's planned in the next 2?
- Built in 1900 — when were the roof, HVAC, electrical panel, plumbing, and water heater last replaced?
- What's the actual annual flood-insurance premium (NFIP or private), and is the property in a SFHA with mandatory coverage?
- Why hasn't it sold? Are there any deal-killer items the seller is aware of (foundation, flood, title, zoning, code violations)?
- Is there a deadline driving the sale (1031 exchange, divorce, estate, relocation)? That informs how much negotiation room exists.
- Schools are D-rated, which usually means shorter tenancies and higher turnover. Who's the typical renter profile here, and what's been the actual vacancy rate?
- The area grade is low — what's the realistic commute time and amenity access for the typical tenant pool here? Any planned neighborhood developments (good or bad) we should know about?
- What's the average days-on-market for RENTAL listings here right now (not sales)? A rising rental-DOM trend means longer vacancies and softer asking-rent achievability than the comps imply.
- What's the recent tenant-quality profile in this submarket — average credit score on applications, eviction rate, late-payment / NSF rate, and stable-employment percentage? A property-management company in the area should have these aggregated.
- How much new apartment / multifamily construction is in the pipeline within 1–3 miles? Heavy new supply (>2% of stock underway) typically softens rents 12–24 months out; light construction supports rent growth.
Investment metrics
- 1% rule
- 1.00% ✗
- Cap rate
- 8.12%
- Cash-on-cash
- 6.54%
- DSCR
- 1.29
- GRM
- 8.3
CMA / ARV
- ARV (on-the-fly)
- $620,048
- Comps found
- 3
Show comp detail 3 sales within ~0.75 mi
| Address | Dist | Beds/Ba | Sqft | Sold | Price | $/sf | Match |
|---|---|---|---|---|---|---|---|
| 32 Spring St | 0.38mi | 6/3.0 (-1) | 2,174 (-5%) | 7mo | $520,000 | $239 | 63 |
| 17 Pleasant St | 0.27mi | 6/2.0 (-1) | 2,451 (+7%) | 9mo | $665,000 | $271 | 59 |
| 10-12 William St | 0.12mi | 8/4.0 (+1) | 2,464 (+8%) | 18mo | $679,000 | $276 | 57 |
Match score weights: distance 35% · size 25% · config 20% · recency 20%. Top-matched comps best support the ARV.
Projected returns pro-forma
-3.0% appreciation · 3.08% rent growth · sell at horizon
- IRR
- -6.7%
- Equity multiple
- 0.75×
- Total profit
- $-47,535
- Equity at exit
- $102,136
- IRR
- 3.0%
- Equity multiple
- 1.22×
- Total profit
- $41,632
- Equity at exit
- $59,226
Cash invested: $191,800 (down + closing). Projections, not guarantees.
Landlord ↔ Tenant lean methodology
- Overall (STATE)
- 27 Tenant-Leaning
- State Connecticut
- 27 Tenant-Leaning · D+7
- County
- — inherits STATE
- City
- — inherits STATE
ZIP-level market 06810
- Rents YoY
- 3.1%
- Active inventory
- 197
- Price-to-rent
- 25.0×
Monthly cashflow live
- Estimated rent
- $6,845 high interval (Pro) →
- Mortgage (P&I)
- −$3,592
- Tax from tax record
- −$485 /mo · $5,822/yr
- Insurance
- −$285
- Flood insurance flood zone
- −$56 /mo · $666/yr
- HOA
- −$0
- Vacancy / Maint / Mgmt
- −$1,437
- Net cashflow
- $989
Break-even live
3-unit breakdown (identical units grouped — click to expand)
| Units | Beds | Baths | Est. rent |
|---|---|---|---|
| 3× units | 2 | 1 | $6,846 |
| #1 | 2 | 1 | $2,282 |
| #2 | 2 | 1 | $2,282 |
| #3 | 2 | 1 | $2,282 |
| Total (3 units) | $6,845 | ||
UW: 25.0% down · 7.5% · 30yr · 1.5% tax · 5.0% vac · 8.0% maint · 8.0% mgmt
Financing live
Cash to close
- Down payment
- $171,250
- Closing costs
- $20,550
- Reserves months
- —
- Total cash needed
- —
Loan-product check · same deal, 3 products live
Conventional
25% down · 7.5% · 30yr
- Down + closing
- —
- Monthly P&I
- —
- Monthly cashflow
- —
- DSCR
- —
- Eligible?
- —
Personal DTI + credit; lowest rate.
DSCR
20% down · 8.5% · 30yr
- Down + closing
- —
- Monthly P&I
- —
- Monthly cashflow
- —
- DSCR
- —
- Eligible?
- —
No personal income docs; deal must DSCR.
Hard money
10% down · 12.0% · 12mo
- Down + closing
- —
- Monthly P&I
- —
- Monthly cashflow
- —
- DSCR
- —
- Eligible?
- —
Short-term bridge; refi at stabilization.
Listing history 38 events
-
2026-04-18status Under Contract
-
2026-04-10status Active
-
2026-04-09historical
-
2026-03-24price $685,000
-
2026-02-16price $714,900
-
2026-02-02$749,900 Active
-
2025-10-14historical
-
2025-09-10$749,900 Active
-
2024-05-16historical $1,650
-
2024-05-09price $1,650
-
2024-04-23price $1,700
-
2024-04-12$1,800
-
2024-04-10historical $1,800
-
2024-04-03$1,800
-
2020-09-09soldstatus $350,000
-
2020-09-04soldstatus $335,000 Closed 92-char remark
Show marketing remark (92 chars)
Nice 3 family house in a great location of down town Danbury. Gross income $4,000.00 monthly
-
2020-06-23historical Under Contract - Continue to Show 92-char remark
Show marketing remark (92 chars)
Nice 3 family house in a great location of down town Danbury. Gross income $4,000.00 monthly
-
2020-06-04$355,000 Active 92-char remark
Show marketing remark (92 chars)
Nice 3 family house in a great location of down town Danbury. Gross income $4,000.00 monthly
-
2020-06-03historical $355,000 92-char remark
Show marketing remark (92 chars)
Nice 3 family house in a great location of down town Danbury. Gross income $4,000.00 monthly
-
2019-08-21historical
-
2019-05-14status Active
-
2019-05-14historical
-
2019-04-12price $399,000
-
2019-03-23price $408,000
-
2019-03-07price $411,000
-
2019-02-08price $416,000
-
2019-01-22price $419,000
-
2018-12-22price $424,000
-
2018-11-26price $434,000
-
2018-11-12$439,000 Active
-
2016-07-27soldstatus $125,000
-
2015-12-23$125,000
-
2015-12-14historical
-
2015-06-23$100,000
-
2000-02-05soldstatus $95,000
-
1999-12-17$94,900
-
1996-07-29historical
-
1996-03-12$98,900
ⓘ Source: listings_history table (triggers on properties + properties_extension) + one-shot
backfill from property_details.listing_events for pre-trigger history.
Tax reassessment forecast CT · Partial reset (capped growth)
- Current annual tax
- $5,822 · $485/mo
- Projected year-2 tax
- $10,240 · $853/mo
- Expected delta
- +$4,418/yr (+$368/mo · 75.9%)
ⓘ Screening estimate from a state-policy table — verify with the county assessor before closing.
Climate risk First Street
- Flood 9/10 Extreme FEMA zone X (unshaded) · 98% chance over 30 yrs
- Wildfire 1/10 Low
- Heat 5/10 Major 7 d/yr ≥99°F today · 15 d/yr by 30 yrs out
- Wind 5/10 Major 26% chance of damaging wind over 30 yrs
- Air quality 3/10 Moderate 3 unhealthy d/yr today · 4 by 30 yrs out
Nearby sold comps map
Loading sold comps map…
Walkable amenities ~0.75 mi
Loading nearby amenities…
Taxation est. · year 1
- Rental income
- $82,140
- − Mortgage interest
- −$38,371
- − Property taxes
- −$5,822
- − Insurance
- −$4,092
- − Repairs & maintenance
- −$6,571
- − Management
- −$6,571
- − Depreciation
- −$19,927
- Taxable income
- $786
- Est. tax owed @ 24.0%
- −$189
- After-tax cash flow
- $11,682/yr
For passive investors: Depreciation is non-cash, so a rental often shows a tax loss while cash-flowing — sheltering income. Rental losses are passive: they offset passive income freely, and up to $25,000/yr can offset ordinary (W-2) income if you actively participate and your MAGI is under $100k (phasing out to $0 by $150k); unused losses carry forward. On sale, claimed depreciation is recaptured at up to 25%, and gains may owe capital-gains tax (a 1031 exchange can defer both). Figures are a year-1 estimate at your 24.0% rate — not tax advice; consult a CPA.
Schools (NCES district)
- District
- Danbury School District
- NCES district ID
- 0901020
- Math proficiency
- 19% ▼ -17.00%
- Reading proficiency
- 32% ▼ -16.00%
- Median HH income
- $65,793
- Composite
- 23.93/100
- National rank
- #7784
- State rank
- #131 of 153 in CT
Livability — Danbury
- Score
- 76/100
- State rank
- #51
- US rank
- #3379
Category grades
Schools grade is shown separately in the Schools card above.
Census & demographics
- Census place
- Danbury, CT
- County
- Fairfield County · 765,532 people
- City population
- 87,061
- Metro
- Bridgeport-Stamford-Norwalk, CT
- Population (ZIP)
- 55,833
- Household income
- $76,933
- Rent vs Own
- Severe rent burden
- 3255.0
Population outlook (Western Connecticut County) Hauer SSP2
- By 2040
- 685,031
Race, ethnicity, and origin ACS 2023
- Neighborhood character
- Highly diverse neighborhood (Simpson 0.72)
- Race & ethnicity
- Hispanic / Latino 37% White 35% Two or more races 19% Black 12% Asian 5%
- Hispanic origin (detail)
- Mexican 4% Puerto Rican 3% Dominican 6%
- Common ancestry
- Estonian 8% Russian 4% Romanian 3%
- Foreign-born
- 41% · Canada, Jamaica, Dominican Republic
- Languages at home
- 48% English-only · Spanish 32% Other Indo-European 16% Other Asian/Pacific 1%
Political lean MEDSL · Western Connecticut
- 2024 margin
- D (+19.1) · D 58.8% · R 39.7% · Other 1.6%
- All cycles
- 2024: D+19.1
Not yet ingested
- Civics
- —
Market trends
- HPI YoY
- ▼ -309.71%
- Current HPI
- 286.5484
- Rent YoY
- ▲ 3.08%
- Metro
- Bridgeport-Stamford-Norwalk, CT
- State GDP YoY
- ▲ 1.06%
- F500 in state
- 38
Industry mix (Fortune 500 HQ in CT)
| Industry | F500 HQs | Revenue |
|---|---|---|
| Industrial Machinery | 4 | $38B |
|
||
| Insurance | 3 | $71B |
|
||
| Financial Services | 2 | $25B |
|
||
| Transportation / Logistics | 2 | $18B |
|
||
| Healthcare | 1 | $247B |
|
||
| Telecommunications | 1 | $55B |
|
||
Price history
+592.6% since first listed38 events — show timeline
- 2026-04-18 Pending — Smart MLS
- 2026-04-10 Relisted — Smart MLS
- 2026-04-09 Listing Removed — Smart MLS
- 2026-03-24 Price Changed $685,000 Smart MLS
- 2026-02-16 Price Changed $714,900 Smart MLS
- 2026-02-02 Listed $749,900 Smart MLS
- 2025-10-14 Listing Removed — Smart MLS
- 2025-09-10 Listed $749,900 Smart MLS
- 2024-05-16 Rental Removed $1,650 APPFOLIO
- 2024-05-09 Price Changed $1,650 APPFOLIO
- 2024-04-23 Price Changed $1,700 APPFOLIO
- 2024-04-12 Listed for Rent $1,800 APPFOLIO
- 2024-04-10 Rental Removed $1,800 APPFOLIO
- 2024-04-03 Listed for Rent $1,800 APPFOLIO
- 2020-09-09 Sold (Public Records) $350,000 Public Records
- 2020-09-04 Sold (MLS) $335,000 Smart MLS
- 2020-06-23 Contingent — Smart MLS
- 2020-06-04 Listed $355,000 Smart MLS
- 2020-06-03 Coming Soon $355,000 Smart MLS
- 2019-08-21 Listing Removed — Smart MLS
- 2019-05-14 Relisted — Smart MLS
- 2019-05-14 Listing Removed — Smart MLS
- 2019-04-12 Price Changed $399,000 Smart MLS
- 2019-03-23 Price Changed $408,000 Smart MLS
- 2019-03-07 Price Changed $411,000 Smart MLS
- 2019-02-08 Price Changed $416,000 Smart MLS
- 2019-01-22 Price Changed $419,000 Smart MLS
- 2018-12-22 Price Changed $424,000 Smart MLS
- 2018-11-26 Price Changed $434,000 Smart MLS
- 2018-11-12 Listed $439,000 Smart MLS
- 2016-07-27 Sold (MLS) $125,000 Smart MLS
- 2015-12-23 Listed $125,000 Smart MLS
- 2015-12-14 Listing Removed — Smart MLS
- 2015-06-23 Listed $100,000 Smart MLS
- 2000-02-05 Sold (MLS) $95,000 Smart MLS
- 1999-12-17 Listed $94,900 Smart MLS
- 1996-07-29 Listing Removed — Smart MLS
- 1996-03-12 Listed $98,900 Smart MLS
Property tax history
+5.4%/yrLatest (2023): $5,822 · +14.6% YoY. Source: county tax records.
Cash-flow waterfall
monthlySold comps — $/sqft
last 12 mo · ≤1 miLoading sold comps…