1603 10th St · Eldora, IA
Flood risk 1/10 · Minimal
- FEMA flood zone
- X (unshaded)
- Chance of flooding over 30 yrs
- 0.0%
- Est. flood insurance / yr
- $473 – $860
Fire risk 4/10 · Minor
- Est. fire insurance / yr
- $902 – $1,676
Heat risk 3/10 · Minor
- Hot days now (above 103°F)
- 7 days/yr
- Hot days in 30 yrs
- 15 days/yr
Wind risk 2/10 · Minimal
- Chance of severe wind over 30 yrs
- —
Air-quality risk 1/10 · Minimal
- Unhealthy air days now
- 0 days/yr
- Unhealthy air days in 30 yrs
- 0 days/yr
Risk factors via First Street. Map © Google.
Why this score? — see what drove the B grade
The composite is a weighted blend of 9 inputs, each scored 0–100. Each bar is that input's sub-score; the figure is the points it added to the 100-point composite (weight × sub-score).
- Cash flow +30.0/30.0
- 1% rule +10.0/10.0
- DSCR +10.0/10.0
- ARV discount +7.5/15.0
- Schools +5.3/10.0
- Livability +3.6/5.0
- Rent growth +2.5/5.0
- Condition / age +2.5/5.0
- Appreciation +2.0/10.0
$61,000
🖨 Deal sheet 📄 Offer letter ✓ Due diligence
Listing remarks MLS
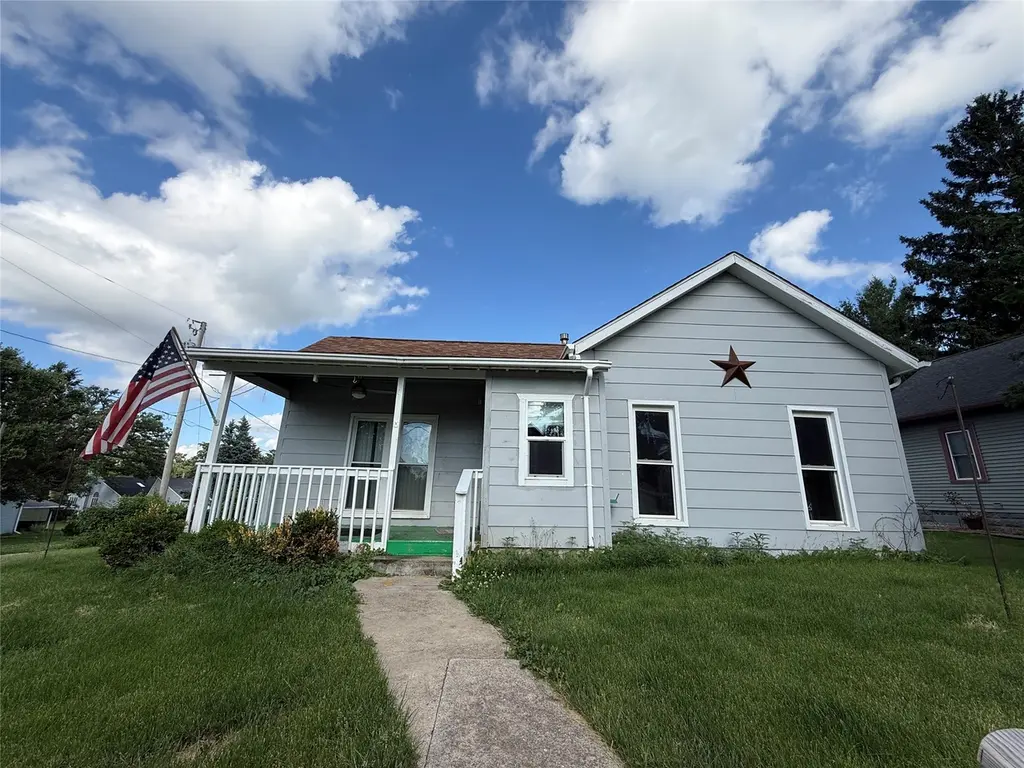
Cute and cozy is the best way to describe this home. A 3 bedroom ranch style home situated on a corner lot close to the city park. One bedroom can be used as a main floor laundry room. The kitchen has an eat-in area. There is a single detached garage and off-road parking. Call Eldora Iowa Realty for a showing today.
Key facts
- Eldora community
- Healthcare
- Schools
Tags
Property features AI
Exterior
- Parking: Detached one-car garage
- Utilities: Public water; Public sewer
- Home design: Single-story home
- Construction: Wood siding; Shingle (asphalt) roof; Block and stone foundation; Resale condition
- Exterior features: Concrete road access; Residential zoning
Interior
- Bedrooms: Three main-level bedrooms
- Flooring: Hardwood
- Bathrooms: One full bathroom
- Heating & cooling: Forced air heating; Gas heating
- Interior features: Dining area; Hardwood flooring; Unfinished basement; One fireplace
Neighborhood map
What this means for you Summary
Snapshot
- This is a 3-bed/1.0-bath single-family listed at $61k.
Deal economics
- At list price, monthly cash flow is $444 ($5k/yr) — positive.
- The deal already cash-flows at list — no discount required.
- Meets the 1% rule at list price ($1k rent vs $61k).
Location & tenants
- Location reads 71/100 on livability (#336 in IA) — a middle-class / working-renter tenant base. Strengths: cost of living A+, housing A+, health & safety A+; Watch: crime F, amenities F, commute F.
- Eldora-New Providence Community School District (rural): math 60% / reading 66% proficiency, ranked #217 of 289 in IA (top 75%) — acceptable for families but not a draw, mixed tenant base, ~2y average lease.
- Market conditions: 29 active listings in the ZIP; 6 units permitted in Hardin County in 2024 (0 in 5+ unit buildings).
Forward outlook
- Local home prices are declining (-3.0%/yr); year-one equity from $422 of loan paydown is wiped out by about $2k of value loss. Plan a longer hold.
- Hardin County population projected to shrink 6% by 2050 — rents likely to lag national; underwrite the cash flow, not the appreciation.
- At projected returns (-3.0% appreciation + 3.0% rent growth), your $17k cash investment doubles in ~4 years — after that, you're playing with house money.
Negotiation context
- Only 13 days on market — expect competitive offers; lowballing is unlikely to land.
- 3 sale attempts since 7y ago; this cycle's ask has dropped $8k (12%) from the opening price — seller is motivated, your offer sets the floor, not the list.
- Current owner paid $33k; list at $61k implies a 85% gain — meaningful room to come down on a strong offer.
Risks & watch-outs
- Watch-outs: built in 1900 — expect roof / HVAC / electrical / plumbing capex.
Questions for the listing agent
- Built in 1900 — when were the roof, HVAC, electrical panel, plumbing, and water heater last replaced?
- Is there a deadline driving the sale (1031 exchange, divorce, estate, relocation)? That informs how much negotiation room exists.
- Schools are B-rated — typically a magnet for longer-tenancy family renters. What's the average tenant stay here, and is there a school-zone premium baked into asking?
- Crime grade is F in this area — have there been break-ins, vandalism, or insurance claims at this property in the last 3 years? What carrier currently insures it and at what premium?
- What's the average days-on-market for RENTAL listings here right now (not sales)? A rising rental-DOM trend means longer vacancies and softer asking-rent achievability than the comps imply.
- What's the recent tenant-quality profile in this submarket — average credit score on applications, eviction rate, late-payment / NSF rate, and stable-employment percentage? A property-management company in the area should have these aggregated.
- How much new for-sale + rental construction is in the pipeline within 1–3 miles? Heavy new supply typically softens prices + rents 12–24 months out; constrained supply supports both.
Investment metrics
- 1% rule
- 1.80% ✓
- Cap rate
- 15.03%
- Cash-on-cash
- 31.19%
- DSCR
- 2.39
- GRM
- 4.6
CMA / ARV
- ARV (on-the-fly)
- $129,600
- Comps found
- 12
Show comp detail 12 sales within ~0.75 mi
| Address | Dist | Beds/Ba | Sqft | Sold | Price | $/sf | Match |
|---|---|---|---|---|---|---|---|
| 1809 11th St | 0.18mi | 4/1.5 (+1) | 1,340 (-1%) | 1mo | $143,000 | $107 | 83 |
| 1407 18th Ave | 0.33mi | 2/1.0 (-1) | 1,336 (-1%) | 7mo | $77,000 | $58 | 72 |
| 2004 12th St | 0.31mi | 3/2.0 | 1,360 (+1%) | 10mo | $150,000 | $110 | 72 |
| 1702 Washington St | 0.23mi | 3/1.5 | 1,464 (+8%) | 4mo | $120,000 | $82 | 70 |
| 1101 18th Ave | 0.17mi | 3/1.0 | 1,412 (+5%) | 18mo | $75,000 | $53 | 70 |
| 1818 12th St | 0.24mi | 3/1.5 | 1,151 (-15%) | 14mo | $130,000 | $113 | 50 |
| 1301 6th St | 0.34mi | 2/2.0 (-1) | 1,160 (-14%) | 2mo | $56,000 | $48 | 50 |
| 1118 8th Ave | 0.56mi | 2/1.0 (-1) | 1,244 (-8%) | 13mo | $85,000 | $68 | 45 |
| 1513 16th Ave | 0.38mi | 2/2.0 (-1) | 1,512 (+12%) | 18mo | $166,000 | $110 | 39 |
| 706 12th St | 0.58mi | 2/2.0 (-1) | 1,169 (-13%) | 4mo | $90,000 | $77 | 38 |
| 1606 3rd St Pl | 0.51mi | 3/3.0 | 1,536 (+14%) | 8mo | $148,000 | $96 | 38 |
| 806 12th St | 0.53mi | 3/2.0 | 1,546 (+14%) | 17mo | $158,000 | $102 | 33 |
Match score weights: distance 35% · size 25% · config 20% · recency 20%. Top-matched comps best support the ARV.
Projected returns pro-forma
-3.0% appreciation · 3.0% rent growth · sell at horizon
- IRR
- 26.0%
- Equity multiple
- 2.08×
- Total profit
- $18,409
- Equity at exit
- $9,095
- IRR
- 33.7%
- Equity multiple
- 4.07×
- Total profit
- $52,508
- Equity at exit
- $5,274
Cash invested: $17,080 (down + closing). Projections, not guarantees.
Landlord ↔ Tenant lean methodology
- Overall (STATE)
- 83 Strongly Landlord-Friendly
- State Iowa
- 83 Strongly Landlord-Friendly · R+6
- County
- — inherits STATE
- City
- — inherits STATE
ZIP-level market 50627
- Home prices YoY
- -3.7%
- Active inventory
- 29
- Price-to-rent
- 4.6×
Monthly cashflow live
- Estimated rent
- $1,096 medium interval (Pro) →
- Mortgage (P&I)
- −$320
- Tax est. 1.5%
- −$76 /mo · $915/yr
- Insurance
- −$25
- HOA
- −$0
- Vacancy / Maint / Mgmt
- −$230
- Net cashflow
- $444
Break-even live
UW: 25.0% down · 7.5% · 30yr · 1.5% tax · 5.0% vac · 8.0% maint · 8.0% mgmt
Financing live
Cash to close
- Down payment
- $15,250
- Closing costs
- $1,830
- Reserves months
- —
- Total cash needed
- —
Loan-product check · same deal, 3 products live
Conventional
25% down · 7.5% · 30yr
- Down + closing
- —
- Monthly P&I
- —
- Monthly cashflow
- —
- DSCR
- —
- Eligible?
- —
Personal DTI + credit; lowest rate.
DSCR
20% down · 8.5% · 30yr
- Down + closing
- —
- Monthly P&I
- —
- Monthly cashflow
- —
- DSCR
- —
- Eligible?
- —
No personal income docs; deal must DSCR.
Hard money
10% down · 12.0% · 12mo
- Down + closing
- —
- Monthly P&I
- —
- Monthly cashflow
- —
- DSCR
- —
- Eligible?
- —
Short-term bridge; refi at stabilization.
Listing history 12 events
-
2026-06-18days on market $61,000 Active 13 DOM
-
2026-06-17price $61,000 Active 12 DOM
-
2026-06-17days on market $69,000 Active 12 DOM
-
2026-06-16days on market $69,000 Active 11 DOM
-
2026-06-15days on market $69,000 Active 10 DOM
-
2026-06-13days on market $69,000 Active 8 DOM
-
2026-06-12days on market $69,000 Active 7 DOM
-
2026-06-09days on market $69,000 Active 4 DOM
-
2026-06-08days on market $69,000 Active 3 DOM
-
2026-06-07days on market $69,000 Active 2 DOM
-
2026-06-07remarks 699-char remark
-
2026-06-07$69,000 Active 1 DOM
ⓘ Source: listings_history table (triggers on properties + properties_extension) + one-shot
backfill from property_details.listing_events for pre-trigger history.
Climate risk First Street
- Flood 1/10 Low FEMA zone X (unshaded) · 0% chance over 30 yrs
- Wildfire 4/10 Moderate
- Heat 3/10 Moderate 7 d/yr ≥103°F today · 15 d/yr by 30 yrs out
- Wind 2/10 Low
- Air quality 1/10 Low 0 unhealthy d/yr today · 0 by 30 yrs out
Nearby sold comps map
Loading sold comps map…
Walkable amenities ~0.75 mi
Loading nearby amenities…
Taxation est. · year 1
- Rental income
- $13,147
- − Mortgage interest
- −$3,417
- − Property taxes
- −$915
- − Insurance
- −$305
- − Repairs & maintenance
- −$1,052
- − Management
- −$1,052
- − Depreciation
- −$1,775
- Taxable income
- $4,632
- Est. tax owed @ 24.0%
- −$1,112
- After-tax cash flow
- $4,216/yr
For passive investors: Depreciation is non-cash, so a rental often shows a tax loss while cash-flowing — sheltering income. Rental losses are passive: they offset passive income freely, and up to $25,000/yr can offset ordinary (W-2) income if you actively participate and your MAGI is under $100k (phasing out to $0 by $150k); unused losses carry forward. On sale, claimed depreciation is recaptured at up to 25%, and gains may owe capital-gains tax (a 1031 exchange can defer both). Figures are a year-1 estimate at your 24.0% rate — not tax advice; consult a CPA.
Schools (NCES district)
- District
- Eldora-New Providence Community School District
- NCES district ID
- 1910690
- Math proficiency
- 60% ▬ 0.00%
- Reading proficiency
- 66% ▲ 1.00%
- Median HH income
- $48,655
- Composite
- 53.42/100
- National rank
- #1470
- State rank
- #217 of 289 in IA
Livability — Eldora
- Score
- 71/100
- State rank
- #336
- US rank
- #6849
Category grades
Schools grade is shown separately in the Schools card above.
Census & demographics
- Census place
- Eldora, IA
- City population
- 3,431
- Population (ZIP)
- 3,431
Population outlook (Hardin County) Hauer SSP2
- Today (2025)
- 17,474 people
- By 2030
- 17,369 · -0.6%
- By 2040
- 17,018 · -2.6%
- By 2050
- 16,454 · -5.8%
- By 2075
- 14,665 · -16.1%
- By 2100
- 12,404 · -29.0%
Race, ethnicity, and origin ACS 2023
- Neighborhood character
- Predominantly White (88%)
- Race & ethnicity
- White 88% Two or more races 5% Asian 3% Black 2% Hispanic / Latino 1%
- Common ancestry
- Portuguese 4% Iranian 3% Slovak 3%
- Foreign-born
- 3% · Vietnam
- Languages at home
- 95% English-only · Vietnamese 1% Arabic 1% Spanish 1%
Political lean MEDSL · Hardin
- 2024 margin
- Solid R (+38.4) · D 30.3% · R 68.7% · Other 1.1%
- 2008→2024 swing
- -39.3pp toward R · 2008: 0.9pp · 2024: -38.4pp
- All cycles
- 2024: R+38.4 2020: R+32.0 2016: R+29.2 2012: R+7.1 2008: D+0.9
Not yet ingested
- Civics
- —
Market trends
- HPI YoY
- ▼ -5.92%
- Current HPI
- 155.9198
- Rent YoY
- —
- Metro
- —
- State GDP YoY
- ▲ 2.48%
- F500 in state
- 4
Industry mix (Fortune 500 HQ in IA)
| Industry | F500 HQs | Revenue |
|---|---|---|
| Financial Services | 1 | $16B |
|
||
| Retail / Convenience | 1 | $15B |
|
||
Price history
+92.2% since first listed5 events — show timeline
- 2026-06-04 Listed $69,000 DMMLS
- 2020-04-06 Sold (MLS) $33,000 IAR
- 2020-04-02 Sold (MLS) $33,000 IAR
- 2020-02-10 Listed $35,900 IAR
- 2019-10-25 Listed $35,900 IAR
Property tax history
-24.3%/yrLatest (2025): $10 · -93.6% YoY. Source: county tax records.
Cash-flow waterfall
monthlySold comps — $/sqft
last 12 mo · ≤1 miLoading sold comps…