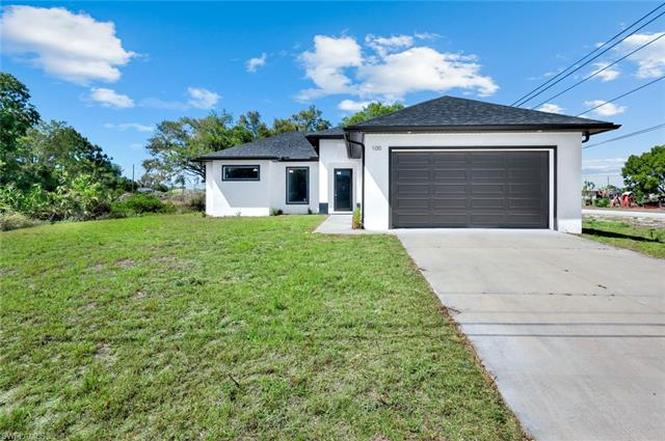
100 Parish Dr · Lehigh Acres, FL
Flood risk 1/10 · Minimal
- FEMA flood zone
- X (unshaded)
- Chance of flooding over 30 yrs
- 0.0%
- Est. flood insurance / yr
- $507 – $1,088
Fire risk 6/10 · Moderate
- Est. fire insurance / yr
- $947 – $1,759
Heat risk 10/10 · Severe
- Hot days now (above 108°F)
- 7 days/yr
- Hot days in 30 yrs
- 29 days/yr
Wind risk 10/10 · Severe
- Chance of severe wind over 30 yrs
- 99.0%
Air-quality risk 2/10 · Minimal
- Unhealthy air days now
- 1 days/yr
- Unhealthy air days in 30 yrs
- 1 days/yr
Risk factors via First Street. Map © Google.
Why this score? — see what drove the D grade
The composite is a weighted blend of 9 inputs, each scored 0–100. Each bar is that input's sub-score; the figure is the points it added to the 100-point composite (weight × sub-score).
- ARV discount +10.2/15.0
- Appreciation +10.0/10.0
- Cash flow +6.8/30.0
- Schools +4.1/10.0
- Livability +3.0/5.0
- Condition / age +2.5/5.0
- 1% rule +1.5/10.0
- Rent growth +1.3/5.0
- DSCR +1.0/10.0
$299,999
🖨 Deal sheet 📄 Offer letter ✓ Due diligence
Listing remarks
Contemporary design, open space, and everyday comfort come together in this beautifully built new construction home located in the growing community of Lehigh Acres. Offering 3 bedrooms and 2 bathrooms, this home delivers the perfect layout for modern living. From the moment you arrive, the sleek modern exterior and clean architectural lines create standout curb appeal. Inside, you’re welcomed by a bright open-concept living space filled with natural light, enhanced by glossy tile flooring and elegant tray ceiling details that elevate the entire space. The kitchen is both stylish and functional, featuring modern shaker cabinetry with crown molding, solid surface countertops, stainless
Key facts
- Versatile den
- Modern exterior
- Tray ceiling detail
Tags
Property features AI
Finance
- Other: Zoning: RS-1; Lot described as regular (approx. 0.2785 acres); Lot dimensions reported by Property Appraiser Office; Section 18, Range 27E
- HOA & community: No HOA maintenance or amenities (community type: see remarks)
Exterior
- Parking: Attached 2-car garage
- Security: Impact resistant doors; Impact resistant windows
- Utilities: Well water; Septic sewer; Cable available
- Home design: Single-family residential; Florida-style; One story; Rear exposure faces east
- Construction: Concrete block construction; Stucco exterior; Shingle roof; Year built 2026
- Exterior features: Patio; Landscaped area/view; Paved public road access
Interior
- Kitchen: Island; Pantry; Electric cooktop; Self-cleaning oven; Microwave; Dishwasher; Refrigerator/Freezer; Breakfast bar / dining in living area
- Bedrooms: 3 bedrooms; At least one bedroom on the first floor
- Flooring: Tile flooring
- Bathrooms: 2 full bathrooms; Master bath with dual sinks and shower (no tub)
- Heating & cooling: Central electric heating; Central electric cooling; Ceiling fans
- Interior features: Pantry; Smoke detectors; Tray ceiling; Walk-in closet; Split bedroom floor plan; Den/Study; Laundry in residence; Unfurnished
- Laundry & utility: Washer/dryer hookup; Auto garage door
Neighborhood map
What this means for you Summary
Snapshot
- This is a 3-bed/2.0-bath single-family listed at $300k.
Deal economics
- At list price, monthly cash flow is $-471 ($-6k/yr) — negative.
- To cash-flow at today's rent, offer at most $217k (27.7% below list).
- To meet the 1% rule (rent ≥ 1% of price), the offer needs to be $195k (35.0% below list).
- Recommended offer: $195k (35.0% below list) — sets the bar for 1% rule.
Location & tenants
- Location reads 59/100 on livability (#826 in FL) — a working-class tenant base; expect higher turnover. Strengths: cost of living A+, housing A+; Watch: crime C-, employment D+, schools D-.
- Lee (suburban): math 47% / reading 50% proficiency, ranked #42 of 73 in FL (top 58%) — families likely to look elsewhere, expect single-tenant / working-renter base with shorter leases.
- Market conditions: Rents falling (-4.7%/yr); 2460 active listings in the ZIP; 40 comparable units currently listed for rent nearby; rentals at typical pace (median 24d on market — plan ~3-4 weeks tenant-placement turnaround); 15,411 units permitted in Lee County in 2024 (4,686 in 5+ unit buildings).
- This rent runs 32% of the median local income ($72k/yr) — at the standard rent-burdened threshold; future hikes will face affordability resistance.
Forward outlook
- In year one you build about $32k of equity ($2k loan paydown + $30k appreciation (10.0% local appreciation)).
- Lee County population projected at +44% by 2050 — long-run rental-demand tailwind backs the buy-and-hold thesis.
- By year 2, paydown + projected appreciation supports a ~$52k cash-out refi (75% LTV) — recoverable capital for the next deal without selling this one.
Negotiation context
- It's been on market 96 days — a 9% lower offer ($273k) is reasonable based on typical stale-listing flexibility.
- Current owner paid $7k; list at $300k implies a 4186% gain — meaningful room to come down on a strong offer.
Risks & watch-outs
- Climate carrying-cost: severe wind risk, 99% chance of damaging wind over 30y; major wildfire risk; extreme-heat days projected 7→29/yr by 2055 (HVAC capex compounding) — expect insurance premiums to compound above CPI over the hold.
Questions for the listing agent
- What do current leases actually rent for vs. the listed asking? Can we see a recent rent roll and the last 12 months of T-12 income?
- It's been on market 96 days. Have you received any prior offers? Is the seller open to a 35% concession, seller financing, or rate buy-down credit?
- Why hasn't it sold? Are there any deal-killer items the seller is aware of (foundation, flood, title, zoning, code violations)?
- Is there a deadline driving the sale (1031 exchange, divorce, estate, relocation)? That informs how much negotiation room exists.
- Schools are D-rated, which usually means shorter tenancies and higher turnover. Who's the typical renter profile here, and what's been the actual vacancy rate?
- The area grade is low — what's the realistic commute time and amenity access for the typical tenant pool here? Any planned neighborhood developments (good or bad) we should know about?
- What's the average days-on-market for RENTAL listings here right now (not sales)? A rising rental-DOM trend means longer vacancies and softer asking-rent achievability than the comps imply.
- What's the recent tenant-quality profile in this submarket — average credit score on applications, eviction rate, late-payment / NSF rate, and stable-employment percentage? A property-management company in the area should have these aggregated.
- How much new for-sale + rental construction is in the pipeline within 1–3 miles? Heavy new supply typically softens prices + rents 12–24 months out; constrained supply supports both.
Investment metrics
- 1% rule
- 0.65% ✗
- Cap rate
- 4.41%
- Cash-on-cash
- -6.73%
- DSCR
- 0.70
- GRM
- 12.8
CMA / ARV
- ARV (on-the-fly)
- $319,288
- Comps found
- 10
Show comp detail 10 sales within ~0.75 mi
| Address | Dist | Beds/Ba | Sqft | Sold | Price | $/sf | Match |
|---|---|---|---|---|---|---|---|
| 717 Zendor Ave | 0.52mi | 3/2.0 | 1,537 (+3%) | 1mo | $350,000 | $228 | 70 |
| 610 Tarapin Ave | 0.20mi | 3/2.0 | 1,392 (-7%) | 22mo | $335,000 | $241 | 61 |
| 138 Zenith Cir | 0.65mi | 3/2.0 | 1,422 (-5%) | 7mo | $355,000 | $250 | 56 |
| 2710 52nd St SW | 0.71mi | 3/2.0 | 1,587 (+6%) | 8mo | $339,000 | $214 | 50 |
| 162 Peerless St | 0.71mi | 3/2.0 | 1,424 (-5%) | 13mo | $300,000 | $211 | 48 |
| 103 Teakwood Ct | 0.29mi | 3/2.0 | 1,283 (-14%) | 23mo | $290,000 | $226 | 44 |
| 4608 Connie Ave S | 0.68mi | 3/2.0 | 1,551 (+4%) | 22mo | $309,999 | $200 | 44 |
| 710 Altair Ave | 0.72mi | 3/2.0 | 1,272 (-15%) | 2mo | $250,000 | $197 | 40 |
| 135 Zenith Cir | 0.65mi | 3/2.0 | 1,691 (+13%) | 21mo | $350,000 | $207 | 30 |
| 715 Rue Labeau Cir | 0.74mi | 3/2.0 | 1,283 (-14%) | 22mo | $265,000 | $207 | 24 |
Match score weights: distance 35% · size 25% · config 20% · recency 20%. Top-matched comps best support the ARV.
Projected returns pro-forma
10.0% appreciation · 0.0% rent growth · sell at horizon
- IRR
- 18.8%
- Equity multiple
- 2.52×
- Total profit
- $127,668
- Equity at exit
- $270,263
- IRR
- 16.9%
- Equity multiple
- 5.63×
- Total profit
- $389,303
- Equity at exit
- $582,832
Cash invested: $84,000 (down + closing). Projections, not guarantees.
Landlord ↔ Tenant lean methodology
- Overall (STATE)
- 87 Strongly Landlord-Friendly
- State Florida
- 87 Strongly Landlord-Friendly · R+3
- County
- — inherits STATE
- City
- — inherits STATE
ZIP-level market 33974
- Home prices YoY
- 5.8%
- Rents YoY
- -4.7%
- Active inventory
- 2460
- Price-to-rent
- 12.8×
Monthly cashflow live
- Estimated rent
- $1,950 high interval (Pro) →
- Mortgage (P&I)
- −$1,573
- Tax from tax record
- −$313 /mo · $3,757/yr
- Insurance
- −$125
- HOA
- −$0
- Vacancy / Maint / Mgmt
- −$409
- Net cashflow
- $-471
Break-even live
UW: 25.0% down · 7.5% · 30yr · 1.5% tax · 5.0% vac · 8.0% maint · 8.0% mgmt
Financing live
Cash to close
- Down payment
- $75,000
- Closing costs
- $9,000
- Reserves months
- —
- Total cash needed
- —
Loan-product check · same deal, 3 products live
Conventional
25% down · 7.5% · 30yr
- Down + closing
- —
- Monthly P&I
- —
- Monthly cashflow
- —
- DSCR
- —
- Eligible?
- —
Personal DTI + credit; lowest rate.
DSCR
20% down · 8.5% · 30yr
- Down + closing
- —
- Monthly P&I
- —
- Monthly cashflow
- —
- DSCR
- —
- Eligible?
- —
No personal income docs; deal must DSCR.
Hard money
10% down · 12.0% · 12mo
- Down + closing
- —
- Monthly P&I
- —
- Monthly cashflow
- —
- DSCR
- —
- Eligible?
- —
Short-term bridge; refi at stabilization.
Rent comps 40 comps
| Address | Beds | Baths | Sqft | Rent | $/sqft | DOM | Units | Dist |
|---|---|---|---|---|---|---|---|---|
| 577 Pierre Cir Lehigh Acres, FL | 3.0 | 2.0 | 1223 | $1,540 | $1.26 | 10d | 1 | 0.06mi |
| 2507 53rd St SW Lehigh Acres, FL | 3.0 | 2.0 | 1714 | $1,950 | $1.14 | 3d | 1 | 0.32mi |
| 2512 54th St SW Lehigh Acres, FL | 4.0 | 2.0 | 1833 | $1,750 | $0.95 | 3d | 1 | 0.36mi |
| 2517 56th St SW Lehigh Acres, FL | 3.0 | 2.0 | 1104 | $1,499 | $1.36 | 2d | 1 | 0.38mi |
| 507 Peerless Cir Lehigh Acres, FL | 3.0 | 2.0 | 1408 | $2,100 | $1.49 | 23d | 1 | 0.47mi |
| 507 Peerless Cir Lehigh Acres, FL | 3.0 | 2.0 | 1408 | $2,000 | $1.42 | 3d | 1 | 0.47mi |
| 2513 48th St SW Lehigh Acres, FL | 3.0 | 2.0 | 1423 | $1,750 | $1.23 | 15d | 1 | 0.54mi |
| 397 Pennfield Ave Lehigh Acres, FL | 4.0 | 2.0 | 1780 | $2,100 | $1.18 | 23d | 1 | 0.59mi |
| 4701 Connie Ave S Lehigh Acres, FL | 3.0 | 2.0 | 1314 | $1,900 | $1.45 | 14d | 1 | 0.59mi |
| 2819 51st St SW Lehigh Acres, FL | 4.0 | 2.0 | 1472 | $2,250 | $1.53 | 23d | 1 | 0.89mi |
| 813 Alabama Rd S Lehigh Acres, FL | 3.0 | 2.0 | 1200 | $1,495 | $1.25 | 23d | 1 | 0.90mi |
| 19542 Fairhill Ct Lehigh Acres, FL | 3.0 | 2.0 | 1429 | $1,700 | $1.19 | 23d | 1 | 0.97mi |
| 304 Preston St Lehigh Acres, FL | 3.0 | 2.0 | 1590 | $2,150 | $1.35 | 3d | 1 | 0.97mi |
| 304 Preston St Unit 304 Lehigh Acres, FL | 3.0 | 2.0 | 1519 | $2,350 | $1.55 | 23d | 1 | 0.97mi |
| 2908 51st St SW Lehigh Acres, FL | 3.0 | 2.0 | 1401 | $1,796 | $1.28 | 3d | 1 | 0.98mi |
| 177 Pennfield St Lehigh Acres, FL | 3.0 | 2.0 | 1250 | $1,850 | $1.48 | 23d | 1 | 0.98mi |
| 208 Pembroke St Lehigh Acres, FL | 3.0 | 2.0 | 1545 | $2,100 | $1.36 | 23d | 1 | 1.02mi |
| 749 Alabama Rd S Unit 749 Lehigh Acres, FL | 3.0 | 2.0 | 1275 | $1,800 | $1.41 | 1d | 1 | 1.02mi |
| 820 Rue Labeau Cir Fort Myers, FL | 3.0 | 2.0 | 1661 | $1,800 | $1.08 | 23d | 1 | 1.03mi |
| 820 Rue Labeau Cir Fort Myers, FL | 3.0 | 2.0 | 1661 | $1,700 | $1.02 | 3d | 1 | 1.03mi |
| 2911 48th St SW Lehigh Acres, FL | 3.0 | 2.0 | 1723 | $2,200 | $1.28 | 10d | 1 | 1.05mi |
| 839 Yellowbird Dr Fort Myers, FL | 3.0 | 2.0 | 1461 | $1,895 | $1.30 | 23d | 1 | 1.06mi |
| 430 Petite Ave Lehigh Acres, FL | 3.0 | 2.0 | 1189 | $1,850 | $1.56 | 14d | 1 | 1.09mi |
| 227 Pennfield St Lehigh Acres, FL | 4.0 | 2.0 | 1732 | $2,275 | $1.31 | 23d | 1 | 1.18mi |
| 337 Marabou Dr Lehigh Acres, FL | 3.0 | 2.0 | 1850 | $2,300 | $1.24 | 3d | 1 | 1.19mi |
| 664 Alabama Rd S Lehigh Acres, FL | 3.0 | 2.0 | 1181 | $1,200 | $1.02 | 23d | 1 | 1.20mi |
| 662 Alabama Rd S Lehigh Acres, FL | 3.0 | 2.0 | 1181 | $1,200 | $1.02 | 23d | 1 | 1.20mi |
| 137 Milwaukee Blvd Lehigh Acres, FL | 3.0 | 2.0 | 1170 | $1,600 | $1.37 | 23d | 1 | 1.22mi |
| 320 Poplar St Lehigh Acres, FL | 3.0 | 2.0 | 1223 | $1,900 | $1.55 | 19d | 1 | 1.22mi |
| 322 Poplar St Lehigh Acres, FL | 3.0 | 2.0 | 1199 | $2,000 | $1.67 | 23d | 1 | 1.23mi |
| 115 Milwaukee Blvd Lehigh Acres, FL | 3.0 | 2.0 | 1209 | $1,600 | $1.32 | 23d | 1 | 1.27mi |
| 234 Pullman St Lehigh Acres, FL | 3.0 | 2.0 | 1392 | $1,800 | $1.29 | 23d | 1 | 1.27mi |
| 4702 Loraine Ave S Lehigh Acres, FL | 3.0 | 2.0 | 1354 | $2,000 | $1.48 | 14d | 1 | 1.27mi |
| 218 Manatee St Fort Myers, FL | 3.0 | 2.0 | 1456 | $1,996 | $1.37 | 3d | 1 | 1.29mi |
| 325 Paulcrest Ave Lehigh Acres, FL | 4.0 | 2.0 | 1619 | $2,300 | $1.42 | 23d | 1 | 1.29mi |
| 722 La Plata Ave Lehigh Acres, FL | 3.0 | 2.0 | 1770 | $1,900 | $1.07 | 15d | 1 | 1.29mi |
| 357 Grant Blvd Lehigh Acres, FL | 3.0 | 2.0 | 1200 | $1,800 | $1.50 | 15d | 1 | 1.29mi |
| 363 Grant Blvd Lehigh Acres, FL | 3.0 | 2.0 | 1158 | $1,700 | $1.47 | 23d | 1 | 1.30mi |
| 98 Milwaukee Blvd Lehigh Acres, FL | 2.0 | 2.0 | 1221 | $1,325 | $1.09 | 3d | 1 | 1.31mi |
| 98 Milwaukee Blvd Lehigh Acres, FL | 2.0 | 2.0 | 1221 | $1,325 | $1.09 | 23d | 1 | 1.31mi |
Listing history 17 events
-
2026-06-17days on market $299,999 Active 96 DOM
-
2026-06-16days on market $299,999 Active 95 DOM
-
2026-06-15days on market $299,999 Active 94 DOM
-
2026-06-13days on market $299,999 Active 92 DOM
-
2026-06-10days on market $299,999 Active 89 DOM
-
2026-06-09days on market $299,999 Active 88 DOM
-
2026-06-07days on market $299,999 Active 86 DOM
-
2026-06-03days on market $299,999 Active 82 DOM
-
2026-06-02days on market $299,999 Active 81 DOM
-
2026-06-01days on market $299,999 Active 80 DOM
-
2026-06-01days on market $299,999 Active 79 DOM
-
2026-04-15price $299,999
-
2026-04-13price $319,999
-
2026-03-31price $329,999
-
2026-03-13$339,999 Active
-
2020-12-18soldstatus $7,000
-
1988-02-05soldstatus $9,900
ⓘ Source: listings_history table (triggers on properties + properties_extension) + one-shot
backfill from property_details.listing_events for pre-trigger history.
Tax reassessment forecast FL · Resets to sale price
- Current annual tax
- $3,757 · $313/mo
- Projected year-2 tax
- $3,757 · $313/mo
- Expected delta
- $0/yr ($0/mo · 0.0%)
ⓘ Screening estimate from a state-policy table — verify with the county assessor before closing.
Climate risk First Street
- Flood 1/10 Low FEMA zone X (unshaded) · 0% chance over 30 yrs
- Wildfire 6/10 Major
- Heat 10/10 Extreme 7 d/yr ≥108°F today · 29 d/yr by 30 yrs out
- Wind 10/10 Extreme 99% chance of damaging wind over 30 yrs
- Air quality 2/10 Low 1 unhealthy d/yr today · 1 by 30 yrs out
Nearby sold comps map
Loading sold comps map…
Walkable amenities ~0.75 mi
Loading nearby amenities…
Taxation est. · year 1
- Rental income
- $23,398
- − Mortgage interest
- −$16,805
- − Property taxes
- −$3,757
- − Insurance
- −$1,500
- − Repairs & maintenance
- −$1,872
- − Management
- −$1,872
- − Depreciation
- −$8,727
- Taxable loss
- −$11,135
- Est. tax savings @ 24.0%
- +$2,672
- After-tax cash flow
- $-2,979/yr
For passive investors: Depreciation is non-cash, so a rental often shows a tax loss while cash-flowing — sheltering income. Rental losses are passive: they offset passive income freely, and up to $25,000/yr can offset ordinary (W-2) income if you actively participate and your MAGI is under $100k (phasing out to $0 by $150k); unused losses carry forward. On sale, claimed depreciation is recaptured at up to 25%, and gains may owe capital-gains tax (a 1031 exchange can defer both). Figures are a year-1 estimate at your 24.0% rate — not tax advice; consult a CPA.
Schools (NCES district)
- District
- Lee
- NCES district ID
- 1201080
- Math proficiency
- 47% ▼ -11.00%
- Reading proficiency
- 50% ▼ -4.00%
- Median HH income
- $49,518
- Composite
- 41.49/100
- National rank
- #3458
- State rank
- #42 of 73 in FL
Livability — Lehigh Acres
- Score
- 59/100
- State rank
- #826
- US rank
- #20055
Category grades
Schools grade is shown separately in the Schools card above.
Census & demographics
- Census place
- Lehigh Acres, FL
- County
- Lee County · 788,662 people
- City population
- 130,638
- Metro
- Cape Coral-Fort Myers, FL
- Population (ZIP)
- 19,927
- Household income
- $72,192
- Rent vs Own
- Severe rent burden
- 434.0
Population outlook (Lee County) Hauer SSP2
- Today (2025)
- 871,946 people
- By 2030
- 955,468 · +9.6%
- By 2040
- 1,113,587 · +27.7%
- By 2050
- 1,256,891 · +44.1%
- By 2075
- 1,560,270 · +78.9%
- By 2100
- 1,726,848 · +98.0%
Race, ethnicity, and origin ACS 2023
- Neighborhood character
- Diverse neighborhood (Simpson 0.64)
- Race & ethnicity
- Hispanic / Latino 52% Two or more races 31% White 26% Black 18%
- Hispanic origin (detail)
- Mexican 12% Puerto Rican 7% Cuban 20% Dominican 4%
- Common ancestry
- Hispanic 7% Italian 1% Portuguese 1%
- Foreign-born
- 32% · Canada, Jamaica
- Languages at home
- 48% English-only · Spanish 43% French/Haitian/Cajun 7% Other Indo-European 1%
Political lean MEDSL · Lee
- 2024 margin
- Strong R (+28.4) · D 35.5% · R 63.9%
- 2008→2024 swing
- -18.0pp toward R · 2008: -10.4pp · 2024: -28.4pp
- All cycles
- 2024: R+28.4 2020: R+19.2 2016: R+20.4 2012: R+16.6 2008: R+10.4
Not yet ingested
- Civics
- —
Market trends
- HPI YoY
- ▲ 16.53%
- Current HPI
- 303.3399
- Rent YoY
- ▼ -4.68%
- Metro
- Cape Coral-Fort Myers, FL
- State GDP YoY
- ▲ 3.28%
- F500 in state
- 36
Industry mix (Fortune 500 HQ in FL)
| Industry | F500 HQs | Revenue |
|---|---|---|
| Industrial Technology | 2 | $29B |
|
||
| Insurance | 2 | $17B |
|
||
| Retail | 1 | $60B |
|
||
| Technology Distribution | 1 | $58B |
|
||
| Homebuilding | 1 | $35B |
|
||
| Technology Manufacturing | 1 | $35B |
|
||
Price history
+2930.3% since first listed6 events — show timeline
- 2026-04-15 Price Changed $299,999 NAPLESMLS
- 2026-04-13 Price Changed $319,999 NAPLESMLS
- 2026-03-31 Price Changed $329,999 NAPLESMLS
- 2026-03-13 Listed $339,999 NAPLESMLS
- 2020-12-18 Sold (Public Records) $7,000 Public Records
- 1988-02-05 Sold (Public Records) $9,900 Public Records
Property tax history
+216.5%/yrLatest (2025): $3,757 · +784.7% YoY. Source: county tax records.
Cash-flow waterfall
monthlySold comps — $/sqft
last 12 mo · ≤1 miLoading sold comps…