 🏗️ New Construction
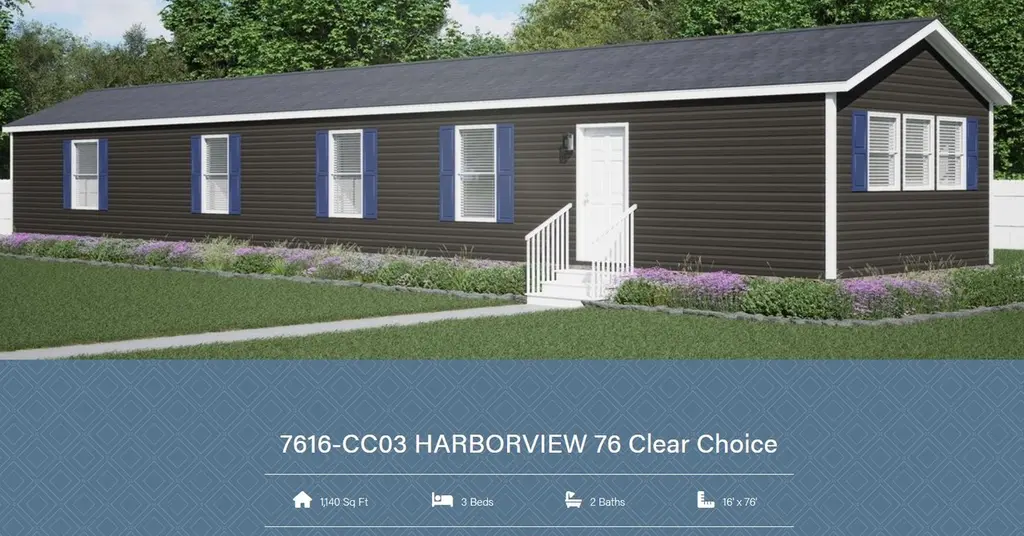
Clayton Harborview 76 (16x76) Plan · Ghent, KY
Flood risk 5/10 · Moderate
- FEMA flood zone
- X (unshaded)
- Chance of flooding over 30 yrs
- 0.65%
- Est. flood insurance / yr
- $507 – $1,088
Fire risk 3/10 · Minor
- Est. fire insurance / yr
- $839 – $1,559
Heat risk 4/10 · Minor
- Hot days now (above 104°F)
- 7 days/yr
- Hot days in 30 yrs
- 19 days/yr
Wind risk 2/10 · Minimal
- Chance of severe wind over 30 yrs
- 1.0%
Air-quality risk 3/10 · Minor
- Unhealthy air days now
- 2 days/yr
- Unhealthy air days in 30 yrs
- 4 days/yr
Risk factors via First Street. Map © Google.
Why this score? — see what drove the B- grade
The composite is a weighted blend of 9 inputs, each scored 0–100. Each bar is that input's sub-score; the figure is the points it added to the 100-point composite (weight × sub-score).
- Cash flow +25.7/30.0
- 1% rule +10.0/10.0
- DSCR +8.6/10.0
- ARV discount +7.5/15.0
- Appreciation +5.3/10.0
- Livability +3.0/5.0
- Rent growth +2.5/5.0
- Schools +1.5/10.0
- Condition / age +1.0/5.0
$78,874
🖨 Deal sheet 📄 Offer letter ✓ Due diligence
Listing remarks
Designed around larger gathering spaces and a more open residential feel, the Clayton Clear Choice Harborview 76 offers approximately 1,140 square feet of living space with 3 bedrooms, 2 bathrooms, and a layout focused on comfort and connection. The oversized living room and open kitchen create a bright central space ideal for entertaining or everyday living, while the split-bedroom layout provides additional privacy for the primary suite. Features like stainless steel appliances, recessed LED lighting, durable cabinetry, and energy-efficient design including 2x6 exterior wall construction help create a modern and welcoming living experience. Base pricing is turn-key and includes two exteri
Key facts
- Split-bedroom layout
- Durable cabinetry
- Open kitchen
Tags
Property features AI
Finance
- Other: List price listed (see listing) — plan/home inventory type: Plan; Address marketed as Clayton Harborview 76 (16x76) Plan, Ghent KY 41045
- HOA & community: Association fee approximately $450 (period not specified)
Exterior
- Utilities: Electric service; Central HVAC with heat pump
- Home design: Manufactured home plan: Clayton Harborview 76 (16x76); New construction plan
- Construction: Living area approximately 1,140 (per plan)
- Exterior features: Asphalt roof
Interior
- Kitchen: Standard kitchen included (plan)
- Bedrooms: 3 bedrooms
- Bathrooms: 2 full bathrooms
- Heating & cooling: Electric heating with heat pump; Central air conditioning
- Interior features: Open floor plan (model/plan home)
- Laundry & utility: Laundry/utility area included (plan)
Neighborhood map
What this means for you Summary
Snapshot
- This is a 3-bed/2.0-bath manufactured listed at $79k. Condition is rated poor.
Deal economics
- At list price, monthly cash flow is $190 ($2k/yr) — positive.
- The deal already cash-flows at list — no discount required.
- Meets the 1% rule at list price ($2k rent vs $79k).
- Recommended offer: $78k (1.5% below list) — sets the bar for market timing.
Location & tenants
- Location reads 60/100 on livability (#384 in KY) — a middle-class / working-renter tenant base. Strengths: cost of living A+, housing A+; Watch: schools F, amenities F, commute F.
- Carroll County (town): math 12% / reading 23% proficiency, ranked #163 of 165 in KY (top 99%) — low school quality limits family demand, transient renter base, plan for 1-2y turnover.
- Market conditions: 24 active listings in the ZIP; 1 comparable units currently listed for rent nearby; 3 units permitted in Carroll County in 2024 (0 in 5+ unit buildings).
Forward outlook
- In year one you build about $1k of equity ($546 loan paydown + $457 appreciation (0.6% local appreciation)).
- Carroll County population projected at -15% by 2050 — secular population decline; favor cash flow + early exit over multi-decade hold.
- At projected returns (0.6% appreciation + 3.0% rent growth), your $22k cash investment doubles in ~6 years — after that, you're playing with house money.
Negotiation context
- It's been on market 27 days — a 2% lower offer ($78k) is reasonable based on typical stale-listing flexibility.
Risks & watch-outs
- Watch-outs: HOA is 30% of rent.
- Climate carrying-cost: moderate flood risk — expect insurance premiums to compound above CPI over the hold.
Questions for the listing agent
- Have any recent inspections been done? Can we get a copy of the seller's disclosures and any deferred-maintenance estimates?
- What does the HOA fee cover, when was the last increase, and are there any pending special assessments or reserve-fund shortfalls?
- Is there a deadline driving the sale (1031 exchange, divorce, estate, relocation)? That informs how much negotiation room exists.
- Schools are F-rated, which usually means shorter tenancies and higher turnover. Who's the typical renter profile here, and what's been the actual vacancy rate?
- What's the average days-on-market for RENTAL listings here right now (not sales)? A rising rental-DOM trend means longer vacancies and softer asking-rent achievability than the comps imply.
- What's the recent tenant-quality profile in this submarket — average credit score on applications, eviction rate, late-payment / NSF rate, and stable-employment percentage? A property-management company in the area should have these aggregated.
- How much new for-sale + rental construction is in the pipeline within 1–3 miles? Heavy new supply typically softens prices + rents 12–24 months out; constrained supply supports both.
Investment metrics
- 1% rule
- 1.90% ✓
- Cap rate
- 9.18%
- Cash-on-cash
- 10.32%
- DSCR
- 1.46
- GRM
- 4.4
CMA / ARV
No comps found within radius.
Projected returns pro-forma
0.58% appreciation · 3.0% rent growth · sell at horizon
- IRR
- 11.2%
- Equity multiple
- 1.56×
- Total profit
- $12,261
- Equity at exit
- $25,214
- IRR
- 15.6%
- Equity multiple
- 2.83×
- Total profit
- $40,332
- Equity at exit
- $32,220
Cash invested: $22,085 (down + closing). Projections, not guarantees.
Landlord ↔ Tenant lean methodology
- Overall (STATE)
- 83 Strongly Landlord-Friendly
- State Kentucky
- 83 Strongly Landlord-Friendly · R+16
- County
- — inherits STATE
- City
- — inherits STATE
ZIP-level market 41045
- Home prices YoY
- 0.3%
- Active inventory
- 24
- Price-to-rent
- 4.4×
Monthly cashflow live
- Estimated rent
- $1,500 medium interval (Pro) →
- Mortgage (P&I)
- −$414
- Tax est. 1.5%
- −$99 /mo · $1,183/yr
- Insurance
- −$33
- HOA
- −$450
- Vacancy / Maint / Mgmt
- −$315
- Net cashflow
- $190
Break-even live
UW: 25.0% down · 7.5% · 30yr · 1.5% tax · 5.0% vac · 8.0% maint · 8.0% mgmt
Financing live
Cash to close
- Down payment
- $19,718
- Closing costs
- $2,366
- Reserves months
- —
- Total cash needed
- —
Loan-product check · same deal, 3 products live
Conventional
25% down · 7.5% · 30yr
- Down + closing
- —
- Monthly P&I
- —
- Monthly cashflow
- —
- DSCR
- —
- Eligible?
- —
Personal DTI + credit; lowest rate.
DSCR
20% down · 8.5% · 30yr
- Down + closing
- —
- Monthly P&I
- —
- Monthly cashflow
- —
- DSCR
- —
- Eligible?
- —
No personal income docs; deal must DSCR.
Hard money
10% down · 12.0% · 12mo
- Down + closing
- —
- Monthly P&I
- —
- Monthly cashflow
- —
- DSCR
- —
- Eligible?
- —
Short-term bridge; refi at stabilization.
Rent comps 1 comps
| Address | Beds | Baths | Sqft | Rent | $/sqft | DOM | Units | Dist |
|---|---|---|---|---|---|---|---|---|
| 516 Pearl St Apt 2 Vevay, IN | 3.0 | 2.0 | 1500 | $1,500 | $1.00 | 43d | 1 | 1.42mi |
HOA detail
- Monthly dues
- $450 · $5,400/yr
Listing history 15 events
-
2026-06-18days on market $78,874 Active 27 DOM
-
2026-06-17days on market $78,874 Active 26 DOM
-
2026-06-16days on market $78,874 Active 25 DOM
-
2026-06-15days on market $78,874 Active 24 DOM
-
2026-06-13pricedays on market $78,874 Active 22 DOM
-
2026-06-12days on market $81,478 Active 21 DOM
-
2026-06-09days on market $81,478 Active 18 DOM
-
2026-06-08days on market $81,478 Active 17 DOM
-
2026-06-07days on market $81,478 Active 16 DOM
-
2026-06-07days on market $81,478 Active 15 DOM
-
2026-06-04days on market $81,478 Active 12 DOM
-
2026-06-02days on market $81,478 Active 11 DOM
-
2026-06-01days on market $81,478 Active 10 DOM
-
2026-05-31days on market $81,478 Active 9 DOM
-
2026-05-31days on market $81,478 Active 8 DOM
ⓘ Source: listings_history table (triggers on properties + properties_extension) + one-shot
backfill from property_details.listing_events for pre-trigger history.
Climate risk First Street
- Flood 5/10 Major FEMA zone X (unshaded) · 65% chance over 30 yrs
- Wildfire 3/10 Moderate
- Heat 4/10 Moderate 7 d/yr ≥104°F today · 19 d/yr by 30 yrs out
- Wind 2/10 Low 100% chance of damaging wind over 30 yrs
- Air quality 3/10 Moderate 2 unhealthy d/yr today · 4 by 30 yrs out
Nearby sold comps map
Loading sold comps map…
Walkable amenities ~0.75 mi
Loading nearby amenities…
Taxation est. · year 1
- Rental income
- $18,000
- − Mortgage interest
- −$4,418
- − Property taxes
- −$1,183
- − Insurance
- −$394
- − Repairs & maintenance
- −$1,440
- − Management
- −$1,440
- − HOA
- −$5,400
- − Depreciation
- −$2,295
- Taxable income
- $1,430
- Est. tax owed @ 24.0%
- −$343
- After-tax cash flow
- $1,936/yr
For passive investors: Depreciation is non-cash, so a rental often shows a tax loss while cash-flowing — sheltering income. Rental losses are passive: they offset passive income freely, and up to $25,000/yr can offset ordinary (W-2) income if you actively participate and your MAGI is under $100k (phasing out to $0 by $150k); unused losses carry forward. On sale, claimed depreciation is recaptured at up to 25%, and gains may owe capital-gains tax (a 1031 exchange can defer both). Figures are a year-1 estimate at your 24.0% rate — not tax advice; consult a CPA.
Condition & rehab AI · 1 photo
This manufactured home requires extensive repairs and updates to its roof, exterior, flooring, interior walls, and systems. Significant investment is needed to bring it up to a livable condition.
Repairs flagged
- Major roof — No visible roof in the satellite image.
- Major exterior — No visible exterior in the satellite image.
- Major flooring — No visible flooring in the satellite image.
- Major interior walls/paint — No visible interior walls/paint in the satellite image.
- Major systems — No visible systems in the satellite image.
Value-add opportunities
- Both roof replacement — A new roof would significantly improve the home's appearance and functionality.
- Both exterior siding and paint — A fresh exterior would enhance curb appeal and increase the home's value.
- Both flooring replacement — New flooring would improve the home's aesthetic and functionality.
- Both interior wall and paint work — Fresh paint and possibly new walls would greatly improve the home's interior appearance.
- Both system upgrades — Upgrading systems like HVAC and electrical would improve the home's functionality and energy efficiency.
Renovation cost estimate screening
| Repair item | Severity | Est. cost |
|---|---|---|
| roof · No visible roof in the satellite image. | Major | $15,000–50,000 |
| exterior · No visible exterior in the satellite image. | Major | $15,000–50,000 |
| flooring · No visible flooring in the satellite image. | Major | $15,000–50,000 |
| interior walls/paint · No visible interior walls/paint in the satellite image. | Major | $15,000–50,000 |
| systems · No visible systems in the satellite image. | Major | $15,000–50,000 |
| Total estimated repair cost · 5 items | $75,000–250,000 |
Value-add ROI direction
- Both roof replacement — A new roof would significantly improve the home's appearance and functionality. ↑
- Both exterior siding and paint — A fresh exterior would enhance curb appeal and increase the home's value. ↑
- Both flooring replacement — New flooring would improve the home's aesthetic and functionality. ↑
- Both interior wall and paint work — Fresh paint and possibly new walls would greatly improve the home's interior appearance. ↑
- Both system upgrades — Upgrading systems like HVAC and electrical would improve the home's functionality and energy efficiency. ↑
ⓘ Cost ranges are severity-bucket heuristics (US national rule-of-thumb). Get contractor quotes + a written scope before underwriting a rehab budget.
Schools (NCES district)
- District
- Carroll County
- NCES district ID
- 2100990
- Math proficiency
- 12% ▼ -14.00%
- Reading proficiency
- 23% ▼ -15.00%
- Median HH income
- $41,646
- Composite
- 15.0/100
- National rank
- #9361
- State rank
- #163 of 165 in KY
Livability — Ghent
- Score
- 60/100
- State rank
- #384
- US rank
- #18633
Category grades
Schools grade is shown separately in the Schools card above.
Census & demographics
- Census place
- Ghent, KY
- Population (ZIP)
- 1,222
Population outlook (Carroll County) Hauer SSP2
- Today (2025)
- 10,359 people
- By 2030
- 10,058 · -2.9%
- By 2040
- 9,465 · -8.6%
- By 2050
- 8,788 · -15.2%
- By 2075
- 7,079 · -31.7%
- By 2100
- 5,066 · -51.1%
Race, ethnicity, and origin ACS 2023
- Neighborhood character
- Predominantly White (86%)
- Race & ethnicity
- White 86% Two or more races 11% Hispanic / Latino 6% Black 1%
- Hispanic origin (detail)
- Mexican 3%
- Common ancestry
- Serbian 7% Romanian 5% English 1%
- Foreign-born
- 2% · Canada
- Languages at home
- 94% English-only · Spanish 6%
Political lean MEDSL · Carroll
- 2024 margin
- Solid R (+51.0) · D 23.9% · R 74.9% · Other 1.2%
- 2008→2024 swing
- -42.7pp toward R · 2008: -8.2pp · 2024: -51.0pp
- All cycles
- 2024: R+51.0 2020: R+44.4 2016: R+38.5 2012: R+10.1 2008: R+8.2
Not yet ingested
- Civics
- —
Market trends
- HPI YoY
- ▲ 0.58%
- Current HPI
- 215.636
- Rent YoY
- —
- Metro
- —
- State GDP YoY
- ▲ 1.81%
- F500 in state
- 4
Industry mix (Fortune 500 HQ in KY)
| Industry | F500 HQs | Revenue |
|---|---|---|
| Healthcare | 1 | $118B |
|
||
| Food / Beverage | 1 | $7B |
|
||
Cash-flow waterfall
monthlySold comps — $/sqft
last 12 mo · ≤1 miLoading sold comps…