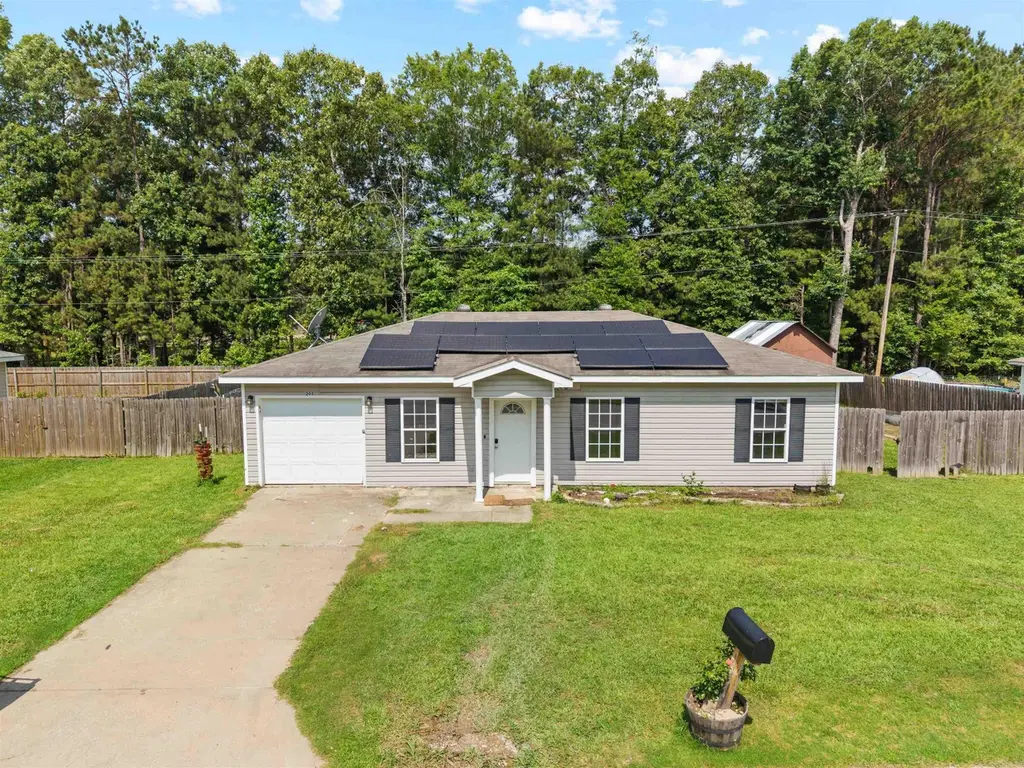
205 Glenn Oaks Dr · Haskell, AR
Flood risk 1/10 · Minimal
- FEMA flood zone
- X (unshaded)
- Chance of flooding over 30 yrs
- 0.0%
- Est. flood insurance / yr
- $507 – $1,088
Fire risk 4/10 · Minor
- Est. fire insurance / yr
- $1,499 – $2,785
Heat risk 6/10 · Moderate
- Hot days now (above 110°F)
- 7 days/yr
- Hot days in 30 yrs
- 20 days/yr
Wind risk 4/10 · Minor
- Chance of severe wind over 30 yrs
- 11.0%
Air-quality risk 2/10 · Minimal
- Unhealthy air days now
- 0 days/yr
- Unhealthy air days in 30 yrs
- 1 days/yr
Risk factors via First Street. Map © Google.
Why this score? — see what drove the C- grade
The composite is a weighted blend of 9 inputs, each scored 0–100. Each bar is that input's sub-score; the figure is the points it added to the 100-point composite (weight × sub-score).
- Cash flow +23.7/30.0
- DSCR +7.6/10.0
- 1% rule +5.7/10.0
- ARV discount +3.9/15.0
- Livability +3.9/5.0
- Schools +3.5/10.0
- Rent growth +2.7/5.0
- Condition / age +2.5/5.0
- Appreciation +0.0/10.0
$135,000
🖨 Deal sheet (PDF) 📄 Offer letter ✓ Due diligence
Listing remarks MLS
Check out this well maintained family home! Features include updated lighting, painting, flooring, and baths. This home is perfect for the first-time homebuyer, call today to make this your new home!
Key facts
- Owners suite
- Garden
- Solar panels
Tags
Property features AI
Finance
- Financial info: Financing available: Cash, FHA, Conventional, VA, Rural Development
Exterior
- Parking: Garage with auto door opener
- Utilities: Public sewer; Public water; Municipal electric service (Entergy); Natural gas; Solar panels; Insulated doors and windows
- Home design: Frame with metal/vinyl siding; Composition roof; Slab foundation
- Construction: Frame construction; Metal/vinyl siding; Composition roof; Slab foundation
- Exterior features: Patio; Wood fence; Paved road access; Level lot; Located in a subdivision; Inside city limits
Interior
- Kitchen: Free-standing stove
- Flooring: Tile; Carpet
- Bathrooms: 2 full bathrooms
- Heating & cooling: Central cooling (electric); Central gas heat
- Interior features: Smoke detectors; Ceiling fans; Sheetrock walls/ceilings
Neighborhood map
What this means for you Summary
Snapshot
- This is a 3-bed/2.0-bath single-family listed at $135k.
Deal economics
- At list price, monthly cash flow is $258 ($3k/yr) — positive.
- The deal already cash-flows at list — no discount required.
- Meets the 1% rule at list price ($1k rent vs $135k).
- Cap rate 8.6% vs local median 3.6% in Haskell — top-decile yield for the area; either an underpriced asset or a hidden risk that comps aren't pricing in. Stress-test before assuming the spread holds.
Location & tenants
- Location reads 77/100 on livability (#12 in AR, #3,200 nationally) — a middle-class / working-renter tenant base. Strengths: crime A+, cost of living A+, housing A+; Watch: amenities F, commute F.
- Harmony Grove School District (suburban): math 39% / reading 42% proficiency, ranked #58 of 238 in AR (top 24%) — families likely to look elsewhere, expect single-tenant / working-renter base with shorter leases.
- Zoned schools: Westbrook Elementary School (math 47% / reading 42%, grade F, #143 of 454 statewide, top 36%, 373 students, 40% FRL); Harmony Grove Junior High School (math 30% / reading 39%, grade F, #124 of 201 statewide, top 62%, 303 students, 35% FRL); Harmony Grove High School (math 17% / reading 27%, grade F, #213 of 292 statewide, top 77%, 299 students, 27% FRL) — zoned schools at 34% FRL track the district average.
- Market conditions: Rents flat; 203 active listings in the ZIP; 1 comparable units currently listed for rent nearby; 446 units permitted in Saline County in 2024 (0 in 5+ unit buildings).
Forward outlook
- Local home prices are declining (-3.0%/yr); year-one equity from $933 of loan paydown is wiped out by about $4k of value loss. Plan a longer hold.
- Saline County population projected at +39% by 2050 — long-run rental-demand tailwind backs the buy-and-hold thesis.
Negotiation context
- Only 1 days on market — expect competitive offers; lowballing is unlikely to land.
- 5 sale attempts since 15y ago with the ask held roughly flat each time — persistent listings suggest the price (not the market) is what's stuck; bring a comps-based counter.
Risks & watch-outs
- Climate carrying-cost: extreme-heat days projected 7→20/yr by 2055 (HVAC capex compounding) — expect insurance premiums to compound above CPI over the hold.
Questions for the listing agent
- Is there a deadline driving the sale (1031 exchange, divorce, estate, relocation)? That informs how much negotiation room exists.
- Schools are A-rated — typically a magnet for longer-tenancy family renters. What's the average tenant stay here, and is there a school-zone premium baked into asking?
- What's the average days-on-market for RENTAL listings here right now (not sales)? A rising rental-DOM trend means longer vacancies and softer asking-rent achievability than the comps imply.
- What's the recent tenant-quality profile in this submarket — average credit score on applications, eviction rate, late-payment / NSF rate, and stable-employment percentage? A property-management company in the area should have these aggregated.
- How much new for-sale + rental construction is in the pipeline within 1–3 miles? Heavy new supply typically softens prices + rents 12–24 months out; constrained supply supports both.
Investment metrics
- 1% rule
- 1.07% ✓
- Cap rate
- 8.58%
- Cash-on-cash
- 8.18%
- DSCR
- 1.36
- GRM
- 7.8
CMA / ARV
- ARV (on-the-fly)
- $125,120
- Comps found
- 3
Show comp detail 3 sales within ~0.75 mi
| Address | Dist | Beds/Ba | Sqft | Sold | Price | $/sf | Match |
|---|---|---|---|---|---|---|---|
| 1445 Pine Dr | 0.17mi | 4/2.0 (+1) | 1,215 (+12%) | 0mo | $157,000 | $129 | 68 |
| 119 N Taft St | 0.53mi | 3/1.5 | 1,152 (+6%) | 10mo | $132,000 | $115 | 55 |
| 125 N Roosevelt St | 0.74mi | 2/2.0 (-1) | 1,217 (+12%) | 8mo | $130,000 | $107 | 34 |
Match score weights: distance 35% · size 25% · config 20% · recency 20%. Top-matched comps best support the ARV.
Projected returns pro-forma
-3.0% appreciation · 0.73% rent growth · sell at horizon
- IRR
- -6.3%
- Equity multiple
- 0.77×
- Total profit
- $-8,694
- Equity at exit
- $20,129
- IRR
- 0.4%
- Equity multiple
- 1.02×
- Total profit
- $898
- Equity at exit
- $11,672
Cash invested: $37,800 (down + closing). Projections, not guarantees.
Landlord ↔ Tenant lean methodology
- Overall (STATE)
- 92 Strongly Landlord-Friendly
- State Arkansas
- 92 Strongly Landlord-Friendly · R+14
- County
- — inherits STATE
- City
- — inherits STATE
ZIP-level market 72015
- Home prices YoY
- -11.1%
- Rents YoY
- 0.7%
- Active inventory
- 203
- Price-to-rent
- 7.8×
Monthly cashflow live
- Estimated rent
- $1,441 medium interval (Pro) →
- Mortgage (P&I)
- −$708
- Tax from tax record
- −$117 /mo · $1,403/yr
- Insurance
- −$56
- HOA
- −$0
- Vacancy / Maint / Mgmt
- −$303
- Net cashflow
- $258
Break-even live
Sensitivity live
| Price | -10% $334 | -5% $296 | +0% $258 | +5% $219 | +10% $181 |
|---|---|---|---|---|---|
| Rent | -10% $144 | -5% $201 | +0% $258 | +5% $315 | +10% $372 |
| Rate | -1.0pp $326 | -0.5pp $292 | base $258 | +0.5pp $223 | +1.0pp $187 |
UW: 25.0% down · 7.5% · 30yr · 1.5% tax · 5.0% vac · 8.0% maint · 8.0% mgmt
Financing live
Cash to close
- Down payment
- $33,750
- Closing costs
- $4,050
- Reserves months
- —
- Total cash needed
- —
Loan-product check · same deal, 3 products live
Conventional
25% down · 7.5% · 30yr
- Down + closing
- —
- Monthly P&I
- —
- Monthly cashflow
- —
- DSCR
- —
- Eligible?
- —
Personal DTI + credit; lowest rate.
DSCR
20% down · 8.5% · 30yr
- Down + closing
- —
- Monthly P&I
- —
- Monthly cashflow
- —
- DSCR
- —
- Eligible?
- —
No personal income docs; deal must DSCR.
Hard money
10% down · 12.0% · 12mo
- Down + closing
- —
- Monthly P&I
- —
- Monthly cashflow
- —
- DSCR
- —
- Eligible?
- —
Short-term bridge; refi at stabilization.
Rent comps 1 comps
| Address | Beds | Baths | Sqft | Rent | $/sqft | DOM | Units | Dist |
|---|---|---|---|---|---|---|---|---|
| 1451 Pine Haskell Dr Benton, AR | 4.0 | 2.0 | 1244 | $1,445 | $1.16 | 16d | 1 | 0.16mi |
Listing history 2 events
-
2026-06-13remarks 652-char remark
-
2026-06-13$135,000 Under Contract 1 DOM
ⓘ Source: listings_history table (triggers on properties + properties_extension) + one-shot
backfill from property_details.listing_events for pre-trigger history.
Tax reassessment forecast AR · Resets to sale price
- Current annual tax
- $1,403 · $117/mo
- Projected year-2 tax
- $1,403 · $117/mo
- Expected delta
- $0/yr ($0/mo · 0.0%)
ⓘ Screening estimate from a state-policy table — verify with the county assessor before closing.
Climate risk First Street
- Flood 1/10 Low FEMA zone X (unshaded) · 0% chance over 30 yrs
- Wildfire 4/10 Moderate
- Heat 6/10 Major 7 d/yr ≥110°F today · 20 d/yr by 30 yrs out
- Wind 4/10 Moderate 11% chance of damaging wind over 30 yrs
- Air quality 2/10 Low 0 unhealthy d/yr today · 1 by 30 yrs out
Nearby sold comps map
Loading sold comps map…
Walkable amenities ~0.75 mi
Loading nearby amenities…
Taxation est. · year 1
- Rental income
- $17,298
- − Mortgage interest
- −$7,562
- − Property taxes
- −$1,403
- − Insurance
- −$675
- − Repairs & maintenance
- −$1,384
- − Management
- −$1,384
- − Depreciation
- −$3,927
- Taxable income
- $963
- Est. tax owed @ 24.0%
- −$231
- After-tax cash flow
- $2,861/yr
For passive investors: Depreciation is non-cash, so a rental often shows a tax loss while cash-flowing — sheltering income. Rental losses are passive: they offset passive income freely, and up to $25,000/yr can offset ordinary (W-2) income if you actively participate and your MAGI is under $100k (phasing out to $0 by $150k); unused losses carry forward. On sale, claimed depreciation is recaptured at up to 25%, and gains may owe capital-gains tax (a 1031 exchange can defer both). Figures are a year-1 estimate at your 24.0% rate — not tax advice; consult a CPA.
Schools (NCES district)
- District
- Harmony Grove School District
- NCES district ID
- 0507320
- Math proficiency
- 39% ▼ -10.00%
- Reading proficiency
- 42% ▼ -4.00%
- Median HH income
- $55,062
- Composite
- 35.39/100
- National rank
- #4948
- State rank
- #58 of 238 in AR
Livability — Haskell
- Score
- 77/100
- State rank
- #12
- US rank
- #3200
Category grades
Schools grade is shown separately in the Schools card above.
Census & demographics
- Census place
- Haskell, AR
- County
- Saline County · 77,216 people
- Metro
- Little Rock-North Little Rock-Conway, AR
- Population (ZIP)
- 28,712
- Household income
- $66,107
- Rent vs Own
- Severe rent burden
- 439.0
Population outlook (Saline County) Hauer SSP2
- Today (2025)
- 140,141 people
- By 2030
- 151,233 · +7.9%
- By 2040
- 173,100 · +23.5%
- By 2050
- 194,368 · +38.7%
- By 2075
- 245,295 · +75.0%
- By 2100
- 279,117 · +99.2%
Race, ethnicity, and origin ACS 2023
- Neighborhood character
- Predominantly White (79%)
- Race & ethnicity
- White 79% Black 10% Two or more races 6% Hispanic / Latino 5%
- Common ancestry
- Slovak 3% Italian 2% Lithuanian 1%
- Foreign-born
- 2% · Canada, Vietnam
- Languages at home
- 97% English-only · Spanish 3% Vietnamese 0%
Political lean MEDSL · Saline
- 2024 margin
- Solid R (+40.1) · D 28.8% · R 69.0% · Other 2.2%
- 2008→2024 swing
- +0.8pp no change · 2008: -41.0pp · 2024: -40.1pp
- All cycles
- 2024: R+40.1 2020: R+41.2 2016: R+43.5 2012: R+42.7 2008: R+41.0
Not yet ingested
- Civics
- —
Market trends
- HPI YoY
- ▼ -29.11%
- Current HPI
- 234.4644
- Rent YoY
- ▲ 0.73%
- Metro
- Little Rock-North Little Rock-Conway, AR
- State GDP YoY
- ▲ 3.80%
- F500 in state
- 10
Industry mix (Fortune 500 HQ in AR)
| Industry | F500 HQs | Revenue |
|---|---|---|
| Retail | 1 | $681B |
|
||
| Food / Agriculture | 1 | $53B |
|
||
| Retail / Energy | 1 | $22B |
|
||
| Transportation / Logistics | 1 | $12B |
|
||
| Energy | 1 | $4B |
|
||
Price history
-52.6% since first listed20 events — show timeline
- 2026-06-12 Pending — CARMLS
- 2026-06-12 Contingent — CARMLS
- 2026-06-11 Listed $135,000 CARMLS
- 2022-12-05 Sold (Public Records) $125,000 Public Records
- 2022-12-01 Sold (MLS) $125,000 CARMLS
- 2022-11-05 Pending — CARMLS
- 2022-11-01 Listed $125,000 CARMLS
- 2020-03-04 Sold (Public Records) $103,900 Public Records
- 2020-02-27 Sold (MLS) $103,900 CARMLS
- 2020-01-07 Pending — CARMLS
- 2019-12-30 Listed $103,900 CARMLS
- 2014-01-28 Sold (Public Records) $77,000 Public Records
- 2014-01-24 Sold (MLS) $77,000 CARMLS
- 2013-07-28 Listing Removed — CARMLS
- 2013-05-13 Listed $79,000 CARMLS
- 2011-05-27 Sold (MLS) $60,000 CARMLS
- 2011-05-09 Listing Removed — CARMLS
- 2011-04-12 Listed $58,500 CARMLS
- 2011-03-11 Sold (Public Records) $1,102,760 Public Records
- 2005-06-15 Sold (Public Records) $285,000 Public Records
Property tax history
+8.4%/yrLatest (2025): $1,403 · +0.0% YoY. Source: county tax records.
Cash-flow waterfall
monthlySold comps — $/sqft
last 12 mo · ≤1 miLoading sold comps…