112 Heim · Wofford Heights, CA
Flood risk 1/10 · Minimal
- FEMA flood zone
- X (unshaded)
- Chance of flooding over 30 yrs
- 0.0%
- Est. flood insurance / yr
- $507 – $1,088
Fire risk 8/10 · Major
- Est. fire insurance / yr
- $659 – $1,223
Heat risk 6/10 · Moderate
- Hot days now (above 101°F)
- 7 days/yr
- Hot days in 30 yrs
- 19 days/yr
Wind risk 1/10 · Minimal
- Chance of severe wind over 30 yrs
- —
Air-quality risk 10/10 · Severe
- Unhealthy air days now
- 26 days/yr
- Unhealthy air days in 30 yrs
- 33 days/yr
Risk factors via First Street. Map © Google.
Why this score? — see what drove the D grade
The composite is a weighted blend of 9 inputs, each scored 0–100. Each bar is that input's sub-score; the figure is the points it added to the 100-point composite (weight × sub-score).
- Appreciation +10.0/10.0
- Cash flow +9.2/30.0
- ARV discount +7.5/15.0
- DSCR +2.6/10.0
- Schools +2.6/10.0
- Rent growth +2.5/5.0
- Condition / age +2.5/5.0
- Livability +2.2/5.0
- 1% rule +1.6/10.0
$153,000
🖨 Deal sheet (PDF) 📄 Offer letter ✓ Due diligence
Listing remarks
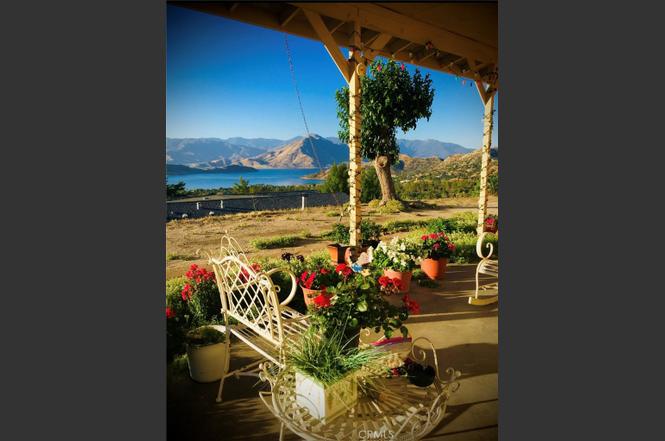
OWN YOUR OWN LAND! Imagine owning your own home on 2/3 of an acre — your own little slice of heaven. This charming 2 bedroom, 1 bathroom mobile home sits on private property with unobstructed, breathtaking views of Lake Isabella and the surrounding mountains. This cozy retreat offers abundant natural light throughout, spacious rooms, and a generous 12x12 bedroom with a walk-in closet, spacious 2nd bedroom. The home features a large carport, abundant parking. New roof installed in 2022, vinyl dual-pane windows, newer flooring, and a carpeted bedroom. The updated kitchen comes complete with a Kohler sink, new refrigerator, and new gas stove. Enjoy year-round comfort with a new swamp co
Key facts
- Covered patio
- Abundant parking
- Unobstructed views
Tags
Property features AI
Finance
- HOA & community: Community offers watersports, fishing, access to BLM/National Forest, foothills and lake recreation
Exterior
- Utilities: Septic (type unknown)
- Home design: Manufactured house; Single-story; Entry on main level
- Construction: Year built: estimated; No common walls
- Exterior features: No pool; 0–1 unit per acre lot density; Has a view
Interior
- Bedrooms: Bedroom(s) located on the main level
- Flooring: Vinyl flooring; Carpet; Wood flooring; Laminate flooring
- Bathrooms: 1 full bathroom with shower
- Heating & cooling: Central furnace heating; Evaporative cooling
- Interior features: All bedrooms on main level; One-story home; Main level entry
- Laundry & utility: Laundry room inside; Washer included; Dryer included; Gas dryer hookup; Individual laundry room
Neighborhood map
What this means for you Summary
Snapshot
- This is a 2-bed/1.0-bath manufactured listed at $153k.
Deal economics
- At list price, monthly cash flow is $-115 ($-1k/yr) — negative.
- To cash-flow at today's rent, offer at most $133k (13.3% below list).
- To meet the 1% rule (rent ≥ 1% of price), the offer needs to be $101k (34.0% below list).
- Recommended offer: $101k (34.0% below list) — sets the bar for 1% rule.
- Cap rate 5.4% vs local median 3.8% in Wofford Heights — top-decile yield for the area; either an underpriced asset or a hidden risk that comps aren't pricing in. Stress-test before assuming the spread holds.
Location & tenants
- Location reads 45/100 on livability (#1,317 in CA) — a working-class tenant base; expect higher turnover. Strengths: crime B, cost of living B; Watch: schools F, amenities F, commute F.
- Kernville Union Elementary (rural): math 20% / reading 37% proficiency, ranked #1,128 of 1,400 in CA (top 81%) — low school quality limits family demand, transient renter base, plan for 1-2y turnover; 65% free/reduced lunch — lower-income household profile, screen leases tightly.
- Market conditions: 94 active listings in the ZIP; 3,244 units permitted in Kern County in 2024 (73 in 5+ unit buildings).
Forward outlook
- In year one you build about $16k of equity ($1k loan paydown + $15k appreciation (10.0% local appreciation)).
- Kern County population projected at +17% by 2050 — long-run rental-demand tailwind backs the buy-and-hold thesis.
- By year 3, paydown + projected appreciation supports a ~$41k cash-out refi (75% LTV) — recoverable capital for the next deal without selling this one.
Negotiation context
- Only 7 days on market — expect competitive offers; lowballing is unlikely to land.
Risks & watch-outs
- Climate carrying-cost: severe wildfire risk; extreme-heat days projected 7→19/yr by 2055 (HVAC capex compounding) — expect insurance premiums to compound above CPI over the hold.
Questions for the listing agent
- What do current leases actually rent for vs. the listed asking? Can we see a recent rent roll and the last 12 months of T-12 income?
- Built in 1970 — when were the roof, HVAC, electrical panel, plumbing, and water heater last replaced?
- Is there a deadline driving the sale (1031 exchange, divorce, estate, relocation)? That informs how much negotiation room exists.
- Schools are F-rated, which usually means shorter tenancies and higher turnover. Who's the typical renter profile here, and what's been the actual vacancy rate?
- The area grade is low — what's the realistic commute time and amenity access for the typical tenant pool here? Any planned neighborhood developments (good or bad) we should know about?
- What's the average days-on-market for RENTAL listings here right now (not sales)? A rising rental-DOM trend means longer vacancies and softer asking-rent achievability than the comps imply.
- What's the recent tenant-quality profile in this submarket — average credit score on applications, eviction rate, late-payment / NSF rate, and stable-employment percentage? A property-management company in the area should have these aggregated.
- How much new for-sale + rental construction is in the pipeline within 1–3 miles? Heavy new supply typically softens prices + rents 12–24 months out; constrained supply supports both.
Investment metrics
- 1% rule
- 0.66% ✗
- Cap rate
- 5.39%
- Cash-on-cash
- -3.23%
- DSCR
- 0.86
- GRM
- 12.6
CMA / ARV
- ARV (on-the-fly)
- $87,550
- Comps found
- 6
Show comp detail 6 sales within ~0.75 mi
| Address | Dist | Beds/Ba | Sqft | Sold | Price | $/sf | Match |
|---|---|---|---|---|---|---|---|
| 168 Merrill Rd | 0.16mi | 1/1.0 (-1) | 776 (-9%) | 9mo | $92,500 | $119 | 66 |
| 1040 Evans Rd Unit B2 | 0.50mi | 2/1.0 | 840 (-1%) | 21mo | $28,500 | $34 | 57 |
| 5 Patricia Ln | 0.42mi | 2/2.0 | 960 (+13%) | 7mo | $57,500 | $60 | 49 |
| 1122 Bristlecone Dr | 0.46mi | 2/1.5 | 960 (+13%) | 11mo | $181,000 | $189 | 46 |
| 108 Pinewood Dr | 0.67mi | 2/1.0 | 800 (-6%) | 19mo | $50,000 | $63 | 43 |
| 173 Lakeview Ter | 0.48mi | 1/1.5 (-1) | 728 (-14%) | 19mo | $75,000 | $103 | 31 |
Match score weights: distance 35% · size 25% · config 20% · recency 20%. Top-matched comps best support the ARV.
Projected returns pro-forma
10.0% appreciation · 3.0% rent growth · sell at horizon
- IRR
- 22.0%
- Equity multiple
- 2.77×
- Total profit
- $75,921
- Equity at exit
- $137,835
- IRR
- 19.7%
- Equity multiple
- 6.35×
- Total profit
- $229,195
- Equity at exit
- $297,245
Cash invested: $42,840 (down + closing). Projections, not guarantees.
Landlord ↔ Tenant lean methodology
- Overall (STATE)
- 18 Strongly Tenant-Friendly
- State California
- 18 Strongly Tenant-Friendly · D+13
- County
- — inherits STATE
- City
- — inherits STATE
ZIP-level market 93285
- Home prices YoY
- 4.8%
- Active inventory
- 94
- Price-to-rent
- 12.6×
Monthly cashflow live
- Estimated rent
- $1,010 medium interval (Pro) →
- Mortgage (P&I)
- −$802
- Tax from tax record
- −$47 /mo · $561/yr
- Insurance
- −$64
- HOA
- −$0
- Vacancy / Maint / Mgmt
- −$212
- Net cashflow
- $-115
Break-even live
Sensitivity live
| Price | -10% $-29 | -5% $-72 | +0% $-115 | +5% $-158 | +10% $-202 |
|---|---|---|---|---|---|
| Rent | -10% $-195 | -5% $-155 | +0% $-115 | +5% $-75 | +10% $-35 |
| Rate | -1.0pp $-38 | -0.5pp $-76 | base $-115 | +0.5pp $-155 | +1.0pp $-195 |
UW: 25.0% down · 7.5% · 30yr · 1.5% tax · 5.0% vac · 8.0% maint · 8.0% mgmt
Financing live
Cash to close
- Down payment
- $38,250
- Closing costs
- $4,590
- Reserves months
- —
- Total cash needed
- —
Loan-product check · same deal, 3 products live
Conventional
25% down · 7.5% · 30yr
- Down + closing
- —
- Monthly P&I
- —
- Monthly cashflow
- —
- DSCR
- —
- Eligible?
- —
Personal DTI + credit; lowest rate.
DSCR
20% down · 8.5% · 30yr
- Down + closing
- —
- Monthly P&I
- —
- Monthly cashflow
- —
- DSCR
- —
- Eligible?
- —
No personal income docs; deal must DSCR.
Hard money
10% down · 12.0% · 12mo
- Down + closing
- —
- Monthly P&I
- —
- Monthly cashflow
- —
- DSCR
- —
- Eligible?
- —
Short-term bridge; refi at stabilization.
Listing history 7 events
-
2026-06-18days on market $153,000 Active 7 DOM
-
2026-06-17days on market $153,000 Active 6 DOM
-
2026-06-16days on market $153,000 Active 5 DOM
-
2026-06-15days on market $153,000 Active 4 DOM
-
2026-06-14days on market $153,000 Active 2 DOM
-
2026-06-13remarks 693-char remark
-
2026-06-13$153,000 Active 1 DOM
ⓘ Source: listings_history table (triggers on properties + properties_extension) + one-shot
backfill from property_details.listing_events for pre-trigger history.
Tax reassessment forecast CA · Resets to sale price
- Current annual tax
- $561 · $47/mo
- Projected year-2 tax
- $1,163 · $97/mo
- Expected delta
- +$602/yr (+$50/mo · 107.3%)
ⓘ Screening estimate from a state-policy table — verify with the county assessor before closing.
Climate risk First Street
- Flood 1/10 Low FEMA zone X (unshaded) · 0% chance over 30 yrs
- Wildfire 8/10 Severe
- Heat 6/10 Major 7 d/yr ≥101°F today · 19 d/yr by 30 yrs out
- Wind 1/10 Low
- Air quality 10/10 Extreme 26 unhealthy d/yr today · 33 by 30 yrs out
Nearby sold comps map
Loading sold comps map…
Walkable amenities ~0.75 mi
Loading nearby amenities…
Taxation est. · year 1
- Rental income
- $12,117
- − Mortgage interest
- −$8,570
- − Property taxes
- −$561
- − Insurance
- −$765
- − Repairs & maintenance
- −$969
- − Management
- −$969
- − Depreciation
- −$4,451
- Taxable loss
- −$4,169
- Est. tax savings @ 24.0%
- +$1,001
- After-tax cash flow
- $-381/yr
For passive investors: Depreciation is non-cash, so a rental often shows a tax loss while cash-flowing — sheltering income. Rental losses are passive: they offset passive income freely, and up to $25,000/yr can offset ordinary (W-2) income if you actively participate and your MAGI is under $100k (phasing out to $0 by $150k); unused losses carry forward. On sale, claimed depreciation is recaptured at up to 25%, and gains may owe capital-gains tax (a 1031 exchange can defer both). Figures are a year-1 estimate at your 24.0% rate — not tax advice; consult a CPA.
Schools (NCES district)
- District
- Kernville Union Elementary
- NCES district ID
- 0619590
- Math proficiency
- 20% ▲ 4.00%
- Reading proficiency
- 37% ▲ 11.00%
- Median HH income
- $29,896
- Composite
- 25.91/100
- National rank
- #12766
- State rank
- #1128 of 1400 in CA
Livability — Wofford Heights
- Score
- 45/100
- State rank
- #1317
- US rank
- #26674
Category grades
Schools grade is shown separately in the Schools card above.
Census & demographics
- Census place
- Wofford Heights, CA
- Population (ZIP)
- 2,415
Population outlook (Kern County) Hauer SSP2
- Today (2025)
- 947,286 people
- By 2030
- 978,984 · +3.3%
- By 2040
- 1,045,018 · +10.3%
- By 2050
- 1,105,232 · +16.7%
- By 2075
- 1,229,538 · +29.8%
- By 2100
- 1,238,059 · +30.7%
Race, ethnicity, and origin ACS 2023
- Neighborhood character
- Predominantly White (80%)
- Race & ethnicity
- White 80% Hispanic / Latino 19% Two or more races 6%
- Hispanic origin (detail)
- Mexican 17%
- Common ancestry
- Romanian 4% Subsaharan African 4% Iranian 2%
- Foreign-born
- 8% · Canada
- Languages at home
- 78% English-only · Spanish 15% Russian/Polish/Slavic 8%
Political lean MEDSL · Kern
- 2024 margin
- Strong R (+21.1) · D 38.2% · R 59.3% · Other 2.5%
- 2008→2024 swing
- -3.3pp toward R · 2008: -17.8pp · 2024: -21.1pp
- All cycles
- 2024: R+21.1 2020: R+10.2 2016: R+15.0 2012: R+20.9 2008: R+17.8
Not yet ingested
- Civics
- —
Market trends
- HPI YoY
- ▲ 12.11%
- Current HPI
- 264.1726
- Rent YoY
- —
- Metro
- —
- State GDP YoY
- ▲ 3.21%
- F500 in state
- 116
Industry mix (Fortune 500 HQ in CA)
| Industry | F500 HQs | Revenue |
|---|---|---|
| Technology | 27 | $1,492B |
|
||
| Financial Services | 3 | $174B |
|
||
| Retail | 3 | $44B |
|
||
| Insurance | 3 | $26B |
|
||
| Media / Entertainment | 2 | $115B |
|
||
| Pharmaceuticals / Biotech | 2 | $62B |
|
||
Price history
1 event — show timeline
- 2026-06-11 Listed $153,000 CRMLS
Property tax history
+3.8%/yrLatest (2025): $561 · +2.9% YoY. Source: county tax records.
Cash-flow waterfall
monthlySold comps — $/sqft
last 12 mo · ≤1 miLoading sold comps…