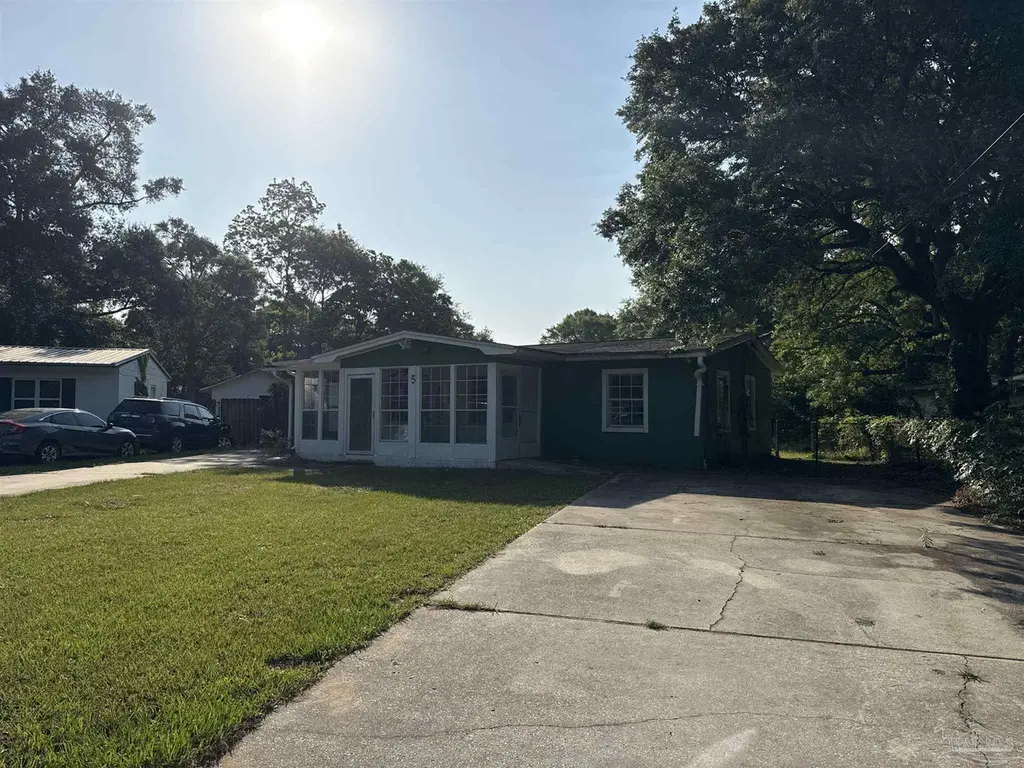
5 Haven Ct · West Pensacola, FL
Flood risk 1/10 · Minimal
- FEMA flood zone
- X (unshaded)
- Chance of flooding over 30 yrs
- 0.0%
- Est. flood insurance / yr
- $507 – $1,088
Fire risk 3/10 · Minor
- Est. fire insurance / yr
- $947 – $1,759
Heat risk 10/10 · Severe
- Hot days now (above 105°F)
- 6 days/yr
- Hot days in 30 yrs
- 20 days/yr
Wind risk 9/10 · Severe
- Chance of severe wind over 30 yrs
- 99.0%
Air-quality risk 1/10 · Minimal
- Unhealthy air days now
- 0 days/yr
- Unhealthy air days in 30 yrs
- 0 days/yr
Risk factors via First Street. Map © Google.
Why this score? — see what drove the B+ grade
The composite is a weighted blend of 9 inputs, each scored 0–100. Each bar is that input's sub-score; the figure is the points it added to the 100-point composite (weight × sub-score).
- Cash flow +30.0/30.0
- ARV discount +15.0/15.0
- DSCR +10.0/10.0
- 1% rule +8.1/10.0
- Schools +3.6/10.0
- Rent growth +3.5/5.0
- Livability +3.3/5.0
- Condition / age +2.5/5.0
- Appreciation +0.0/10.0
$120,000
🖨 Deal sheet 📄 Offer letter ✓ Due diligence
Listing remarks
Looking for a 3bed/ 1 bath home that you can add your own personal touches to? Then look no further! From the spacious living room area to a large backyard the possibilities are endless. Oh, and did I mention it also has a Florida room in the front of the home and also a storage shed? I can go on and on mentioning more about what this property has to offer, but this is one that you must truly see to believe. Call to schedule your appointment today before this one slips away! * Buyer to verify room dimensions, tax info. , gross living area and schools *
Key facts
- Large backyard
- Florida room
- Storage shed
Tags
Property features AI
Finance
- Other: Lot is approximately 0.22 acres
- HOA & community: No association
Exterior
- Parking: Driveway with open parking
- Utilities: Public water; Public sewer; Electric with circuit breakers
- Home design: Single-story block construction; Not attached to another property; Resale property
- Construction: Block construction; Slab foundation; One level; 990 total building area
- Exterior features: Composition roof; Paved, county-maintained public road; Does not allow horses
Interior
- Kitchen: Electric water heater
- Bedrooms: Primary bedroom on the first floor (12' x 10')
- Flooring: Vinyl
- Bathrooms: 1 full bathroom
- Heating & cooling: Central heating; Central air; Ceiling fan(s)
- Interior features: Living/dining combo; Vinyl flooring
Neighborhood map
What this means for you Summary
Snapshot
- This is a 3-bed/1.0-bath single-family listed at $120k.
Deal economics
- At list price, monthly cash flow is $450 ($5k/yr) — positive.
- The deal already cash-flows at list — no discount required.
- Meets the 1% rule at list price ($2k rent vs $120k).
- Recommended offer: $118k (1.5% below list) — sets the bar for market timing.
- Cap rate 10.8% vs local median 7.7% in West Pensacola — top-decile yield for the area; either an underpriced asset or a hidden risk that comps aren't pricing in. Stress-test before assuming the spread holds.
Location & tenants
- Location reads 66/100 on livability (#629 in FL) — a middle-class / working-renter tenant base. Strengths: cost of living A+, housing A+, health & safety B+; Watch: crime D, schools F, amenities F.
- Escambia (suburban): math 40% / reading 45% proficiency, ranked #56 of 73 in FL (top 77%) — families likely to look elsewhere, expect single-tenant / working-renter base with shorter leases.
- Market conditions: Rents rising (+3.9%/yr); 270 active listings in the ZIP; 9 comparable units currently listed for rent nearby; rentals at typical pace (median 21d on market — plan ~3-4 weeks tenant-placement turnaround); 1,479 units permitted in Escambia County in 2024 (0 in 5+ unit buildings).
- This rent runs 30% of the median local income ($62k/yr) — at the standard rent-burdened threshold; future hikes will face affordability resistance.
Forward outlook
- Local home prices are declining (-3.0%/yr); year-one equity from $830 of loan paydown is wiped out by about $4k of value loss. Plan a longer hold.
- Escambia County population projected at +13% by 2050 — modest demand growth; plan on rents tracking national, not racing it.
- At projected returns (-3.0% appreciation + 3.9% rent growth), your $34k cash investment doubles in ~7 years — after that, you're playing with house money.
Negotiation context
- It's been on market 25 days — a 2% lower offer ($118k) is reasonable based on typical stale-listing flexibility.
- Current owner paid $40k; list at $120k implies a 200% gain — meaningful room to come down on a strong offer.
Risks & watch-outs
- Watch-outs: built in 1953 — expect roof / HVAC / electrical / plumbing capex.
- Climate carrying-cost: severe wind risk, 99% chance of damaging wind over 30y; extreme-heat days projected 6→20/yr by 2055 (HVAC capex compounding) — expect insurance premiums to compound above CPI over the hold.
Questions for the listing agent
- Built in 1953 — when were the roof, HVAC, electrical panel, plumbing, and water heater last replaced?
- Is there a deadline driving the sale (1031 exchange, divorce, estate, relocation)? That informs how much negotiation room exists.
- Schools are F-rated, which usually means shorter tenancies and higher turnover. Who's the typical renter profile here, and what's been the actual vacancy rate?
- Crime grade is D in this area — have there been break-ins, vandalism, or insurance claims at this property in the last 3 years? What carrier currently insures it and at what premium?
- What's the average days-on-market for RENTAL listings here right now (not sales)? A rising rental-DOM trend means longer vacancies and softer asking-rent achievability than the comps imply.
- What's the recent tenant-quality profile in this submarket — average credit score on applications, eviction rate, late-payment / NSF rate, and stable-employment percentage? A property-management company in the area should have these aggregated.
- How much new for-sale + rental construction is in the pipeline within 1–3 miles? Heavy new supply typically softens prices + rents 12–24 months out; constrained supply supports both.
Investment metrics
- 1% rule
- 1.31% ✓
- Cap rate
- 10.80%
- Cash-on-cash
- 16.09%
- DSCR
- 1.72
- GRM
- 6.3
CMA / ARV
- ARV (on-the-fly)
- $149,490
- Comps found
- 12
Show comp detail 12 sales within ~0.75 mi
| Address | Dist | Beds/Ba | Sqft | Sold | Price | $/sf | Match |
|---|---|---|---|---|---|---|---|
| 4957 Elsa Ave | 0.06mi | 3/1.0 | 1,000 (+1%) | 6mo | $144,000 | $144 | 91 |
| 1106 N 50th Ave | 0.06mi | 3/2.0 | 1,086 (+10%) | 5mo | $190,000 | $175 | 73 |
| 4905 State St | 0.13mi | 3/1.0 | 1,074 (+8%) | 11mo | $185,000 | $172 | 71 |
| 4953 Martha Ave | 0.06mi | 3/2.0 | 1,120 (+13%) | 4mo | $220,000 | $196 | 68 |
| 122 State St | 0.40mi | 2/1.0 (-1) | 940 (-5%) | 7mo | $156,000 | $166 | 62 |
| 5527 Lynwood Rd | 0.74mi | 3/1.0 | 974 (-2%) | 3mo | $110,000 | $113 | 60 |
| 31 Randolph Dr | 0.53mi | 3/1.0 | 918 (-7%) | 6mo | $129,500 | $141 | 58 |
| 41 Pen Haven Dr | 0.53mi | 3/1.0 | 925 (-7%) | 7mo | $150,000 | $162 | 58 |
| 1416 N 48th Ave | 0.40mi | 3/2.0 | 1,123 (+13%) | 1mo | $159,000 | $142 | 54 |
| 50 Pen Haven Dr | 0.58mi | 3/1.0 | 904 (-9%) | 6mo | $85,000 | $94 | 54 |
| 258 Omega Ct | 0.71mi | 3/1.0 | 1,098 (+11%) | 5mo | $127,500 | $116 | 45 |
| 254 Chestnut St | 0.73mi | 2/1.0 (-1) | 928 (-6%) | 10mo | $140,000 | $151 | 42 |
Match score weights: distance 35% · size 25% · config 20% · recency 20%. Top-matched comps best support the ARV.
Projected returns pro-forma
-3.0% appreciation · 3.85% rent growth · sell at horizon
- IRR
- 8.0%
- Equity multiple
- 1.32×
- Total profit
- $10,611
- Equity at exit
- $17,892
- IRR
- 17.9%
- Equity multiple
- 2.54×
- Total profit
- $51,880
- Equity at exit
- $10,375
Cash invested: $33,600 (down + closing). Projections, not guarantees.
Landlord ↔ Tenant lean methodology
- Overall (STATE)
- 87 Strongly Landlord-Friendly
- State Florida
- 87 Strongly Landlord-Friendly · R+3
- County
- — inherits STATE
- City
- — inherits STATE
ZIP-level market 32506
- Home prices YoY
- -22.5%
- Rents YoY
- 3.9%
- Active inventory
- 270
- Price-to-rent
- 6.3×
Monthly cashflow live
- Estimated rent
- $1,578 high interval (Pro) →
- Mortgage (P&I)
- −$629
- Tax from tax record
- −$117 /mo · $1,401/yr
- Insurance
- −$50
- HOA
- −$0
- Vacancy / Maint / Mgmt
- −$331
- Net cashflow
- $450
Break-even live
UW: 25.0% down · 7.5% · 30yr · 1.5% tax · 5.0% vac · 8.0% maint · 8.0% mgmt
Financing live
Cash to close
- Down payment
- $30,000
- Closing costs
- $3,600
- Reserves months
- —
- Total cash needed
- —
Loan-product check · same deal, 3 products live
Conventional
25% down · 7.5% · 30yr
- Down + closing
- —
- Monthly P&I
- —
- Monthly cashflow
- —
- DSCR
- —
- Eligible?
- —
Personal DTI + credit; lowest rate.
DSCR
20% down · 8.5% · 30yr
- Down + closing
- —
- Monthly P&I
- —
- Monthly cashflow
- —
- DSCR
- —
- Eligible?
- —
No personal income docs; deal must DSCR.
Hard money
10% down · 12.0% · 12mo
- Down + closing
- —
- Monthly P&I
- —
- Monthly cashflow
- —
- DSCR
- —
- Eligible?
- —
Short-term bridge; refi at stabilization.
Rent comps 9 comps
| Address | Beds | Baths | Sqft | Rent | $/sqft | DOM | Units | Dist |
|---|---|---|---|---|---|---|---|---|
| 4519 Martha Ave Pensacola, FL | 3.0 | 1.0 | 1104 | $1,600 | $1.45 | 23d | 1 | 0.41mi |
| 101 Vanderbilt Rd Pensacola, FL | 3.0 | 2.0 | 1104 | $1,850 | $1.68 | 21d | 1 | 0.63mi |
| 5501 Mayfair Dr Pensacola, FL | 3.0 | 1.0 | 912 | $1,295 | $1.42 | 23d | 1 | 0.75mi |
| 316 Teakwood Cir Pensacola, FL | 2.0 | 1.5 | 1024 | $1,350 | $1.32 | 13d | 1 | 0.87mi |
| 1505 N 62nd Ave Pensacola, FL | 2.0 | 1.0 | 665 | $950 | $1.43 | 23d | 1 | 0.92mi |
| 4600 Twin Oaks Dr Pensacola, FL | 1.0–2.0 | 1.0 | 838 | $1,499 | $1.79 | 13d | 29 | 0.94mi |
| 190 N Old Corry Field Rd Pensacola, FL | 1.0–2.0 | 1.0–2.0 | 915 | $1,174 | $1.28 | 13d | 3 | 1.15mi |
| 7200 Lillian Hwy Pensacola, FL | 2.0 | 1.0 | 675 | $1,200 | $1.78 | 13d | 11 | 1.43mi |
| 3740 Frontera Cir Pensacola, FL | 3.0 | 1.0 | 1024 | $1,295 | $1.26 | 23d | 1 | 1.47mi |
Listing history 17 events
-
2026-06-18days on market $120,000 Active 25 DOM
-
2026-06-17days on market $120,000 Active 24 DOM
-
2026-06-16days on market $120,000 Active 23 DOM
-
2026-06-15days on market $120,000 Active 22 DOM
-
2026-06-14days on market $120,000 Active 20 DOM
-
2026-06-10days on market $120,000 Active 17 DOM
-
2026-06-09days on market $120,000 Active 16 DOM
-
2026-06-08days on market $120,000 Active 15 DOM
-
2026-06-07days on market $120,000 Active 14 DOM
-
2026-06-03days on market $120,000 Active 10 DOM
-
2026-06-02days on market $120,000 Active 9 DOM
-
2026-06-01days on market $120,000 Active 8 DOM
-
2026-05-31days on market $120,000 Active 7 DOM
-
2026-05-31days on market $120,000 Active 6 DOM
-
2026-05-24$120,000 Active
-
2021-11-22soldstatus $40,000
-
1968-01-01soldstatus $9,000
ⓘ Source: listings_history table (triggers on properties + properties_extension) + one-shot
backfill from property_details.listing_events for pre-trigger history.
Tax reassessment forecast FL · Resets to sale price
- Current annual tax
- $1,401 · $117/mo
- Projected year-2 tax
- $1,401 · $117/mo
- Expected delta
- $0/yr ($0/mo · 0.0%)
ⓘ Screening estimate from a state-policy table — verify with the county assessor before closing.
Climate risk First Street
- Flood 1/10 Low FEMA zone X (unshaded) · 0% chance over 30 yrs
- Wildfire 3/10 Moderate
- Heat 10/10 Extreme 6 d/yr ≥105°F today · 20 d/yr by 30 yrs out
- Wind 9/10 Extreme 99% chance of damaging wind over 30 yrs
- Air quality 1/10 Low 0 unhealthy d/yr today · 0 by 30 yrs out
Nearby sold comps map
Loading sold comps map…
Walkable amenities ~0.75 mi
Loading nearby amenities…
Taxation est. · year 1
- Rental income
- $18,934
- − Mortgage interest
- −$6,722
- − Property taxes
- −$1,401
- − Insurance
- −$600
- − Repairs & maintenance
- −$1,515
- − Management
- −$1,515
- − Depreciation
- −$3,491
- Taxable income
- $3,691
- Est. tax owed @ 24.0%
- −$886
- After-tax cash flow
- $4,520/yr
For passive investors: Depreciation is non-cash, so a rental often shows a tax loss while cash-flowing — sheltering income. Rental losses are passive: they offset passive income freely, and up to $25,000/yr can offset ordinary (W-2) income if you actively participate and your MAGI is under $100k (phasing out to $0 by $150k); unused losses carry forward. On sale, claimed depreciation is recaptured at up to 25%, and gains may owe capital-gains tax (a 1031 exchange can defer both). Figures are a year-1 estimate at your 24.0% rate — not tax advice; consult a CPA.
Schools (NCES district)
- District
- Escambia
- NCES district ID
- 1200510
- Math proficiency
- 40% ▼ -9.00%
- Reading proficiency
- 45% ▼ -4.00%
- Median HH income
- $44,649
- Composite
- 36.04/100
- National rank
- #4773
- State rank
- #56 of 73 in FL
Livability — West Pensacola
- Score
- 66/100
- State rank
- #629
- US rank
- #12275
Category grades
Schools grade is shown separately in the Schools card above.
Census & demographics
- Census place
- West Pensacola, FL
- County
- Escambia County · 301,722 people
- Metro
- Pensacola-Ferry Pass-Brent, FL
- Population (ZIP)
- 34,549
- Household income
- $62,486
- Rent vs Own
- Severe rent burden
- 1359.0
Population outlook (Escambia County) Hauer SSP2
- Today (2025)
- 334,637 people
- By 2030
- 345,779 · +3.3%
- By 2040
- 364,828 · +9.0%
- By 2050
- 378,514 · +13.1%
- By 2075
- 403,220 · +20.5%
- By 2100
- 386,125 · +15.4%
Race, ethnicity, and origin ACS 2023
- Neighborhood character
- Diverse neighborhood (Simpson 0.60)
- Race & ethnicity
- White 60% Black 18% Two or more races 11% Hispanic / Latino 6% Asian 6%
- Hispanic origin (detail)
- Mexican 3%
- Common ancestry
- Lithuanian 4% Slovak 2% Italian 2%
- Foreign-born
- 9% · Canada, China, Vietnam
- Languages at home
- 89% English-only · Spanish 4% Tagalog/Filipino 2% Other Indo-European 1%
Political lean MEDSL · Escambia
- 2024 margin
- R (+19.5) · D 39.7% · R 59.2% · Other 1.1%
- 2008→2024 swing
- -0.2pp no change · 2008: -19.3pp · 2024: -19.5pp
- All cycles
- 2024: R+19.5 2020: R+15.1 2016: R+20.6 2012: R+20.6 2008: R+19.3
Not yet ingested
- Civics
- —
Market trends
- HPI YoY
- ▼ -71.86%
- Current HPI
- 247.6085
- Rent YoY
- ▲ 3.85%
- Metro
- Pensacola-Ferry Pass-Brent, FL
- State GDP YoY
- ▲ 3.28%
- F500 in state
- 36
Industry mix (Fortune 500 HQ in FL)
| Industry | F500 HQs | Revenue |
|---|---|---|
| Industrial Technology | 2 | $29B |
|
||
| Insurance | 2 | $17B |
|
||
| Retail | 1 | $60B |
|
||
| Technology Distribution | 1 | $58B |
|
||
| Homebuilding | 1 | $35B |
|
||
| Technology Manufacturing | 1 | $35B |
|
||
Price history
+1233.3% since first listed3 events — show timeline
- 2026-05-24 Listed $120,000 PARMLS
- 2021-11-22 Sold (Public Records) $40,000 Public Records
- 1968-01-01 Sold (Public Records) $9,000 Public Records
Property tax history
+29.6%/yrLatest (2025): $1,401 · +7.8% YoY. Source: county tax records.
Cash-flow waterfall
monthlySold comps — $/sqft
last 12 mo · ≤1 miLoading sold comps…