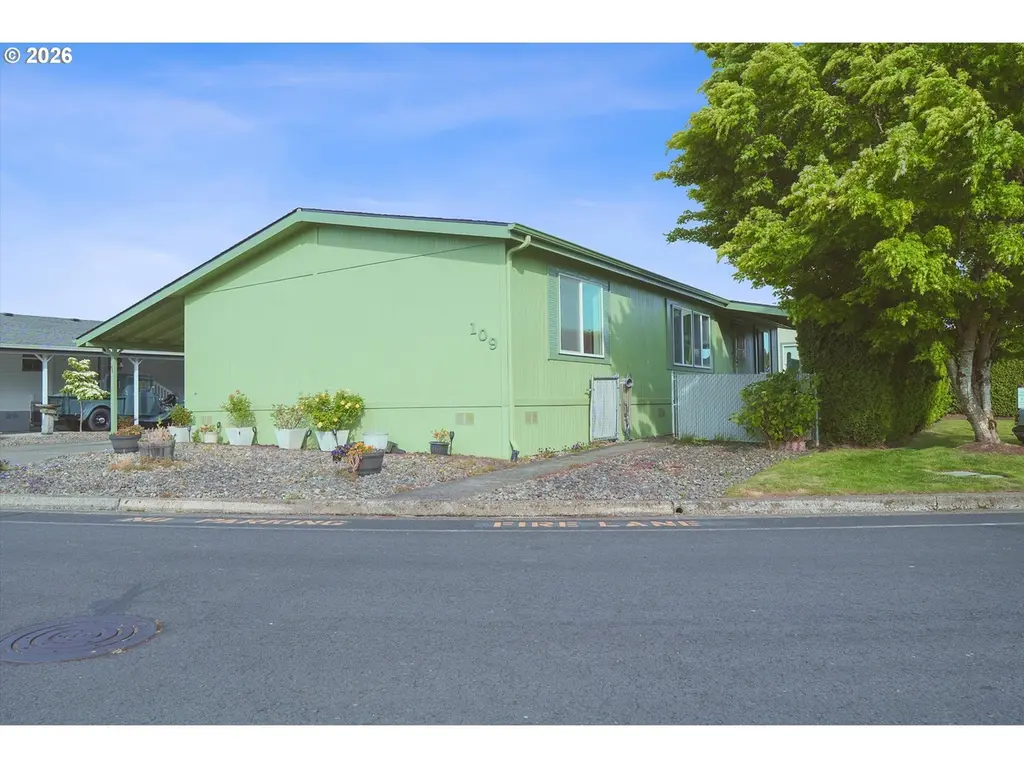
109 Blue Heron Dr · Longview, WA
Flood risk 1/10 · Minimal
- FEMA flood zone
- X
- Chance of flooding over 30 yrs
- 0.0%
- Est. flood insurance / yr
- $507 – $1,088
Fire risk 3/10 · Minor
- Est. fire insurance / yr
- $604 – $1,122
Heat risk 3/10 · Minor
- Hot days now (above 89°F)
- 8 days/yr
- Hot days in 30 yrs
- 16 days/yr
Wind risk 1/10 · Minimal
- Chance of severe wind over 30 yrs
- —
Air-quality risk 7/10 · Major
- Unhealthy air days now
- 9 days/yr
- Unhealthy air days in 30 yrs
- 9 days/yr
Risk factors via First Street. Map © Google.
Why this score? — see what drove the D+ grade
The composite is a weighted blend of 9 inputs, each scored 0–100. Each bar is that input's sub-score; the figure is the points it added to the 100-point composite (weight × sub-score).
- Cash flow +20.2/30.0
- DSCR +6.4/10.0
- 1% rule +5.3/10.0
- Schools +4.0/10.0
- Livability +3.6/5.0
- Rent growth +3.1/5.0
- Condition / age +2.5/5.0
- ARV discount +0.0/15.0
- Appreciation +0.0/10.0
$169,900
🖨 Deal sheet (PDF) 📄 Offer letter ✓ Due diligence
Listing remarks
Welcome to one of the most desirable homesites in one of Longview’s most beautiful and highly regarded manufactured home communities. Tucked back in a quiet corner of the park, just three doors down from the community green space, this spacious 3 bedroom, 2 bathroom home offers the rare combination of size, privacy, updates, parking, storage, and outdoor space. This is one of the biggest homes in the community, and sits on one of the largest lots in the park, giving you room to spread out both inside and out. The fully fenced yard provides excellent usable space, with room for your pets, gardening, outdoor entertaining, or simply enjoying a little extra breathing room. The extra long
Key facts
- Extra long driveway
- Large island
- Bonus storage shed
Tags
Property features AI
Finance
- Other: Property type: Manufactured home in park; Parcel number 8100109
- Financial info: Lot rent $685 monthly
- HOA & community: Located in Heron Pointe (community park); Lot rent: monthly
Exterior
- Parking: Carport; Driveway; Extra-deep, oversized 2-car garage/carport
- Utilities: Public water; Public sewer; Electric service
- Home design: Manufactured home in a park (residential, resale); Single-story (main level living); No view
- Construction: Built in 1998; Composition roof; Tax-record building area 1,404
- Exterior features: T-111 siding
Interior
- Kitchen: Kitchen on main level
- Bedrooms: Primary bedroom (main level); 2nd bedroom (main level); 3rd bedroom (main level)
- Bathrooms: 2 full bathrooms
- Heating & cooling: Forced air heating; Central air conditioning; Heat pump
- Interior features: Dining room; Family room; Living room; Great room
- Laundry & utility: Electric hot water
Neighborhood map
What this means for you Summary
Snapshot
- This is a 3-bed/2.0-bath manufactured listed at $170k.
Deal economics
- At list price, monthly cash flow is $215 ($3k/yr) — positive.
- The deal already cash-flows at list — no discount required.
- Meets the 1% rule at list price ($2k rent vs $170k).
- Recommended offer: $165k (3.0% below list) — sets the bar for market timing.
- Cap rate 7.8% vs local median 3.0% in Longview — top-decile yield for the area; either an underpriced asset or a hidden risk that comps aren't pricing in. Stress-test before assuming the spread holds.
Location & tenants
- Location reads 71/100 on livability (#228 in WA) — a middle-class / working-renter tenant base. Strengths: housing A+, health & safety A+, cost of living A-; Watch: crime C-, employment D+, commute F.
- Longview School District (urban): math 40% / reading 51% proficiency, ranked #185 of 291 in WA (top 64%) — families likely to look elsewhere, expect single-tenant / working-renter base with shorter leases.
- Zoned schools: Mint Valley Elementary (416 students, 79% FRL); Mt. Solo Middle School (408 students, 57% FRL).
- Market conditions: Rents rising (+2.6%/yr); 356 active listings in the ZIP; 3 comparable units currently listed for rent nearby; rentals at typical pace (median 17d on market — plan ~3-4 weeks tenant-placement turnaround); 348 units permitted in Cowlitz County in 2024 (40 in 5+ unit buildings).
- This rent runs 32% of the median local income ($66k/yr) — at the standard rent-burdened threshold; future hikes will face affordability resistance.
Forward outlook
- Local home prices are declining (-3.0%/yr); year-one equity from $1k of loan paydown is wiped out by about $5k of value loss. Plan a longer hold.
- Cowlitz County population projected to shrink 8% by 2050 — rents likely to lag national; underwrite the cash flow, not the appreciation.
Negotiation context
- It's been on market 31 days — a 3% lower offer ($165k) is reasonable based on typical stale-listing flexibility.
- 2 sale attempts since 4y ago; this cycle's ask has dropped $30k (15%) from the opening price — seller is motivated, your offer sets the floor, not the list.
Questions for the listing agent
- It's been on market 31 days. Have you received any prior offers? Is the seller open to a 3% concession, seller financing, or rate buy-down credit?
- Is there a deadline driving the sale (1031 exchange, divorce, estate, relocation)? That informs how much negotiation room exists.
- The area grade is low — what's the realistic commute time and amenity access for the typical tenant pool here? Any planned neighborhood developments (good or bad) we should know about?
- What's the average days-on-market for RENTAL listings here right now (not sales)? A rising rental-DOM trend means longer vacancies and softer asking-rent achievability than the comps imply.
- What's the recent tenant-quality profile in this submarket — average credit score on applications, eviction rate, late-payment / NSF rate, and stable-employment percentage? A property-management company in the area should have these aggregated.
- How much new for-sale + rental construction is in the pipeline within 1–3 miles? Heavy new supply typically softens prices + rents 12–24 months out; constrained supply supports both.
Investment metrics
- 1% rule
- 1.03% ✓
- Cap rate
- 7.81%
- Cash-on-cash
- 5.42%
- DSCR
- 1.24
- GRM
- 8.1
CMA / ARV
- ARV (on-the-fly)
- $143,208
- Comps found
- 12
Show comp detail 12 sales within ~0.75 mi
| Address | Dist | Beds/Ba | Sqft | Sold | Price | $/sf | Match |
|---|---|---|---|---|---|---|---|
| 608 Egret Ln | 0.11mi | 3/2.0 | 1,296 (-8%) | 1mo | $150,000 | $116 | 81 |
| 505 Mallard Ln | 0.13mi | 3/2.0 | 1,512 (+8%) | 1mo | $154,000 | $102 | 80 |
| 52 Heritage Blvd | 0.19mi | 3/2.0 | 1,404 (0%) | 13mo | $134,900 | $96 | 80 |
| 703 Pintail Ln | 0.06mi | 3/2.0 | 1,512 (+8%) | 7mo | $145,000 | $96 | 79 |
| 60 Heritage Blvd | 0.15mi | 3/2.0 | 1,512 (+8%) | 3mo | $144,250 | $95 | 78 |
| 78 Blue Heron Dr | 0.08mi | 3/2.0 | 1,296 (-8%) | 9mo | $162,000 | $125 | 76 |
| 96 Blue Heron Dr | 0.06mi | 3/2.0 | 1,566 (+12%) | 3mo | $164,900 | $105 | 76 |
| 83 Blue Heron Dr | 0.05mi | 3/2.0 | 1,296 (-8%) | 16mo | $165,000 | $127 | 72 |
| 125 Arlington Pl | 0.27mi | 3/2.0 | 1,458 (+4%) | 14mo | $132,000 | $91 | 69 |
| 47 Heritage Blvd | 0.22mi | 3/2.0 | 1,296 (-8%) | 19mo | $169,900 | $131 | 61 |
| 38 Heritage Blvd | 0.26mi | 3/2.0 | 1,296 (-8%) | 21mo | $125,000 | $96 | 58 |
| 5600 Mt. Solo #162 | 0.64mi | 3/2.0 | 1,536 (+9%) | 5mo | $59,000 | $38 | 51 |
Match score weights: distance 35% · size 25% · config 20% · recency 20%. Top-matched comps best support the ARV.
Projected returns pro-forma
-3.0% appreciation · 2.59% rent growth · sell at horizon
- IRR
- -8.3%
- Equity multiple
- 0.69×
- Total profit
- $-14,544
- Equity at exit
- $25,333
- IRR
- 0.6%
- Equity multiple
- 1.04×
- Total profit
- $2,122
- Equity at exit
- $14,690
Cash invested: $47,572 (down + closing). Projections, not guarantees.
Landlord ↔ Tenant lean methodology
- Overall (STATE)
- 28 Tenant-Leaning
- State Washington
- 28 Tenant-Leaning · D+8
- County
- — inherits STATE
- City
- — inherits STATE
ZIP-level market 98632
- Rents YoY
- 2.6%
- Active inventory
- 356
- Price-to-rent
- 8.1×
Monthly cashflow live
- Estimated rent
- $1,758 medium interval (Pro) →
- Mortgage (P&I)
- −$891
- Tax est. 1.5%
- −$212 /mo · $2,548/yr
- Insurance
- −$71
- HOA
- −$0
- Vacancy / Maint / Mgmt
- −$369
- Net cashflow
- $215
Break-even live
Sensitivity live
| Price | -10% $332 | -5% $274 | +0% $215 | +5% $156 | +10% $97 |
|---|---|---|---|---|---|
| Rent | -10% $76 | -5% $145 | +0% $215 | +5% $284 | +10% $354 |
| Rate | -1.0pp $300 | -0.5pp $258 | base $215 | +0.5pp $171 | +1.0pp $126 |
UW: 25.0% down · 7.5% · 30yr · 1.5% tax · 5.0% vac · 8.0% maint · 8.0% mgmt
Financing live
Cash to close
- Down payment
- $42,475
- Closing costs
- $5,097
- Reserves months
- —
- Total cash needed
- —
Loan-product check · same deal, 3 products live
Conventional
25% down · 7.5% · 30yr
- Down + closing
- —
- Monthly P&I
- —
- Monthly cashflow
- —
- DSCR
- —
- Eligible?
- —
Personal DTI + credit; lowest rate.
DSCR
20% down · 8.5% · 30yr
- Down + closing
- —
- Monthly P&I
- —
- Monthly cashflow
- —
- DSCR
- —
- Eligible?
- —
No personal income docs; deal must DSCR.
Hard money
10% down · 12.0% · 12mo
- Down + closing
- —
- Monthly P&I
- —
- Monthly cashflow
- —
- DSCR
- —
- Eligible?
- —
Short-term bridge; refi at stabilization.
Rent comps 3 comps
| Address | Beds | Baths | Sqft | Rent | $/sqft | DOM | Units | Dist |
|---|---|---|---|---|---|---|---|---|
| 5607 Finch Dr Longview, WA | 2.0 | 1.0 | 925 | $1,550 | $1.68 | 22d | 1 | 0.64mi |
| 115 Charles St Longview, WA | 3.0 | 2.0 | 1704 | $2,200 | $1.29 | 17d | 1 | 1.16mi |
| 4714 Ocean Beach Hwy Longview, WA | 2.0 | 1.0 | 880 | $1,450 | $1.65 | 4d | 2 | 1.25mi |
Listing history 21 events
-
2026-06-19days on market $169,900 Active 31 DOM
-
2026-06-18pricedays on market $169,900 Active 30 DOM
-
2026-06-17days on market $179,900 Active 29 DOM
-
2026-06-16days on market $179,900 Active 28 DOM
-
2026-06-15days on market $179,900 Active 27 DOM
-
2026-06-14days on market $179,900 Active 25 DOM
-
2026-06-13days on market $179,900 Active 24 DOM
-
2026-06-10days on market $179,900 Active 22 DOM
-
2026-06-09days on market $179,900 Active 21 DOM
-
2026-06-08days on market $179,900 Active 20 DOM
-
2026-06-07days on market $179,900 Active 19 DOM
-
2026-06-05days on market $179,900 Active 16 DOM
-
2026-06-02days on market $179,900 Active 14 DOM
-
2026-06-01days on market $179,900 Active 13 DOM
-
2026-05-31days on market $179,900 Active 12 DOM
-
2026-05-30days on market $179,900 Active 11 DOM
-
2026-05-19$199,900 Active
-
2022-07-28soldstatus $151,000 Closed
-
2022-07-14status Pending
-
2022-07-07$155,000 Active
-
2002-02-19soldstatus $36,500
ⓘ Source: listings_history table (triggers on properties + properties_extension) + one-shot
backfill from property_details.listing_events for pre-trigger history.
Climate risk First Street
- Flood 1/10 Low FEMA zone X · 0% chance over 30 yrs
- Wildfire 3/10 Moderate
- Heat 3/10 Moderate 8 d/yr ≥89°F today · 16 d/yr by 30 yrs out
- Wind 1/10 Low
- Air quality 7/10 Severe 9 unhealthy d/yr today · 9 by 30 yrs out
Nearby sold comps map
Loading sold comps map…
Walkable amenities ~0.75 mi
Loading nearby amenities…
Taxation est. · year 1
- Rental income
- $21,098
- − Mortgage interest
- −$9,517
- − Property taxes
- −$2,548
- − Insurance
- −$850
- − Repairs & maintenance
- −$1,688
- − Management
- −$1,688
- − Depreciation
- −$4,943
- Taxable loss
- −$135
- Est. tax savings @ 24.0%
- +$32
- After-tax cash flow
- $2,610/yr
For passive investors: Depreciation is non-cash, so a rental often shows a tax loss while cash-flowing — sheltering income. Rental losses are passive: they offset passive income freely, and up to $25,000/yr can offset ordinary (W-2) income if you actively participate and your MAGI is under $100k (phasing out to $0 by $150k); unused losses carry forward. On sale, claimed depreciation is recaptured at up to 25%, and gains may owe capital-gains tax (a 1031 exchange can defer both). Figures are a year-1 estimate at your 24.0% rate — not tax advice; consult a CPA.
Schools (NCES district)
- District
- Longview School District
- NCES district ID
- 5304470
- Math proficiency
- 40% ▲ 1.00%
- Reading proficiency
- 51% ▲ 3.00%
- Median HH income
- $41,324
- Composite
- 40.41/100
- National rank
- #7732
- State rank
- #185 of 291 in WA
Livability — Longview
- Score
- 71/100
- State rank
- #228
- US rank
- #6972
Category grades
Schools grade is shown separately in the Schools card above.
Census & demographics
- Census place
- Longview, WA
- County
- Cowlitz County · 77,527 people
- City population
- 50,635
- Metro
- Longview, WA
- Population (ZIP)
- 50,635
- Household income
- $66,305
- Rent vs Own
- Severe rent burden
- 2224.0
Population outlook (Cowlitz County) Hauer SSP2
- Today (2025)
- 104,780 people
- By 2030
- 103,980 · -0.8%
- By 2040
- 100,769 · -3.8%
- By 2050
- 96,685 · -7.7%
- By 2075
- 86,454 · -17.5%
- By 2100
- 74,052 · -29.3%
Race, ethnicity, and origin ACS 2023
- Neighborhood character
- Predominantly White (78%)
- Race & ethnicity
- White 78% Hispanic / Latino 12% Two or more races 11% Asian 2% Native American 1%
- Hispanic origin (detail)
- Mexican 10%
- Common ancestry
- Portuguese 5% Lithuanian 3% Italian 3%
- Foreign-born
- 4% · Canada, Vietnam
- Languages at home
- 91% English-only · Spanish 7% Other Asian/Pacific 1%
Political lean MEDSL · Cowlitz
- 2024 margin
- R (+19.9) · D 38.7% · R 58.6% · Other 2.7%
- 2008→2024 swing
- -31.1pp toward R · 2008: 11.2pp · 2024: -19.9pp
- All cycles
- 2024: R+19.9 2020: R+17.4 2016: R+13.7 2012: D+4.4 2008: D+11.2
Not yet ingested
- Civics
- —
Market trends
- HPI YoY
- ▼ -479.09%
- Current HPI
- 230.8501
- Rent YoY
- ▲ 2.59%
- Metro
- Longview, WA
- State GDP YoY
- ▲ 4.65%
- F500 in state
- 22
Industry mix (Fortune 500 HQ in WA)
| Industry | F500 HQs | Revenue |
|---|---|---|
| Retail | 2 | $269B |
|
||
| Technology / Retail | 1 | $638B |
|
||
| Technology | 1 | $245B |
|
||
| Telecommunications | 1 | $38B |
|
||
| Food / Beverage | 1 | $36B |
|
||
| Automotive / Trucks | 1 | $34B |
|
||
Price history
+447.7% since first listed5 events — show timeline
- 2026-05-19 Listed $199,900 RMLS
- 2022-07-28 Sold (MLS) $151,000 NWMLS as Distributed by MLS Grid
- 2022-07-14 Pending — NWMLS as Distributed by MLS Grid
- 2022-07-07 Listed $155,000 NWMLS as Distributed by MLS Grid
- 2002-02-19 Sold (Public Records) $36,500 Public Records
Property tax history
-1.7%/yrLatest (2026): $296 · -75.3% YoY. Source: county tax records.
Cash-flow waterfall
monthlySold comps — $/sqft
last 12 mo · ≤1 miLoading sold comps…