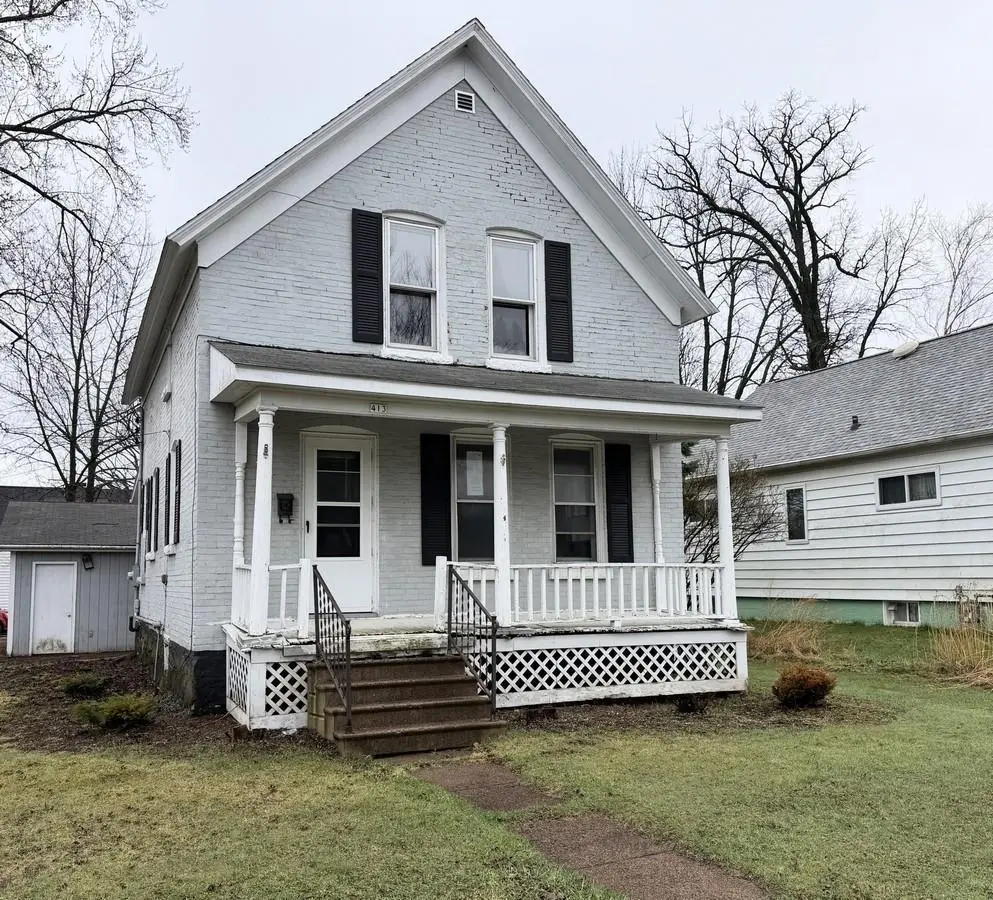
413 N Peach Ave · Marshfield, WI
Flood risk 1/10 · Minimal
- FEMA flood zone
- X (unshaded)
- Chance of flooding over 30 yrs
- 0.0%
- Est. flood insurance / yr
- $473 – $860
Fire risk 1/10 · Minimal
- Est. fire insurance / yr
- $636 – $1,182
Heat risk 1/10 · Minimal
- Hot days now (above 97°F)
- 7 days/yr
- Hot days in 30 yrs
- 13 days/yr
Wind risk 2/10 · Minimal
- Chance of severe wind over 30 yrs
- —
Air-quality risk 1/10 · Minimal
- Unhealthy air days now
- 0 days/yr
- Unhealthy air days in 30 yrs
- 0 days/yr
Risk factors via First Street. Map © Google.
Why this score? — see what drove the D grade
The composite is a weighted blend of 9 inputs, each scored 0–100. Each bar is that input's sub-score; the figure is the points it added to the 100-point composite (weight × sub-score).
- Cash flow +13.1/30.0
- ARV discount +7.5/15.0
- 1% rule +4.4/10.0
- Schools +4.0/10.0
- Livability +4.0/5.0
- DSCR +3.9/10.0
- Rent growth +2.5/5.0
- Condition / age +2.5/5.0
- Appreciation +0.0/10.0
$112,000
🖨 Deal sheet 📄 Offer letter ✓ Due diligence
Listing remarks
This property is in a great location with a spacious yard. It features 3 bedrooms, 2 bathrooms, and a large 2-car detached garage. The main level includes a full bath, an eat-in kitchen, a spacious living room, and a laundry room. The upper level contains all 3 bedrooms and a second full bathroom.
Key facts
- Spacious yard
- Laundry room
- Eat-in kitchen
Tags
Property features AI
Exterior
- Parking: Detached 2-car garage
- Utilities: Municipal water; Municipal sewer; Power and heating fuel: LP gas and oil
- Home design: 1.5-story single-family home; Residential zoning; Lot size about 0.19 acre
- Construction: Shingle roof; Approximate finished above-grade area in the 1001–1250 sq ft range; Below-grade unfinished area (basement) about 729 sq ft
- Exterior features: Patio; Porch; Brick exterior
Interior
- Kitchen: Kitchen on main level about 13 x 11; Refrigerator; Range/Oven
- Bedrooms: Master bedroom (upper level) about 13 x 10; Bedroom 2 (upper level) about 11 x 10; Bedroom 3 (upper level) about 10 x 10
- Flooring: Carpet
- Bathrooms: Two full bathrooms
- Heating & cooling: Forced air heating; No central cooling; Heated by LP gas and oil
- Interior features: Carpet flooring in living areas
- Laundry & utility: Main-level laundry room about 7 x 14; Full basement
Neighborhood map
What this means for you Summary
Snapshot
- This is a 3-bed/2.0-bath other listed at $112k.
Deal economics
- At list price, monthly cash flow is $-4 ($-43/yr) — negative.
- To cash-flow at today's rent, offer at most $111k (0.6% below list).
- To meet the 1% rule (rent ≥ 1% of price), the offer needs to be $105k (6.5% below list).
- Recommended offer: $105k (6.5% below list) — sets the bar for 1% rule.
- Cap rate 6.3% vs local median 2.9% in Marshfield — top-decile yield for the area; either an underpriced asset or a hidden risk that comps aren't pricing in. Stress-test before assuming the spread holds.
Location & tenants
- Location reads 80/100 on livability (#62 in WI, #1,688 nationally) — a professional / high-income tenant draw. Strengths: cost of living A+, housing A+, health & safety A+; Watch: commute F.
- Marshfield Unified School District (town): math 44% / reading 50% proficiency, ranked #79 of 342 in WI (top 23%) — families likely to look elsewhere, expect single-tenant / working-renter base with shorter leases.
- Zoned schools: Marshfield High (math 38% / reading 52%, grade D-, #58 of 483 statewide, top 12%, 1,242 students, 33% FRL).
- Market conditions: 86 active listings in the ZIP; 4 comparable units currently listed for rent nearby; rentals lingering (median 44d on market — plan ~5-8 weeks vacancy on turnover, expect pricing pressure); 100% of comp listings sitting > 30 days — soft ceiling on asking rent; 122 units permitted in Wood County in 2024 (0 in 5+ unit buildings).
Forward outlook
- Local home prices are declining (-3.0%/yr); year-one equity from $774 of loan paydown is wiped out by about $3k of value loss. Plan a longer hold.
- Wood County population projected at -22% by 2050 — secular population decline; favor cash flow + early exit over multi-decade hold.
Negotiation context
- It's been on market 45 days — a 3% lower offer ($109k) is reasonable based on typical stale-listing flexibility.
Risks & watch-outs
- Watch-outs: built in 1908 — expect roof / HVAC / electrical / plumbing capex.
Questions for the listing agent
- What do current leases actually rent for vs. the listed asking? Can we see a recent rent roll and the last 12 months of T-12 income?
- It's been on market 45 days. Have you received any prior offers? Is the seller open to a 6% concession, seller financing, or rate buy-down credit?
- Built in 1908 — when were the roof, HVAC, electrical panel, plumbing, and water heater last replaced?
- Is there a deadline driving the sale (1031 exchange, divorce, estate, relocation)? That informs how much negotiation room exists.
- Schools are B-rated — typically a magnet for longer-tenancy family renters. What's the average tenant stay here, and is there a school-zone premium baked into asking?
- The area grade is low — what's the realistic commute time and amenity access for the typical tenant pool here? Any planned neighborhood developments (good or bad) we should know about?
- What's the average days-on-market for RENTAL listings here right now (not sales)? A rising rental-DOM trend means longer vacancies and softer asking-rent achievability than the comps imply.
- What's the recent tenant-quality profile in this submarket — average credit score on applications, eviction rate, late-payment / NSF rate, and stable-employment percentage? A property-management company in the area should have these aggregated.
- How much new for-sale + rental construction is in the pipeline within 1–3 miles? Heavy new supply typically softens prices + rents 12–24 months out; constrained supply supports both.
Investment metrics
- 1% rule
- 0.94% ✗
- Cap rate
- 6.25%
- Cash-on-cash
- -0.14%
- DSCR
- 0.99
- GRM
- 8.9
CMA / ARV
No comps found within radius.
Projected returns pro-forma
-3.0% appreciation · 3.0% rent growth · sell at horizon
- IRR
- -16.5%
- Equity multiple
- 0.42×
- Total profit
- $-18,326
- Equity at exit
- $16,700
- IRR
- -8.1%
- Equity multiple
- 0.49×
- Total profit
- $-16,044
- Equity at exit
- $9,684
Cash invested: $31,360 (down + closing). Projections, not guarantees.
Landlord ↔ Tenant lean methodology
- Overall (STATE)
- 73 Landlord-Friendly
- State Wisconsin
- 73 Landlord-Friendly · R+2
- County
- — inherits STATE
- City
- — inherits STATE
ZIP-level market 54449
- Active inventory
- 86
- Price-to-rent
- 8.9×
Monthly cashflow live
- Estimated rent
- $1,047 medium interval (Pro) →
- Mortgage (P&I)
- −$587
- Tax from tax record
- −$197 /mo · $2,364/yr
- Insurance
- −$47
- HOA
- −$0
- Vacancy / Maint / Mgmt
- −$220
- Net cashflow
- $-4
Break-even live
UW: 25.0% down · 7.5% · 30yr · 1.5% tax · 5.0% vac · 8.0% maint · 8.0% mgmt
Financing live
Cash to close
- Down payment
- $28,000
- Closing costs
- $3,360
- Reserves months
- —
- Total cash needed
- —
Loan-product check · same deal, 3 products live
Conventional
25% down · 7.5% · 30yr
- Down + closing
- —
- Monthly P&I
- —
- Monthly cashflow
- —
- DSCR
- —
- Eligible?
- —
Personal DTI + credit; lowest rate.
DSCR
20% down · 8.5% · 30yr
- Down + closing
- —
- Monthly P&I
- —
- Monthly cashflow
- —
- DSCR
- —
- Eligible?
- —
No personal income docs; deal must DSCR.
Hard money
10% down · 12.0% · 12mo
- Down + closing
- —
- Monthly P&I
- —
- Monthly cashflow
- —
- DSCR
- —
- Eligible?
- —
Short-term bridge; refi at stabilization.
Rent comps 4 comps
| Address | Beds | Baths | Sqft | Rent | $/sqft | DOM | Units | Dist |
|---|---|---|---|---|---|---|---|---|
| 2411 Monique Ln Unit 1004-4 Marshfield, WI | 2.0 | 1.0 | 1100 | $1,250 | $1.14 | 43d | 1 | 1.01mi |
| 1010 Sawyer Dr Unit 107 Marshfield, WI | 2.0 | 1.0 | 800 | $895 | $1.12 | 43d | 1 | 1.48mi |
| 1010 Sawyer Dr Unit 102 Marshfield, WI | 2.0 | 1.0 | 800 | $995 | $1.24 | 43d | 1 | 1.48mi |
| 1010 Sawyer Dr Unit 205 Marshfield, WI | 2.0 | 1.0 | 800 | $895 | $1.12 | 44d | 1 | 1.48mi |
Listing history 16 events
-
2026-06-18days on market $112,000 Active 45 DOM
-
2026-06-17days on market $112,000 Active 44 DOM
-
2026-06-16days on market $112,000 Active 43 DOM
-
2026-06-15days on market $112,000 Active 42 DOM
-
2026-06-15days on market $112,000 Active 41 DOM
-
2026-06-13days on market $112,000 Active 40 DOM
-
2026-06-12pricedays on market $112,000 Active 39 DOM
-
2026-06-09days on market $140,000 Active 36 DOM
-
2026-06-08days on market $140,000 Active 35 DOM
-
2026-06-08days on market $140,000 Active 34 DOM
-
2026-06-07days on market $140,000 Active 33 DOM
-
2026-06-03days on market $140,000 Active 30 DOM
-
2026-06-02days on market $140,000 Active 29 DOM
-
2026-06-01days on market $140,000 Active 28 DOM
-
2026-05-31days on market $140,000 Active 27 DOM
-
2026-05-04$140,000 Active
ⓘ Source: listings_history table (triggers on properties + properties_extension) + one-shot
backfill from property_details.listing_events for pre-trigger history.
Tax reassessment forecast WI · Partial reset (capped growth)
- Current annual tax
- $2,364 · $197/mo
- Projected year-2 tax
- $2,364 · $197/mo
- Expected delta
- $0/yr ($0/mo · 0.0%)
ⓘ Screening estimate from a state-policy table — verify with the county assessor before closing.
Climate risk First Street
- Flood 1/10 Low FEMA zone X (unshaded) · 0% chance over 30 yrs
- Wildfire 1/10 Low
- Heat 1/10 Low 7 d/yr ≥97°F today · 13 d/yr by 30 yrs out
- Wind 2/10 Low
- Air quality 1/10 Low 0 unhealthy d/yr today · 0 by 30 yrs out
Nearby sold comps map
Loading sold comps map…
Walkable amenities ~0.75 mi
Loading nearby amenities…
Taxation est. · year 1
- Rental income
- $12,569
- − Mortgage interest
- −$6,274
- − Property taxes
- −$2,364
- − Insurance
- −$560
- − Repairs & maintenance
- −$1,005
- − Management
- −$1,005
- − Depreciation
- −$3,258
- Taxable loss
- −$1,898
- Est. tax savings @ 24.0%
- +$456
- After-tax cash flow
- $413/yr
For passive investors: Depreciation is non-cash, so a rental often shows a tax loss while cash-flowing — sheltering income. Rental losses are passive: they offset passive income freely, and up to $25,000/yr can offset ordinary (W-2) income if you actively participate and your MAGI is under $100k (phasing out to $0 by $150k); unused losses carry forward. On sale, claimed depreciation is recaptured at up to 25%, and gains may owe capital-gains tax (a 1031 exchange can defer both). Figures are a year-1 estimate at your 24.0% rate — not tax advice; consult a CPA.
Schools (NCES district)
- District
- Marshfield Unified School District
- NCES district ID
- 5508820
- Math proficiency
- 44% ▼ -4.00%
- Reading proficiency
- 50% ▼ -2.00%
- Median HH income
- $50,784
- Composite
- 40.35/100
- National rank
- #3743
- State rank
- #79 of 342 in WI
Livability — Marshfield
- Score
- 80/100
- State rank
- #62
- US rank
- #1688
Category grades
Schools grade is shown separately in the Schools card above.
Census & demographics
- Census place
- Marshfield, WI
- Population (ZIP)
- 26,368
Population outlook (Wood County) Hauer SSP2
- Today (2025)
- 69,530 people
- By 2030
- 66,919 · -3.8%
- By 2040
- 60,735 · -12.6%
- By 2050
- 54,077 · -22.2%
- By 2075
- 41,820 · -39.9%
- By 2100
- 31,863 · -54.2%
Race, ethnicity, and origin ACS 2023
- Neighborhood character
- Predominantly White (92%)
- Race & ethnicity
- White 92% Two or more races 4% Hispanic / Latino 3% Asian 2%
- Common ancestry
- Romanian 8% Portuguese 6% Lithuanian 3%
- Foreign-born
- 2% · Canada
- Languages at home
- 96% English-only · Spanish 1% German/W. Germanic 1% Other Asian/Pacific 1%
Political lean MEDSL · Wood
- 2024 margin
- R (+19.9) · D 39.4% · R 59.3% · Other 1.3%
- 2008→2024 swing
- -33.1pp toward R · 2008: 13.1pp · 2024: -19.9pp
- All cycles
- 2024: R+19.9 2020: R+19.2 2016: R+19.3 2012: R+2.9 2008: D+13.1
Not yet ingested
- Civics
- —
Market trends
- HPI YoY
- ▼ -110.73%
- Current HPI
- 171.5799
- Rent YoY
- —
- Metro
- —
- State GDP YoY
- ▲ 2.10%
- F500 in state
- 20
Industry mix (Fortune 500 HQ in WI)
| Industry | F500 HQs | Revenue |
|---|---|---|
| Industrial Machinery | 4 | $23B |
|
||
| Industrial Technology | 2 | $36B |
|
||
| Insurance | 1 | $36B |
|
||
| Professional Services | 1 | $19B |
|
||
| Utilities | 1 | $9B |
|
||
| Consumer Goods | 1 | $3B |
|
||
Price history
1 event — show timeline
- 2026-05-04 Listed $140,000 CWMLS
Property tax history
+2.2%/yrLatest (2025): $2,364 · -14.5% YoY. Source: county tax records.
Cash-flow waterfall
monthlySold comps — $/sqft
last 12 mo · ≤1 miLoading sold comps…