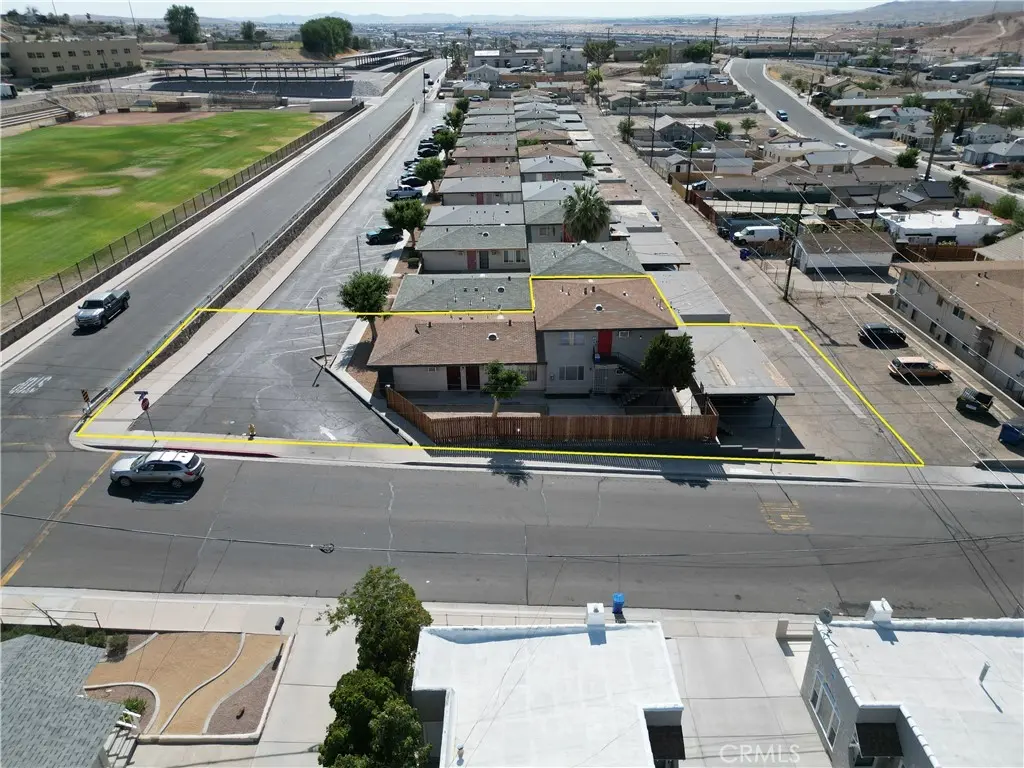
 Fourplex
101 W Buena Vista St · Barstow, CA
Flood risk 1/10 · Minimal
- FEMA flood zone
- X (unshaded)
- Chance of flooding over 30 yrs
- 0.0%
- Est. flood insurance / yr
- $507 – $1,088
Fire risk 3/10 · Minor
- Est. fire insurance / yr
- $659 – $1,223
Heat risk 8/10 · Major
- Hot days now (above 102°F)
- 6 days/yr
- Hot days in 30 yrs
- 16 days/yr
Wind risk 1/10 · Minimal
- Chance of severe wind over 30 yrs
- —
Air-quality risk 6/10 · Moderate
- Unhealthy air days now
- 11 days/yr
- Unhealthy air days in 30 yrs
- 15 days/yr
Risk factors via First Street. Map © Google.
Why this score? — see what drove the D- grade
The composite is a weighted blend of 9 inputs, each scored 0–100. Each bar is that input's sub-score; the figure is the points it added to the 100-point composite (weight × sub-score).
- Cash flow +18.0/30.0
- DSCR +5.6/10.0
- 1% rule +3.7/10.0
- Livability +3.2/5.0
- Rent growth +3.1/5.0
- Condition / age +2.5/5.0
- Schools +1.4/10.0
- ARV discount +0.0/15.0
- Appreciation +0.0/10.0
$560,000
🖨 Deal sheet 📄 Offer letter ✓ Due diligence
Multi-family units
County records classify this as Multi-Family (2-4 Unit). Listing-text estimate: 4 units. confirmed
Listing remarks MLS
A 4 unit apartment complex located in the city of Barstow, California. The apartment building was built in 1965 and the unit mix consists of (2) 2bed/1bath and (2) 1bed/1bath for a total of 4 units. In addition the property is conveniently located within a five minute drive of the Barstow Outlets which consist of stores such as Columbia Factory Store, Levi's Outlet Store, Skechers, Lacoste Clothing, Claire's, Coach, Nike Factory, Adidas, Bath & Body, Kate Spade, Guess Factory, Old Navy, Pollo Loco, In N Out Burger, Chili's Grill and Bar, Starbucks and much more!
Key facts
- Five minute drive
- Barstow outlets
- 8,979 sq ft lot
Tags
Neighborhood map
What this means for you Summary
Snapshot
- This is a 2×2bd/1ba + 2×1bd/1ba units multifamily listed at $560k.
Deal economics
- At list price, monthly cash flow is $480 ($6k/yr) — positive. Per door: $120/mo.
- The deal already cash-flows at list — no discount required.
- To meet the 1% rule (rent ≥ 1% of price), the offer needs to be $488k (12.9% below list).
- Recommended offer: $488k (12.9% below list) — sets the bar for 1% rule.
- Cap rate 7.3% vs local median 4.6% in Barstow — top-decile yield for the area; either an underpriced asset or a hidden risk that comps aren't pricing in. Stress-test before assuming the spread holds.
Location & tenants
- Location reads 63/100 on livability (#444 in CA) — a middle-class / working-renter tenant base. Strengths: commute A+, housing A+; Watch: amenities C-, health & safety C-, schools F.
- Barstow Unified (town): math 11% / reading 22% proficiency, ranked #482 of 517 in CA (top 93%) — low school quality limits family demand, transient renter base, plan for 1-2y turnover; 68% free/reduced lunch — lower-income household profile, screen leases tightly.
- Market conditions: Rents rising (+2.3%/yr); 343 active listings in the ZIP; 5,458 units permitted in San Bernardino County in 2024 (1,500 in 5+ unit buildings).
- At $4,878/mo this rent would consume 95% of the median local household income ($62k/yr) (locally 1305% of renters already pay >50% of income on rent) — very limited rent-growth headroom before tenants either downsize or default.
Forward outlook
- Local home prices are declining (-3.0%/yr); year-one equity from $4k of loan paydown is wiped out by about $17k of value loss. Plan a longer hold.
- San Bernardino County population projected at +15% by 2050 — modest demand growth; plan on rents tracking national, not racing it.
Negotiation context
- It's been on market 370 days — a 12% lower offer ($493k) is reasonable based on typical stale-listing flexibility.
- 4 sale attempts since 9y ago with the ask held roughly flat each time — persistent listings suggest the price (not the market) is what's stuck; bring a comps-based counter.
Risks & watch-outs
- Climate carrying-cost: extreme-heat days projected 6→16/yr by 2055 (HVAC capex compounding) — expect insurance premiums to compound above CPI over the hold.
Questions for the listing agent
- It's been on market 370 days. Have you received any prior offers? Is the seller open to a 13% concession, seller financing, or rate buy-down credit?
- Can we see the unit-by-unit rent roll, current vacancy, and any below-market leases? What's the average tenancy length?
- What capital expenditures (roof, boiler, parking lot, exteriors) have been made in the last 5 years, and what's planned in the next 2?
- Built in 1965 — when were the roof, HVAC, electrical panel, plumbing, and water heater last replaced?
- Why hasn't it sold? Are there any deal-killer items the seller is aware of (foundation, flood, title, zoning, code violations)?
- Is there a deadline driving the sale (1031 exchange, divorce, estate, relocation)? That informs how much negotiation room exists.
- Schools are F-rated, which usually means shorter tenancies and higher turnover. Who's the typical renter profile here, and what's been the actual vacancy rate?
- Crime grade is F in this area — have there been break-ins, vandalism, or insurance claims at this property in the last 3 years? What carrier currently insures it and at what premium?
- The area grade is low — what's the realistic commute time and amenity access for the typical tenant pool here? Any planned neighborhood developments (good or bad) we should know about?
- What's the average days-on-market for RENTAL listings here right now (not sales)? A rising rental-DOM trend means longer vacancies and softer asking-rent achievability than the comps imply.
- What's the recent tenant-quality profile in this submarket — average credit score on applications, eviction rate, late-payment / NSF rate, and stable-employment percentage? A property-management company in the area should have these aggregated.
- How much new apartment / multifamily construction is in the pipeline within 1–3 miles? Heavy new supply (>2% of stock underway) typically softens rents 12–24 months out; light construction supports rent growth.
Investment metrics
- 1% rule
- 0.87% ✗
- Cap rate
- 7.32%
- Cash-on-cash
- 3.67%
- DSCR
- 1.16
- GRM
- 9.6
CMA / ARV
- ARV (median comp)
- $429,689
- List price
- $560,000
- Delta
- 30.33%
- Verdict
- OVERPRICED
- Comps
- 19 within 1.0 mi
Projected returns pro-forma
-3.0% appreciation · 2.32% rent growth · sell at horizon
- IRR
- -11.3%
- Equity multiple
- 0.59×
- Total profit
- $-63,722
- Equity at exit
- $83,498
- IRR
- -3.0%
- Equity multiple
- 0.81×
- Total profit
- $-30,485
- Equity at exit
- $48,419
Cash invested: $156,800 (down + closing). Projections, not guarantees.
Landlord ↔ Tenant lean methodology
- Overall (STATE)
- 18 Strongly Tenant-Friendly
- State California
- 18 Strongly Tenant-Friendly · D+13
- County
- — inherits STATE
- City
- — inherits STATE
ZIP-level market 92311
- Home prices YoY
- -30.6%
- Rents YoY
- 2.3%
- Active inventory
- 343
- Price-to-rent
- 37.4×
Monthly cashflow live
- Estimated rent
- $4,878 high interval (Pro) →
- Mortgage (P&I)
- −$2,937
- Tax from tax record
- −$204 /mo · $2,444/yr
- Insurance
- −$233
- HOA
- −$0
- Vacancy / Maint / Mgmt
- −$1,024
- Net cashflow
- $480
Break-even live
4-unit breakdown (identical units grouped — click to expand)
| Units | Beds | Baths | Est. rent |
|---|---|---|---|
| 2× units | 2 | 1 | $2,492 |
| #1 | 2 | 1 | $1,246 |
| #2 | 2 | 1 | $1,246 |
| 2× units | 1 | 1 | $2,386 |
| #3 | 1 | 1 | $1,193 |
| #4 | 1 | 1 | $1,193 |
| Total (4 units) | $4,878 | ||
UW: 25.0% down · 7.5% · 30yr · 1.5% tax · 5.0% vac · 8.0% maint · 8.0% mgmt
Financing live
Cash to close
- Down payment
- $140,000
- Closing costs
- $16,800
- Reserves months
- —
- Total cash needed
- —
Loan-product check · same deal, 3 products live
Conventional
25% down · 7.5% · 30yr
- Down + closing
- —
- Monthly P&I
- —
- Monthly cashflow
- —
- DSCR
- —
- Eligible?
- —
Personal DTI + credit; lowest rate.
DSCR
20% down · 8.5% · 30yr
- Down + closing
- —
- Monthly P&I
- —
- Monthly cashflow
- —
- DSCR
- —
- Eligible?
- —
No personal income docs; deal must DSCR.
Hard money
10% down · 12.0% · 12mo
- Down + closing
- —
- Monthly P&I
- —
- Monthly cashflow
- —
- DSCR
- —
- Eligible?
- —
Short-term bridge; refi at stabilization.
Listing history 24 events
-
2026-06-18days on market $560,000 Active 370 DOM
-
2026-06-17days on market $560,000 Active 369 DOM
-
2026-06-16days on market $560,000 Active 368 DOM
-
2026-06-15days on market $560,000 Active 367 DOM
-
2026-06-13days on market $560,000 Active 365 DOM
-
2026-06-13days on market $560,000 Active 364 DOM
-
2026-06-09days on market $560,000 Active 361 DOM
-
2026-06-08days on market $560,000 Active 360 DOM
-
2026-06-07days on market $560,000 Active 359 DOM
-
2026-06-04days on market $560,000 Active 356 DOM
-
2026-06-03days on market $560,000 Active 355 DOM
-
2026-06-02days on market $560,000 Active 354 DOM
-
2026-06-01days on market $560,000 Active 353 DOM
-
2026-05-31days on market $560,000 Active 352 DOM
-
2025-06-13$560,000 Active 574-char remark
Show marketing remark (574 chars)
A 4 unit apartment complex located in the city of Barstow, California. The apartment building was built in 1965 and the unit mix consists of (2) 2bed/1bath and (2) 1bed/1bath for a total of 4 units. In addition the property is conveniently located within a five minute drive of the Barstow Outlets which consist of stores such as Columbia Factory Store, Levi's Outlet Store, Skechers, Lacoste Clothing, Claire's, Coach, Nike Factory, Adidas, Bath & Body, Kate Spade, Guess Factory, Old Navy, Pollo Loco, In N Out Burger, Chili's Grill and Bar, Starbucks and much more!
-
2024-03-30historical $1,075
-
2024-03-29$1,075
-
2017-09-08soldstatus $2,150,000 510-char remark
Show marketing remark (510 chars)
Coldwell Banker Commercial's Basen and Schendel is proud to present this investment opportunity of 48 units located in Barstow, California. This property is strategically located near the Barstow High School, the hospital and minutes away from the I-15 freeway. The property is priced competitive offering of a 7% Cap rate at list with the opportunity for a 15% cash on cash return in year 1. The units are stabilized with long term owners with approximately 40% of the units currently under rented providing s
-
2017-09-08soldstatus $2,150,000
Show marketing remark (510 chars)
Coldwell Banker Commercial's Basen and Schendel is proud to present this investment opportunity of 48 units located in Barstow, California. This property is strategically located near the Barstow High School, the hospital and minutes away from the I-15 freeway. The property is priced competitive offering of a 7% Cap rate at list with the opportunity for a 15% cash on cash return in year 1. The units are stabilized with long term owners with approximately 40% of the units currently under rented providing s
-
2017-05-25$2,350,000 510-char remark
Show marketing remark (510 chars)
Coldwell Banker Commercial's Basen and Schendel is proud to present this investment opportunity of 48 units located in Barstow, California. This property is strategically located near the Barstow High School, the hospital and minutes away from the I-15 freeway. The property is priced competitive offering of a 7% Cap rate at list with the opportunity for a 15% cash on cash return in year 1. The units are stabilized with long term owners with approximately 40% of the units currently under rented providing s
-
2017-05-25$2,350,000
Show marketing remark (510 chars)
Coldwell Banker Commercial's Basen and Schendel is proud to present this investment opportunity of 48 units located in Barstow, California. This property is strategically located near the Barstow High School, the hospital and minutes away from the I-15 freeway. The property is priced competitive offering of a 7% Cap rate at list with the opportunity for a 15% cash on cash return in year 1. The units are stabilized with long term owners with approximately 40% of the units currently under rented providing s
-
2005-05-24soldstatus $147,000
-
2000-12-29soldstatus $130,000
ⓘ Source: listings_history table (triggers on properties + properties_extension) + one-shot
backfill from property_details.listing_events for pre-trigger history.
Tax reassessment forecast CA · Resets to sale price
- Current annual tax
- $2,444 · $204/mo
- Projected year-2 tax
- $4,256 · $355/mo
- Expected delta
- +$1,812/yr (+$151/mo · 74.2%)
ⓘ Screening estimate from a state-policy table — verify with the county assessor before closing.
Climate risk First Street
- Flood 1/10 Low FEMA zone X (unshaded) · 0% chance over 30 yrs
- Wildfire 3/10 Moderate
- Heat 8/10 Severe 6 d/yr ≥102°F today · 16 d/yr by 30 yrs out
- Wind 1/10 Low
- Air quality 6/10 Major 11 unhealthy d/yr today · 15 by 30 yrs out
Nearby sold comps map
Loading sold comps map…
Walkable amenities ~0.75 mi
Loading nearby amenities…
Taxation est. · year 1
- Rental income
- $58,536
- − Mortgage interest
- −$31,369
- − Property taxes
- −$2,444
- − Insurance
- −$2,800
- − Repairs & maintenance
- −$4,683
- − Management
- −$4,683
- − Depreciation
- −$16,291
- Taxable loss
- −$3,733
- Est. tax savings @ 24.0%
- +$896
- After-tax cash flow
- $6,655/yr
For passive investors: Depreciation is non-cash, so a rental often shows a tax loss while cash-flowing — sheltering income. Rental losses are passive: they offset passive income freely, and up to $25,000/yr can offset ordinary (W-2) income if you actively participate and your MAGI is under $100k (phasing out to $0 by $150k); unused losses carry forward. On sale, claimed depreciation is recaptured at up to 25%, and gains may owe capital-gains tax (a 1031 exchange can defer both). Figures are a year-1 estimate at your 24.0% rate — not tax advice; consult a CPA.
Schools (NCES district)
- District
- Barstow Unified
- NCES district ID
- 0604020
- Math proficiency
- 11% ▼ -7.00%
- Reading proficiency
- 22% ▼ -7.00%
- Median HH income
- $44,505
- Composite
- 14.44/100
- National rank
- #9430
- State rank
- #482 of 517 in CA
Livability — Barstow
- Score
- 63/100
- State rank
- #444
- US rank
- #15099
Category grades
Schools grade is shown separately in the Schools card above.
Census & demographics
- Census place
- Barstow, CA
- County
- San Bernardino County · 2,030,291 people
- City population
- 33,954
- Metro
- Riverside-San Bernardino-Ontario, CA
- Population (ZIP)
- 33,954
- Household income
- $61,862
- Rent vs Own
- Severe rent burden
- 1305.0
Population outlook (San Bernardino County) Hauer SSP2
- Today (2025)
- 2,300,329 people
- By 2030
- 2,378,907 · +3.4%
- By 2040
- 2,523,137 · +9.7%
- By 2050
- 2,642,388 · +14.9%
- By 2075
- 2,880,769 · +25.2%
- By 2100
- 2,909,436 · +26.5%
Race, ethnicity, and origin ACS 2023
- Neighborhood character
- Diverse neighborhood (Simpson 0.68)
- Race & ethnicity
- Hispanic / Latino 46% White 29% Two or more races 22% Black 15% Native American 3% Asian 2% Pacific Islander 1%
- Hispanic origin (detail)
- Mexican 39% Puerto Rican 2%
- Common ancestry
- Portuguese 1% Lithuanian 1% Italian 1%
- Foreign-born
- 9% · Canada, South Korea
- Languages at home
- 77% English-only · Spanish 20% Tagalog/Filipino 1% Other Indo-European 1%
Political lean MEDSL · San Bernardino
- 2024 margin
- Toss-up / Even · D 47.5% · R 49.7% · Other 2.8%
- 2008→2024 swing
- -8.5pp toward R · 2008: 6.3pp · 2024: -2.1pp
- All cycles
- 2024: R+2.1 2020: D+10.7 2016: D+9.8 2012: D+5.4 2008: D+6.3
Not yet ingested
- Civics
- —
Market trends
- HPI YoY
- ▼ -139.26%
- Current HPI
- 316.4858
- Rent YoY
- ▲ 2.32%
- Metro
- Riverside-San Bernardino-Ontario, CA
- State GDP YoY
- ▲ 3.21%
- F500 in state
- 116
Industry mix (Fortune 500 HQ in CA)
| Industry | F500 HQs | Revenue |
|---|---|---|
| Technology | 27 | $1,492B |
|
||
| Financial Services | 3 | $174B |
|
||
| Retail | 3 | $44B |
|
||
| Insurance | 3 | $26B |
|
||
| Media / Entertainment | 2 | $115B |
|
||
| Pharmaceuticals / Biotech | 2 | $62B |
|
||
Price history
+330.8% since first listed10 events — show timeline
- 2025-06-13 Listed $560,000 CRMLS
- 2024-03-30 Rental Removed $1,075 APPFOLIO
- 2024-03-29 Listed for Rent $1,075 APPFOLIO
- 2017-09-08 Sold (Public Records) $2,150,000 Public Records
- 2017-09-08 Sold (MLS) $2,150,000 SDMLS
- 2017-09-08 Sold (MLS) $2,150,000 SDMLS
- 2017-05-25 Listed $2,350,000 SDMLS
- 2017-05-25 Listed $2,350,000 SDMLS
- 2005-05-24 Sold (Public Records) $147,000 Public Records
- 2000-12-29 Sold (Public Records) $130,000 Public Records
Property tax history
+2.1%/yrLatest (2025): $2,444 · +1.8% YoY. Source: county tax records.
Cash-flow waterfall
monthlySold comps — $/sqft
last 12 mo · ≤1 miLoading sold comps…