3418 West Dr Key W · Rowlett, TX
Flood risk 1/10 · Minimal
- FEMA flood zone
- X (unshaded)
- Chance of flooding over 30 yrs
- 0.0%
- Est. flood insurance / yr
- $507 – $1,088
Fire risk 1/10 · Minimal
- Est. fire insurance / yr
- $1,222 – $2,270
Heat risk 8/10 · Major
- Hot days now (above 110°F)
- 7 days/yr
- Hot days in 30 yrs
- 25 days/yr
Wind risk 6/10 · Moderate
- Chance of severe wind over 30 yrs
- 27.0%
Air-quality risk 2/10 · Minimal
- Unhealthy air days now
- 2 days/yr
- Unhealthy air days in 30 yrs
- 2 days/yr
Risk factors via First Street. Map © Google.
Why this score? — see what drove the D- grade
The composite is a weighted blend of 9 inputs, each scored 0–100. Each bar is that input's sub-score; the figure is the points it added to the 100-point composite (weight × sub-score).
- Cash flow +12.2/30.0
- ARV discount +7.5/15.0
- Livability +3.8/5.0
- DSCR +3.6/10.0
- 1% rule +3.5/10.0
- Schools +2.9/10.0
- Rent growth +2.2/5.0
- Condition / age +2.2/5.0
- Appreciation +1.6/10.0
$270,000
🖨 Deal sheet 📄 Offer letter ✓ Due diligence
Listing remarks
Single family house, 3 bd, 2 bth, 2 car garage. Includes 2 large living areas. House is in great shape, includes all appliances and everything works. It needs some repairs. Great opportunity for a do it yourself homebuyer who wants to put sweat equity in it. It needs new floors and some drywall work. Please contact for more information. La casa est & Atilde; & iexcl; en excelentes condiciones; incluye todos los electrodom & Atilde; & copy; sticos y todo funciona. Necesita algunas reparaciones. Necesita pisos nuevos y algo de paneles de yeso.
Key facts
- Built 1992
- Listed 23 days
Neighborhood map
What this means for you Summary
Snapshot
- This is a 3-bed/2.0-bath other listed at $270k. Condition is rated fair.
Deal economics
- At list price, monthly cash flow is $-54 ($-649/yr) — negative.
- To cash-flow at today's rent, offer at most $262k (2.9% below list).
- To meet the 1% rule (rent ≥ 1% of price), the offer needs to be $229k (15.1% below list).
- Recommended offer: $229k (15.1% below list) — sets the bar for 1% rule.
- Cap rate 6.1% vs local median 3.2% in Rowlett — top-decile yield for the area; either an underpriced asset or a hidden risk that comps aren't pricing in. Stress-test before assuming the spread holds.
Location & tenants
- Location reads 75/100 on livability (#147 in TX, #4,150 nationally) — a middle-class / working-renter tenant base. Strengths: employment A+, housing A+, crime A-; Watch: amenities F, commute F, health & safety D-.
- Garland ISD (suburban): math 27% / reading 37% proficiency, ranked #553 of 826 in TX (top 67%) — families likely to look elsewhere, expect single-tenant / working-renter base with shorter leases.
- Market conditions: Rents soft (-1.2%/yr); 295 active listings in the ZIP; 40 comparable units currently listed for rent nearby; rentals at typical pace (median 24d on market — plan ~3-4 weeks tenant-placement turnaround); 48% of comp listings sitting > 30 days — soft ceiling on asking rent; solid renter incomes; 12,577 units permitted in Dallas County in 2024 (6,829 in 5+ unit buildings).
Forward outlook
- Local home prices are declining (-3.0%/yr); year-one equity from $2k of loan paydown is wiped out by about $8k of value loss. Plan a longer hold.
- Dallas County population projected at +35% by 2050 — long-run rental-demand tailwind backs the buy-and-hold thesis.
Negotiation context
- It's been on market 23 days — a 2% lower offer ($266k) is reasonable based on typical stale-listing flexibility.
Risks & watch-outs
- Climate carrying-cost: major wind risk, 27% chance of damaging wind over 30y; extreme-heat days projected 7→25/yr by 2055 (HVAC capex compounding) — expect insurance premiums to compound above CPI over the hold.
Questions for the listing agent
- What do current leases actually rent for vs. the listed asking? Can we see a recent rent roll and the last 12 months of T-12 income?
- Have any recent inspections been done? Can we get a copy of the seller's disclosures and any deferred-maintenance estimates?
- Is there a deadline driving the sale (1031 exchange, divorce, estate, relocation)? That informs how much negotiation room exists.
- The area grade is low — what's the realistic commute time and amenity access for the typical tenant pool here? Any planned neighborhood developments (good or bad) we should know about?
- What's the average days-on-market for RENTAL listings here right now (not sales)? A rising rental-DOM trend means longer vacancies and softer asking-rent achievability than the comps imply.
- What's the recent tenant-quality profile in this submarket — average credit score on applications, eviction rate, late-payment / NSF rate, and stable-employment percentage? A property-management company in the area should have these aggregated.
- How much new for-sale + rental construction is in the pipeline within 1–3 miles? Heavy new supply typically softens prices + rents 12–24 months out; constrained supply supports both.
Investment metrics
- 1% rule
- 0.85% ✗
- Cap rate
- 6.05%
- Cash-on-cash
- -0.86%
- DSCR
- 0.96
- GRM
- 9.8
CMA / ARV
No comps found within radius.
Projected returns pro-forma
-3.0% appreciation · 0.0% rent growth · sell at horizon
- IRR
- -21.1%
- Equity multiple
- 0.29×
- Total profit
- $-53,882
- Equity at exit
- $40,258
- IRR
- -23.6%
- Equity multiple
- -0.02×
- Total profit
- $-77,188
- Equity at exit
- $23,345
Cash invested: $75,600 (down + closing). Projections, not guarantees.
Landlord ↔ Tenant lean methodology
- Overall (STATE)
- 87 Strongly Landlord-Friendly
- State Texas
- 87 Strongly Landlord-Friendly · R+5
- County
- — inherits STATE
- City
- — inherits STATE
ZIP-level market 75088
- Home prices YoY
- -2.0%
- Rents YoY
- -1.2%
- Active inventory
- 295
- Price-to-rent
- 9.8×
Monthly cashflow live
- Estimated rent
- $2,293 high interval (Pro) →
- Mortgage (P&I)
- −$1,416
- Tax est. 1.5%
- −$338 /mo · $4,050/yr
- Insurance
- −$112
- HOA
- −$0
- Vacancy / Maint / Mgmt
- −$482
- Net cashflow
- $-54
Break-even live
UW: 25.0% down · 7.5% · 30yr · 1.5% tax · 5.0% vac · 8.0% maint · 8.0% mgmt
Financing live
Cash to close
- Down payment
- $67,500
- Closing costs
- $8,100
- Reserves months
- —
- Total cash needed
- —
Loan-product check · same deal, 3 products live
Conventional
25% down · 7.5% · 30yr
- Down + closing
- —
- Monthly P&I
- —
- Monthly cashflow
- —
- DSCR
- —
- Eligible?
- —
Personal DTI + credit; lowest rate.
DSCR
20% down · 8.5% · 30yr
- Down + closing
- —
- Monthly P&I
- —
- Monthly cashflow
- —
- DSCR
- —
- Eligible?
- —
No personal income docs; deal must DSCR.
Hard money
10% down · 12.0% · 12mo
- Down + closing
- —
- Monthly P&I
- —
- Monthly cashflow
- —
- DSCR
- —
- Eligible?
- —
Short-term bridge; refi at stabilization.
Rent comps 40 comps
| Address | Beds | Baths | Sqft | Rent | $/sqft | DOM | Units | Dist |
|---|---|---|---|---|---|---|---|---|
| 3305 Bucknell Dr Rowlett, TX | 3.0 | 2.0 | 1596 | $2,500 | $1.57 | 43d | 1 | 0.15mi |
| 7617 Dockside Dr Rowlett, TX | 3.0 | 2.0 | 1968 | $2,300 | $1.17 | 43d | 1 | 0.20mi |
| 7921 Rice Dr Rowlett, TX | 3.0 | 2.0 | 1847 | $2,166 | $1.17 | 7d | 1 | 0.26mi |
| 7916 Rice Dr Rowlett, TX | 4.0 | 2.5 | 2052 | $2,245 | $1.09 | 5d | 1 | 0.29mi |
| 3621 Geoffrey Trl Rowlett, TX | 4.0 | 2.5 | 1926 | $2,750 | $1.43 | 43d | 1 | 0.35mi |
| 7605 Cornell Dr Rowlett, TX | 3.0 | 2.0 | 1339 | $1,850 | $1.38 | 43d | 1 | 0.39mi |
| 3205 Hillcrest Dr Rowlett, TX | 4.0 | 2.0 | 1776 | $2,299 | $1.29 | 2d | 1 | 0.40mi |
| 7601 Cornell Dr Rowlett, TX | 3.0 | 2.5 | 1801 | $2,400 | $1.33 | 43d | 1 | 0.40mi |
| 4113 Starboard Trl Rowlett, TX | 3.0 | 2.5 | 1974 | $2,290 | $1.16 | 43d | 1 | 0.43mi |
| 2510 Stanford St Unit A Rowlett, TX | 2.0 | 2.0 | 1100 | $1,475 | $1.34 | 43d | 1 | 0.59mi |
| 2509 Stanford St Unit A Rowlett, TX | 2.0 | 2.0 | 1834 | $1,750 | $0.95 | 22d | 1 | 0.61mi |
| 2305 Randi Rd Rowlett, TX | 3.0 | 2.0 | 1527 | $2,145 | $1.40 | 43d | 1 | 0.63mi |
| 7313 Seascape Dr Rowlett, TX | 3.0 | 2.0 | 1334 | $2,200 | $1.65 | 24d | 1 | 0.64mi |
| 4522 Horizon Dr Rowlett, TX | 4.0 | 2.0 | 1572 | $2,205 | $1.40 | 43d | 1 | 0.64mi |
| 7301 Seascape Dr Rowlett, TX | 4.0 | 2.0 | 1608 | $1,275 | $0.79 | 2d | 1 | 0.66mi |
| 2302 Dana Dr Rowlett, TX | 4.0 | 3.5 | 2223 | $2,900 | $1.30 | 7d | 1 | 0.68mi |
| 4702 Mariner Dr Rowlett, TX | 4.0 | 2.0 | 2094 | $2,500 | $1.19 | 43d | 1 | 0.70mi |
| 7623 Coronado Dr Rowlett, TX | 3.0 | 3.0 | 2030 | $2,795 | $1.38 | 2d | 1 | 0.72mi |
| 7621 Pebble Beach Dr Rowlett, TX | 3.0 | 2.0 | 1544 | $1,895 | $1.23 | 43d | 1 | 0.73mi |
| 2130 Argolis Dr Rowlett, TX | 4.0 | 3.5 | 2239 | $3,299 | $1.47 | 17d | 1 | 0.74mi |
| 4617 Carmel Ln Rowlett, TX | 3.0 | 2.0 | 1402 | $1,999 | $1.43 | 24d | 1 | 0.74mi |
| 7813 Sunset Blvd Rowlett, TX | 3.0 | 3.5 | 2223 | $2,800 | $1.26 | 43d | 1 | 0.81mi |
| 8805 Bayshore Ln Rowlett, TX | 3.0 | 2.5 | 2148 | $1,600 | $0.74 | 4d | 1 | 0.81mi |
| 2221 Tangleridge Ln Rowlett, TX | 3.0 | 2.0 | 1415 | $1,995 | $1.41 | 2d | 1 | 0.83mi |
| 8902 Bayshore Ln Rowlett, TX | 4.0 | 2.5 | 1953 | $2,525 | $1.29 | 24d | 1 | 0.84mi |
| 2218 Fuqua Rd Rowlett, TX | 4.0 | 2.0 | 1705 | $2,300 | $1.35 | 7d | 1 | 0.85mi |
| 2008 Naples Rowlett, TX | 3.0 | 2.5 | 2217 | $2,695 | $1.22 | 2d | 1 | 0.87mi |
| 1926 Chiesa Rd Rowlett, TX | 3.0 | 2.0 | 1550 | $2,400 | $1.55 | 24d | 1 | 0.87mi |
| 1926 Chiesa Rd Rowlett, TX | 3.0 | 2.0 | 1550 | $2,400 | $1.55 | 43d | 1 | 0.87mi |
| 4321 Duck Pond Ln Rowlett, TX | 3.0 | 2.5 | 1956 | $2,500 | $1.28 | 43d | 1 | 0.88mi |
| 8102 Lake Bend Dr Rowlett, TX | 3.0 | 2.0 | 1579 | $2,145 | $1.36 | 43d | 1 | 0.89mi |
| 4322 Duck Pond Ln Rowlett, TX | 4.0 | 3.0 | 2100 | $2,950 | $1.40 | 24d | 1 | 0.90mi |
| 4322 Duck Pond Ln Rowlett, TX | 4.0 | 3.0 | 2089 | $2,795 | $1.34 | 2d | 1 | 0.90mi |
| 7005 Sunset Blvd Rowlett, TX | 3.0 | 2.5 | 2208 | $3,200 | $1.45 | 43d | 1 | 0.93mi |
| 8802 Briarwood Dr Rowlett, TX | 4.0 | 2.0 | 1750 | $2,875 | $1.64 | 43d | 1 | 1.03mi |
| 1801 Bayside Dr Rowlett, TX | 1.0–4.0 | 1.0–4.0 | 1226 | $2,149 | $1.75 | 2d | 36 | 1.04mi |
| 8505 Woodside Rd Rowlett, TX | 3.0 | 2.0 | 1709 | $2,200 | $1.29 | 43d | 1 | 1.05mi |
| 9117 Lakepointe Ave Rowlett, TX | 3.0 | 2.5 | 2152 | $2,999 | $1.39 | 43d | 1 | 1.05mi |
| 8400 Sunset Blvd Rowlett, TX | 1.0–4.0 | 1.0–4.0 | 1303 | $2,017 | $1.55 | 2d | 35 | 1.14mi |
| 8513 Kensington Dr Rowlett, TX | 3.0 | 2.0 | 1830 | $1,800 | $0.98 | 11d | 1 | 1.17mi |
Listing history 14 events
-
2026-06-18days on market $270,000 Active 23 DOM
-
2026-06-17days on market $270,000 Active 22 DOM
-
2026-06-16days on market $270,000 Active 21 DOM
-
2026-06-15days on market $270,000 Active 20 DOM
-
2026-06-13days on market $270,000 Active 18 DOM
-
2026-06-09days on market $270,000 Active 14 DOM
-
2026-06-08days on market $270,000 Active 13 DOM
-
2026-06-07days on market $270,000 Active 12 DOM
-
2026-06-04days on market $270,000 Active 9 DOM
-
2026-06-03days on market $270,000 Active 8 DOM
-
2026-06-02days on market $270,000 Active 7 DOM
-
2026-06-02days on market $270,000 Active 6 DOM
-
2026-05-31days on market $270,000 Active 5 DOM
-
2026-05-26$270,000 Active
ⓘ Source: listings_history table (triggers on properties + properties_extension) + one-shot
backfill from property_details.listing_events for pre-trigger history.
Climate risk First Street
- Flood 1/10 Low FEMA zone X (unshaded) · 0% chance over 30 yrs
- Wildfire 1/10 Low
- Heat 8/10 Severe 7 d/yr ≥110°F today · 25 d/yr by 30 yrs out
- Wind 6/10 Major 27% chance of damaging wind over 30 yrs
- Air quality 2/10 Low 2 unhealthy d/yr today · 2 by 30 yrs out
Nearby sold comps map
Loading sold comps map…
Walkable amenities ~0.75 mi
Loading nearby amenities…
Taxation est. · year 1
- Rental income
- $27,522
- − Mortgage interest
- −$15,124
- − Property taxes
- −$4,050
- − Insurance
- −$1,350
- − Repairs & maintenance
- −$2,202
- − Management
- −$2,202
- − Depreciation
- −$7,855
- Taxable loss
- −$5,261
- Est. tax savings @ 24.0%
- +$1,263
- After-tax cash flow
- $614/yr
For passive investors: Depreciation is non-cash, so a rental often shows a tax loss while cash-flowing — sheltering income. Rental losses are passive: they offset passive income freely, and up to $25,000/yr can offset ordinary (W-2) income if you actively participate and your MAGI is under $100k (phasing out to $0 by $150k); unused losses carry forward. On sale, claimed depreciation is recaptured at up to 25%, and gains may owe capital-gains tax (a 1031 exchange can defer both). Figures are a year-1 estimate at your 24.0% rate — not tax advice; consult a CPA.
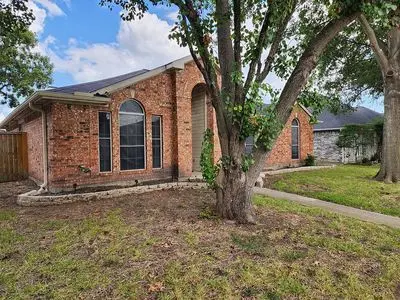
Condition & rehab AI · 1 photo
This home requires significant repairs and maintenance, particularly in the exterior and landscaping areas. Improvements in these areas would significantly enhance its value.
Repairs flagged
- Major tree damage — Significant tree damage
- Major landscaping — Overgrown and needs trimming
Value-add opportunities
- Both landscaping — Improves curb appeal and property value
- Both painting — Enhances interior and exterior aesthetics
- Both flooring — Improves living space and adds value
Renovation cost estimate screening
| Repair item | Severity | Est. cost |
|---|---|---|
| tree damage · Significant tree damage | Major | $15,000–50,000 |
| landscaping · Overgrown and needs trimming | Major | $15,000–50,000 |
| Total estimated repair cost · 2 items | $30,000–100,000 |
Value-add ROI direction
- Both landscaping — Improves curb appeal and property value ↑
- Both painting — Enhances interior and exterior aesthetics ↑
- Both flooring — Improves living space and adds value ↑
ⓘ Cost ranges are severity-bucket heuristics (US national rule-of-thumb). Get contractor quotes + a written scope before underwriting a rehab budget.
Schools (NCES district)
- District
- Garland ISD
- NCES district ID
- 4820340
- Math proficiency
- 27% ▼ -23.00%
- Reading proficiency
- 37% ▼ -10.00%
- Median HH income
- $58,392
- Composite
- 28.63/100
- National rank
- #6706
- State rank
- #553 of 826 in TX
Livability — Rowlett
- Score
- 75/100
- State rank
- #147
- US rank
- #4150
Category grades
Schools grade is shown separately in the Schools card above.
Census & demographics
- Census place
- Rowlett, TX
- County
- Dallas County · 2,612,404 people
- City population
- 35,619
- Metro
- Dallas-Fort Worth-Arlington, TX
- Population (ZIP)
- 28,075
- Household income
- $105,313
- Rent vs Own
- Severe rent burden
- 626.0
Population outlook (Dallas County) Hauer SSP2
- Today (2025)
- 2,979,839 people
- By 2030
- 3,191,823 · +7.1%
- By 2040
- 3,619,611 · +21.5%
- By 2050
- 4,026,915 · +35.1%
- By 2075
- 4,957,073 · +66.4%
- By 2100
- 5,508,725 · +84.9%
Race, ethnicity, and origin ACS 2023
- Neighborhood character
- Diverse neighborhood (Simpson 0.62)
- Race & ethnicity
- White 56% Hispanic / Latino 19% Black 18% Two or more races 10% Asian 4%
- Hispanic origin (detail)
- Mexican 15%
- Common ancestry
- Slovak 3% Italian 2% Romanian 2%
- Foreign-born
- 10% · Canada, Vietnam
- Languages at home
- 84% English-only · Spanish 11% Other Indo-European 1% Other Asian/Pacific 1%
Political lean MEDSL · Dallas
- 2024 margin
- Strong D (+22.2) · D 60.2% · R 38.0% · Other 1.8%
- 2008→2024 swing
- +6.9pp toward D · 2008: 15.3pp · 2024: 22.2pp
- All cycles
- 2024: D+22.2 2020: D+31.6 2016: D+26.2 2012: D+15.4 2008: D+15.3
Not yet ingested
- Civics
- —
Market trends
- HPI YoY
- ▼ -6.72%
- Current HPI
- 328.27
- Rent YoY
- ▼ -1.22%
- Metro
- Dallas-Fort Worth-Arlington, TX
- State GDP YoY
- ▲ 3.95%
- F500 in state
- 110
Industry mix (Fortune 500 HQ in TX)
| Industry | F500 HQs | Revenue |
|---|---|---|
| Energy | 16 | $1,198B |
|
||
| Technology | 5 | $198B |
|
||
| Engineering / Construction | 4 | $72B |
|
||
| Energy Services | 3 | $60B |
|
||
| Utilities | 3 | $41B |
|
||
| Healthcare | 2 | $330B |
|
||
Price history
1 event — show timeline
- 2026-05-26 Listed $270,000 FSBO.com
Cash-flow waterfall
monthlySold comps — $/sqft
last 12 mo · ≤1 miLoading sold comps…