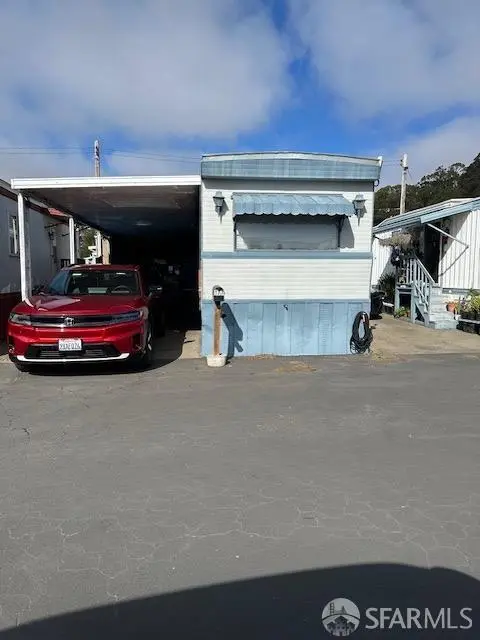
1700 El Camino Real Unit 17-7 · South San Francisco, CA
Flood risk 7/10 · Major
- FEMA flood zone
- X (unshaded)
- Chance of flooding over 30 yrs
- 0.77%
- Est. flood insurance / yr
- $507 – $1,088
Fire risk 2/10 · Minimal
- Est. fire insurance / yr
- $659 – $1,223
Heat risk 2/10 · Minimal
- Hot days now (above 77°F)
- 8 days/yr
- Hot days in 30 yrs
- 18 days/yr
Wind risk 1/10 · Minimal
- Chance of severe wind over 30 yrs
- —
Air-quality risk 7/10 · Major
- Unhealthy air days now
- 12 days/yr
- Unhealthy air days in 30 yrs
- 12 days/yr
Risk factors via First Street. Map © Google.
Why this score? — see what drove the B- grade
The composite is a weighted blend of 9 inputs, each scored 0–100. Each bar is that input's sub-score; the figure is the points it added to the 100-point composite (weight × sub-score).
- Cash flow +30.0/30.0
- 1% rule +10.0/10.0
- DSCR +10.0/10.0
- Rent growth +4.0/5.0
- Schools +4.0/10.0
- Condition / age +3.8/5.0
- ARV discount +3.4/15.0
- Livability +3.2/5.0
- Appreciation +0.0/10.0
$145,000
🖨 Deal sheet 📄 Offer letter ✓ Due diligence
Listing remarks MLS
Two bedrooms and one bathroom, well maintain, and fully remodeled two years ago, with two car garage tandem and storage. Certificate of Title 25 Done
Key facts
- Garage
- Built 1959
- Listed 25 days
Neighborhood map
What this means for you Summary
Snapshot
- This is a 2-bed/1.0-bath manufactured listed at $145k. Condition is rated good.
Deal economics
- At list price, monthly cash flow is $2k ($19k/yr) — positive.
- The deal already cash-flows at list — no discount required.
- Meets the 1% rule at list price ($3k rent vs $145k).
- Recommended offer: $143k (1.5% below list) — sets the bar for market timing.
- Cap rate 20.2% vs local median 2.2% in South San Francisco — top-decile yield for the area; either an underpriced asset or a hidden risk that comps aren't pricing in. Stress-test before assuming the spread holds.
Location & tenants
- Location reads 65/100 on livability (#372 in CA) — a middle-class / working-renter tenant base. Strengths: commute A+, employment A+; Watch: schools D-, amenities F, cost of living F.
- South San Francisco Unified (urban): math 38% / reading 47% proficiency, ranked #176 of 517 in CA (top 34%) — families likely to look elsewhere, expect single-tenant / working-renter base with shorter leases.
- Market conditions: Rents rising fast (+6.0%/yr); 72 active listings in the ZIP; 6 comparable units currently listed for rent nearby; rentals leasing fast (median 6d on market — plan ~1-2 weeks tenant-placement turnaround); high-income renter base; 1,019 units permitted in San Mateo County in 2024 (484 in 5+ unit buildings).
Forward outlook
- Local home prices are declining (-3.0%/yr); year-one equity from $1k of loan paydown is wiped out by about $4k of value loss. Plan a longer hold.
- San Mateo County population projected at +24% by 2050 — long-run rental-demand tailwind backs the buy-and-hold thesis.
- At projected returns (-3.0% appreciation + 6.0% rent growth), your $41k cash investment doubles in ~3 years — after that, you're playing with house money.
Negotiation context
- It's been on market 25 days — a 2% lower offer ($143k) is reasonable based on typical stale-listing flexibility.
- 3 sale attempts with the ask held roughly flat each time — persistent listings suggest the price (not the market) is what's stuck; bring a comps-based counter.
Risks & watch-outs
- Watch-outs: flood insurance adds $66/mo; built in 1959 — expect roof / HVAC / electrical / plumbing capex.
- Climate carrying-cost: major flood risk — expect insurance premiums to compound above CPI over the hold.
Questions for the listing agent
- Built in 1959 — when were the roof, HVAC, electrical panel, plumbing, and water heater last replaced?
- What's the actual annual flood-insurance premium (NFIP or private), and is the property in a SFHA with mandatory coverage?
- Is there a deadline driving the sale (1031 exchange, divorce, estate, relocation)? That informs how much negotiation room exists.
- Schools are D-rated, which usually means shorter tenancies and higher turnover. Who's the typical renter profile here, and what's been the actual vacancy rate?
- What's the average days-on-market for RENTAL listings here right now (not sales)? A rising rental-DOM trend means longer vacancies and softer asking-rent achievability than the comps imply.
- What's the recent tenant-quality profile in this submarket — average credit score on applications, eviction rate, late-payment / NSF rate, and stable-employment percentage? A property-management company in the area should have these aggregated.
- How much new for-sale + rental construction is in the pipeline within 1–3 miles? Heavy new supply typically softens prices + rents 12–24 months out; constrained supply supports both.
Investment metrics
- 1% rule
- 2.34% ✓
- Cap rate
- 20.23%
- Cash-on-cash
- 49.77%
- DSCR
- 3.21
- GRM
- 3.6
CMA / ARV
- ARV (median comp)
- $133,003
- List price
- $145,000
- Delta
- 9.02%
- Verdict
- FAIR
- Comps
- 2 within 1.0 mi
Show comp detail 2 sales within ~0.75 mi
| Address | Dist | Beds/Ba | Sqft | Sold | Price | $/sf | Match |
|---|---|---|---|---|---|---|---|
| 1700 El Camino Real Unit 17-11 | 0.07mi | 2/1.0 | 480 (-4%) | 18mo | $89,000 | $185 | 75 |
| 1700 El Camino Real Unit 19-15 | 0.07mi | 1/1.0 (-1) | 574 (+15%) | 9mo | $140,000 | $244 | 60 |
Match score weights: distance 35% · size 25% · config 20% · recency 20%. Top-matched comps best support the ARV.
Projected returns pro-forma
-3.0% appreciation · 6.02% rent growth · sell at horizon
- IRR
- 48.7%
- Equity multiple
- 3.22×
- Total profit
- $90,255
- Equity at exit
- $21,620
- IRR
- 55.6%
- Equity multiple
- 7.36×
- Total profit
- $258,087
- Equity at exit
- $12,537
Cash invested: $40,600 (down + closing). Projections, not guarantees.
Landlord ↔ Tenant lean methodology
- Overall (STATE)
- 18 Strongly Tenant-Friendly
- State California
- 18 Strongly Tenant-Friendly · D+13
- County
- — inherits STATE
- City
- — inherits STATE
ZIP-level market 94080
- Rents YoY
- 6.0%
- Active inventory
- 72
- Price-to-rent
- 3.6×
Monthly cashflow live
- Estimated rent
- $3,400 high interval (Pro) →
- Mortgage (P&I)
- −$760
- Tax est. 1.5%
- −$181 /mo · $2,175/yr
- Insurance
- −$60
- Flood insurance flood zone
- −$66 /mo · $798/yr
- HOA
- −$0
- Vacancy / Maint / Mgmt
- −$714
- Net cashflow
- $1,617
Break-even live
UW: 25.0% down · 7.5% · 30yr · 1.5% tax · 5.0% vac · 8.0% maint · 8.0% mgmt
Financing live
Cash to close
- Down payment
- $36,250
- Closing costs
- $4,350
- Reserves months
- —
- Total cash needed
- —
Loan-product check · same deal, 3 products live
Conventional
25% down · 7.5% · 30yr
- Down + closing
- —
- Monthly P&I
- —
- Monthly cashflow
- —
- DSCR
- —
- Eligible?
- —
Personal DTI + credit; lowest rate.
DSCR
20% down · 8.5% · 30yr
- Down + closing
- —
- Monthly P&I
- —
- Monthly cashflow
- —
- DSCR
- —
- Eligible?
- —
No personal income docs; deal must DSCR.
Hard money
10% down · 12.0% · 12mo
- Down + closing
- —
- Monthly P&I
- —
- Monthly cashflow
- —
- DSCR
- —
- Eligible?
- —
Short-term bridge; refi at stabilization.
Rent comps 6 comps
| Address | Beds | Baths | Sqft | Rent | $/sqft | DOM | Units | Dist |
|---|---|---|---|---|---|---|---|---|
| 101 McLellan Dr South San Francisco, CA | 2.0 | 1.0–2.0 | 779 | $3,825 | $4.91 | 2d | 8 | 0.28mi |
| 1059 Grand Ave Unit 10652 South San Francisco, CA | 1.0 | 1.0 | 700 | $2,595 | $3.71 | 24d | 1 | 0.96mi |
| 572 King Dr Daly City, CA | 1.0 | 1.0 | 750 | $3,125 | $4.17 | 24d | 1 | 1.11mi |
| 1134 Marcie Cir Unit 1112 South San Francisco, CA | 1.0 | 1.0 | 673 | $2,450 | $3.64 | 5d | 1 | 1.11mi |
| 7800 El Camino Real Colma, CA | 3.0 | 1.0–2.0 | 879 | $3,548 | $4.03 | 2d | 1 | 1.37mi |
| 435 Gateway Dr Pacifica, CA | 2.0 | 1.0–2.0 | 718 | $2,999 | $4.17 | 1d | 4 | 1.48mi |
Listing history 5 events
-
2026-05-08status Pending 149-char remark
Show marketing remark (149 chars)
Two bedrooms and one bathroom, well maintain, and fully remodeled two years ago, with two car garage tandem and storage. Certificate of Title 25 Done
-
2026-04-22status Active 149-char remark
Show marketing remark (149 chars)
Two bedrooms and one bathroom, well maintain, and fully remodeled two years ago, with two car garage tandem and storage. Certificate of Title 25 Done
-
2026-04-15status Pending 149-char remark
Show marketing remark (149 chars)
Two bedrooms and one bathroom, well maintain, and fully remodeled two years ago, with two car garage tandem and storage. Certificate of Title 25 Done
-
2026-04-06$145,000 Active 149-char remark
Show marketing remark (149 chars)
Two bedrooms and one bathroom, well maintain, and fully remodeled two years ago, with two car garage tandem and storage. Certificate of Title 25 Done
-
2025-11-02$135,000 Active
ⓘ Source: listings_history table (triggers on properties + properties_extension) + one-shot
backfill from property_details.listing_events for pre-trigger history.
Climate risk First Street
- Flood 7/10 Severe FEMA zone X (unshaded) · 77% chance over 30 yrs
- Wildfire 2/10 Low
- Heat 2/10 Low 8 d/yr ≥77°F today · 18 d/yr by 30 yrs out
- Wind 1/10 Low
- Air quality 7/10 Severe 12 unhealthy d/yr today · 12 by 30 yrs out
Nearby sold comps map
Loading sold comps map…
Walkable amenities ~0.75 mi
Loading nearby amenities…
Taxation est. · year 1
- Rental income
- $40,800
- − Mortgage interest
- −$8,122
- − Property taxes
- −$2,175
- − Insurance
- −$1,522
- − Repairs & maintenance
- −$3,264
- − Management
- −$3,264
- − Depreciation
- −$4,218
- Taxable income
- $18,234
- Est. tax owed @ 24.0%
- −$4,376
- After-tax cash flow
- $15,033/yr
For passive investors: Depreciation is non-cash, so a rental often shows a tax loss while cash-flowing — sheltering income. Rental losses are passive: they offset passive income freely, and up to $25,000/yr can offset ordinary (W-2) income if you actively participate and your MAGI is under $100k (phasing out to $0 by $150k); unused losses carry forward. On sale, claimed depreciation is recaptured at up to 25%, and gains may owe capital-gains tax (a 1031 exchange can defer both). Figures are a year-1 estimate at your 24.0% rate — not tax advice; consult a CPA.
Condition & rehab AI · 12 photos
This mobile home is well-maintained and fully remodeled, with good condition throughout. It is move-in ready and would benefit from a fresh coat of paint and landscaping to further enhance its curb appeal and value.
Value-add opportunities
- Both painting — enhances curb appeal and interior
- Both landscaping — improves curb appeal
- Both new flooring — enhances interior and adds value
Renovation cost estimate screening
Value-add ROI direction
- Both painting — enhances curb appeal and interior ↑
- Both landscaping — improves curb appeal ↑
- Both new flooring — enhances interior and adds value ↑
ⓘ Cost ranges are severity-bucket heuristics (US national rule-of-thumb). Get contractor quotes + a written scope before underwriting a rehab budget.
Schools (NCES district)
- District
- South San Francisco Unified
- NCES district ID
- 0637530
- Math proficiency
- 38% ▼ -6.00%
- Reading proficiency
- 47% ▼ -5.00%
- Median HH income
- $82,986
- Composite
- 39.69/100
- National rank
- #3905
- State rank
- #176 of 517 in CA
Livability — South San Francisco
- Score
- 65/100
- State rank
- #372
- US rank
- #12707
Category grades
Schools grade is shown separately in the Schools card above.
Census & demographics
- Census place
- South San Francisco, CA
- County
- San Mateo County · 733,415 people
- City population
- 64,761
- Metro
- San Francisco-Oakland-Berkeley, CA
- Population (ZIP)
- 64,761
- Household income
- $136,733
- Rent vs Own
- Severe rent burden
- 2470.0
Population outlook (San Mateo County) Hauer SSP2
- Today (2025)
- 864,008 people
- By 2030
- 910,523 · +5.4%
- By 2040
- 997,285 · +15.4%
- By 2050
- 1,071,189 · +24.0%
- By 2075
- 1,197,206 · +38.6%
- By 2100
- 1,192,523 · +38.0%
Race, ethnicity, and origin ACS 2023
- Neighborhood character
- Diverse neighborhood (Simpson 0.68)
- Race & ethnicity
- Asian 42% Hispanic / Latino 31% White 21% Two or more races 13% Black 2% Pacific Islander 1%
- Hispanic origin (detail)
- Mexican 18%
- Common ancestry
- Lithuanian 1% Italian 1% Scotch-Irish 1%
- Foreign-born
- 40% · Canada, China, Vietnam
- Languages at home
- 47% English-only · Spanish 20% Tagalog/Filipino 12% Chinese 11%
Political lean MEDSL · San Mateo
- 2024 margin
- Solid D (+50.3) · D 73.5% · R 23.2% · Other 3.3%
- 2008→2024 swing
- +1.6pp toward D · 2008: 48.7pp · 2024: 50.3pp
- All cycles
- 2024: D+50.3 2020: D+57.7 2016: D+57.7 2012: D+44.8 2008: D+48.7
Not yet ingested
- Civics
- —
Market trends
- HPI YoY
- ▼ -1094.19%
- Current HPI
- 330.5769
- Rent YoY
- ▲ 6.02%
- Metro
- San Francisco-Oakland-Berkeley, CA
- State GDP YoY
- ▲ 3.21%
- F500 in state
- 116
Industry mix (Fortune 500 HQ in CA)
| Industry | F500 HQs | Revenue |
|---|---|---|
| Technology | 27 | $1,492B |
|
||
| Financial Services | 3 | $174B |
|
||
| Retail | 3 | $44B |
|
||
| Insurance | 3 | $26B |
|
||
| Media / Entertainment | 2 | $115B |
|
||
| Pharmaceuticals / Biotech | 2 | $62B |
|
||
Price history
+7.4% since first listed5 events — show timeline
- 2026-05-08 Pending — San Francisco MLS
- 2026-04-22 Relisted — San Francisco MLS
- 2026-04-15 Pending — San Francisco MLS
- 2026-04-06 Listed $145,000 San Francisco MLS
- 2025-11-02 Listed $135,000 San Francisco MLS
Cash-flow waterfall
monthlySold comps — $/sqft
last 12 mo · ≤1 miLoading sold comps…