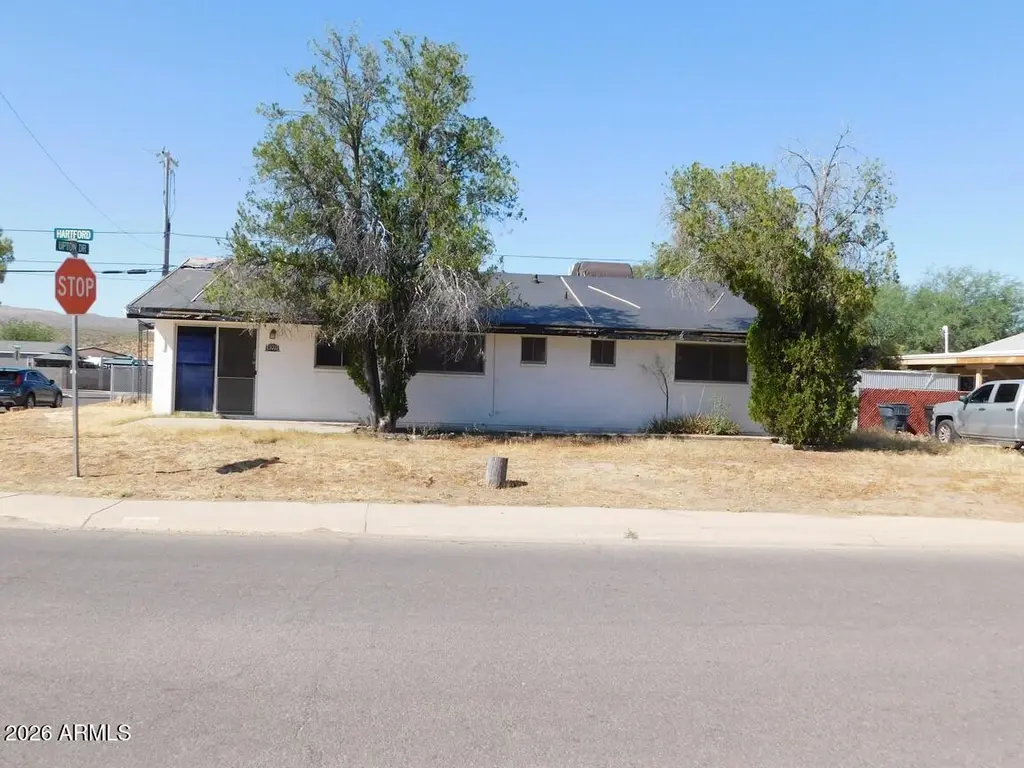
301 W Hartford Rd · Kearny, AZ
Flood risk 6/10 · Moderate
- FEMA flood zone
- X (unshaded)
- Chance of flooding over 30 yrs
- 0.71%
- Est. flood insurance / yr
- $507 – $1,088
Fire risk 5/10 · Moderate
- Est. fire insurance / yr
- $610 – $1,132
Heat risk 8/10 · Major
- Hot days now (above 109°F)
- 7 days/yr
- Hot days in 30 yrs
- 19 days/yr
Wind risk 1/10 · Minimal
- Chance of severe wind over 30 yrs
- —
Air-quality risk 1/10 · Minimal
- Unhealthy air days now
- 0 days/yr
- Unhealthy air days in 30 yrs
- 0 days/yr
Risk factors via First Street. Map © Google.
Why this score? — see what drove the A grade
The composite is a weighted blend of 9 inputs, each scored 0–100. Each bar is that input's sub-score; the figure is the points it added to the 100-point composite (weight × sub-score).
- Cash flow +30.0/30.0
- ARV discount +15.0/15.0
- DSCR +10.0/10.0
- Appreciation +10.0/10.0
- 1% rule +9.6/10.0
- Livability +3.7/5.0
- Rent growth +2.5/5.0
- Schools +2.5/10.0
- Condition / age +2.5/5.0
$109,900
🖨 Deal sheet (PDF) 📄 Offer letter ✓ Due diligence
Key facts
- 7,545 sq ft lot
- Built 1959
- Listed 13 days
Property features AI
Finance
- Other: Lot size approximately 7,545 (source: assessor)
- Financial info: Property tax information available
- HOA & community: No association fees
Exterior
- Parking: Parking details not provided
- Security: No security features listed
- Utilities: City water; Public sewer
- Home design: Single-family residence; Fee simple ownership; Fixer condition; Asphalt road surface
- Construction: Painted block construction; Composition roof (see remarks / other)
- Exterior features: Shed(s); Storage; Chain link fencing; Natural desert front and back; Dirt front and back; City-maintained road
Interior
- Kitchen: Refrigerator; Dishwasher; Pantry; Laminate counters; Eat-in kitchen
- Bedrooms: Possible 4 bedrooms; Primary bedroom located on the first floor
- Flooring: Carpet; Vinyl
- Bathrooms: 2 full bathrooms
- Heating & cooling: Electric heating; Central air; Ceiling fans; See remarks for additional cooling details
- Interior features: Eat-in kitchen; Pantry; 3/4 bath in primary bedroom; Laminate counters; Storage
- Laundry & utility: Inside laundry
Neighborhood map
What this means for you Summary
Snapshot
- This is a 4-bed/2.0-bath single-family listed at $110k.
Deal economics
- At list price, monthly cash flow is $571 ($7k/yr) — positive.
- The deal already cash-flows at list — no discount required.
- Meets the 1% rule at list price ($2k rent vs $110k).
Location & tenants
- Location reads 74/100 on livability (#20 in AZ, #4,875 nationally) — a middle-class / working-renter tenant base. Strengths: cost of living A+, housing A+, health & safety A+; Watch: employment C-, amenities F, commute F.
- Ray Unified District (4438) (rural): math 22% / reading 30% proficiency, ranked #318 of 501 in AZ (top 64%) — low school quality limits family demand, transient renter base, plan for 1-2y turnover.
- Zoned schools: Ray Elementary School (math 17% / reading 22%, grade F, #752 of 1,109 statewide, top 70%, 184 students, 55% FRL); Ray Jr/Sr High School (math 8% / reading 12%, grade F, #343 of 381 statewide, top 93%, 189 students, 48% FRL).
- Market conditions: 16 active listings in the ZIP; 1 comparable units currently listed for rent nearby; 9,504 units permitted in Pinal County in 2024 (776 in 5+ unit buildings).
Forward outlook
- In year one you build about $12k of equity ($760 loan paydown + $11k appreciation (10.0% local appreciation)).
- At projected returns (10.0% appreciation + 3.0% rent growth), your $31k cash investment doubles in ~2 years — after that, you're playing with house money.
- By year 4, paydown + projected appreciation supports a ~$42k cash-out refi (75% LTV) — recoverable capital for the next deal without selling this one.
Negotiation context
- Only 13 days on market — expect competitive offers; lowballing is unlikely to land.
- 3 sale attempts since 6y ago with the ask held roughly flat each time — persistent listings suggest the price (not the market) is what's stuck; bring a comps-based counter.
- Current owner paid $60k; list at $110k implies a 83% gain — meaningful room to come down on a strong offer.
Risks & watch-outs
- Watch-outs: built in 1959 — expect roof / HVAC / electrical / plumbing capex.
- Climate carrying-cost: major flood risk; moderate wildfire risk; extreme-heat days projected 7→19/yr by 2055 (HVAC capex compounding) — expect insurance premiums to compound above CPI over the hold.
Questions for the listing agent
- Built in 1959 — when were the roof, HVAC, electrical panel, plumbing, and water heater last replaced?
- Is there a deadline driving the sale (1031 exchange, divorce, estate, relocation)? That informs how much negotiation room exists.
- Schools are F-rated, which usually means shorter tenancies and higher turnover. Who's the typical renter profile here, and what's been the actual vacancy rate?
- What's the average days-on-market for RENTAL listings here right now (not sales)? A rising rental-DOM trend means longer vacancies and softer asking-rent achievability than the comps imply.
- What's the recent tenant-quality profile in this submarket — average credit score on applications, eviction rate, late-payment / NSF rate, and stable-employment percentage? A property-management company in the area should have these aggregated.
- How much new for-sale + rental construction is in the pipeline within 1–3 miles? Heavy new supply typically softens prices + rents 12–24 months out; constrained supply supports both.
Investment metrics
- 1% rule
- 1.46% ✓
- Cap rate
- 12.53%
- Cash-on-cash
- 22.28%
- DSCR
- 1.99
- GRM
- 5.7
CMA / ARV
- ARV (on-the-fly)
- $183,456
- Comps found
- 12
Show comp detail 12 sales within ~0.75 mi
| Address | Dist | Beds/Ba | Sqft | Sold | Price | $/sf | Match |
|---|---|---|---|---|---|---|---|
| 336 W Greenwich Rd | 0.25mi | 4/2.0 | 1,248 (0%) | 5mo | $175,000 | $140 | 84 |
| 217 W Fairhaven Rd W | 0.10mi | 3/1.8 (-1) | 1,232 (-1%) | 10mo | $230,000 | $187 | 79 |
| 215 W Greenwich Rd | 0.06mi | 3/2.0 (-1) | 1,177 (-6%) | 9mo | $173,000 | $147 | 75 |
| 329 W Fairhaven Rd | 0.22mi | 3/2.0 (-1) | 1,254 (+0%) | 11mo | $210,000 | $167 | 75 |
| 418 W Hartford Rd | 0.48mi | 4/2.0 | 1,260 (+1%) | 4mo | $185,000 | $147 | 73 |
| 173 W Jamestown Rd | 0.32mi | 4/2.0 | 1,223 (-2%) | 13mo | $218,500 | $179 | 71 |
| 610 S York Dr | 0.24mi | 3/2.0 (-1) | 1,112 (-11%) | 3mo | $115,000 | $103 | 63 |
| 437 W Hartford Rd | 0.60mi | 3/2.0 (-1) | 1,246 (-0%) | 17mo | $114,000 | $91 | 52 |
| 426 W Essex Rd | 0.53mi | 3/2.0 (-1) | 1,383 (+11%) | 3mo | $230,000 | $166 | 50 |
| 429 W Greenwich Rd | 0.55mi | 3/1.5 (-1) | 1,293 (+4%) | 16mo | $175,000 | $135 | 48 |
| 443 W Ivanhoe Rd | 0.66mi | 3/1.0 (-1) | 1,164 (-7%) | 11mo | $165,000 | $142 | 40 |
| 504 W Hartford Rd | 0.66mi | 3/2.0 (-1) | 1,370 (+10%) | 14mo | $140,000 | $102 | 36 |
Match score weights: distance 35% · size 25% · config 20% · recency 20%. Top-matched comps best support the ARV.
Projected returns pro-forma
10.0% appreciation · 3.0% rent growth · sell at horizon
- IRR
- 41.0%
- Equity multiple
- 4.13×
- Total profit
- $96,229
- Equity at exit
- $99,007
- IRR
- 35.3%
- Equity multiple
- 9.28×
- Total profit
- $254,727
- Equity at exit
- $213,512
Cash invested: $30,772 (down + closing). Projections, not guarantees.
Landlord ↔ Tenant lean methodology
- Overall (STATE)
- 87 Strongly Landlord-Friendly
- State Arizona
- 87 Strongly Landlord-Friendly · R+3
- County
- — inherits STATE
- City
- — inherits STATE
ZIP-level market 85137
- Home prices YoY
- 22.6%
- Active inventory
- 16
- Price-to-rent
- 5.7×
Monthly cashflow live
- Estimated rent
- $1,600 medium interval (Pro) →
- Mortgage (P&I)
- −$576
- Tax from tax record
- −$71 /mo · $846/yr
- Insurance
- −$46
- HOA
- −$0
- Vacancy / Maint / Mgmt
- −$336
- Net cashflow
- $571
Break-even live
Sensitivity live
| Price | -10% $634 | -5% $602 | +0% $571 | +5% $540 | +10% $509 |
|---|---|---|---|---|---|
| Rent | -10% $445 | -5% $508 | +0% $571 | +5% $635 | +10% $698 |
| Rate | -1.0pp $627 | -0.5pp $599 | base $571 | +0.5pp $543 | +1.0pp $514 |
UW: 25.0% down · 7.5% · 30yr · 1.5% tax · 5.0% vac · 8.0% maint · 8.0% mgmt
Financing live
Cash to close
- Down payment
- $27,475
- Closing costs
- $3,297
- Reserves months
- —
- Total cash needed
- —
Loan-product check · same deal, 3 products live
Conventional
25% down · 7.5% · 30yr
- Down + closing
- —
- Monthly P&I
- —
- Monthly cashflow
- —
- DSCR
- —
- Eligible?
- —
Personal DTI + credit; lowest rate.
DSCR
20% down · 8.5% · 30yr
- Down + closing
- —
- Monthly P&I
- —
- Monthly cashflow
- —
- DSCR
- —
- Eligible?
- —
No personal income docs; deal must DSCR.
Hard money
10% down · 12.0% · 12mo
- Down + closing
- —
- Monthly P&I
- —
- Monthly cashflow
- —
- DSCR
- —
- Eligible?
- —
Short-term bridge; refi at stabilization.
Rent comps 1 comps
| Address | Beds | Baths | Sqft | Rent | $/sqft | DOM | Units | Dist |
|---|---|---|---|---|---|---|---|---|
| 327 W Fairhaven Rd Kearny, AZ | 4.0 | 1.5 | 1294 | $1,600 | $1.24 | 45d | 1 | 0.19mi |
Listing history 8 events
-
2026-06-21days on market $109,900 Active 13 DOM
-
2026-06-18days on market $109,900 Active 10 DOM
-
2026-06-17days on market $109,900 Active 9 DOM
-
2026-06-16days on market $109,900 Active 8 DOM
-
2026-06-15days on market $109,900 Active 7 DOM
-
2026-06-13days on market $109,900 Active 5 DOM
-
2026-06-13days on market $109,900 Active 4 DOM
-
2026-06-08$109,900 Active 1 DOM
ⓘ Source: listings_history table (triggers on properties + properties_extension) + one-shot
backfill from property_details.listing_events for pre-trigger history.
Tax reassessment forecast AZ · Resets to sale price
- Current annual tax
- $846 · $71/mo
- Projected year-2 tax
- $846 · $71/mo
- Expected delta
- $0/yr ($0/mo · 0.0%)
ⓘ Screening estimate from a state-policy table — verify with the county assessor before closing.
Climate risk First Street
- Flood 6/10 Major FEMA zone X (unshaded) · 71% chance over 30 yrs
- Wildfire 5/10 Major
- Heat 8/10 Severe 7 d/yr ≥109°F today · 19 d/yr by 30 yrs out
- Wind 1/10 Low
- Air quality 1/10 Low 0 unhealthy d/yr today · 0 by 30 yrs out
Nearby sold comps map
Loading sold comps map…
Walkable amenities ~0.75 mi
Loading nearby amenities…
Taxation est. · year 1
- Rental income
- $19,200
- − Mortgage interest
- −$6,156
- − Property taxes
- −$846
- − Insurance
- −$550
- − Repairs & maintenance
- −$1,536
- − Management
- −$1,536
- − Depreciation
- −$3,197
- Taxable income
- $5,379
- Est. tax owed @ 24.0%
- −$1,291
- After-tax cash flow
- $5,566/yr
For passive investors: Depreciation is non-cash, so a rental often shows a tax loss while cash-flowing — sheltering income. Rental losses are passive: they offset passive income freely, and up to $25,000/yr can offset ordinary (W-2) income if you actively participate and your MAGI is under $100k (phasing out to $0 by $150k); unused losses carry forward. On sale, claimed depreciation is recaptured at up to 25%, and gains may owe capital-gains tax (a 1031 exchange can defer both). Figures are a year-1 estimate at your 24.0% rate — not tax advice; consult a CPA.
Schools (NCES district)
- District
- Ray Unified District (4438)
- NCES district ID
- 0406850
- Math proficiency
- 22% ▼ -5.00%
- Reading proficiency
- 30% ▼ -3.00%
- Median HH income
- $45,632
- Composite
- 25.45/100
- National rank
- #12864
- State rank
- #318 of 501 in AZ
Livability — Kearny
- Score
- 74/100
- State rank
- #20
- US rank
- #4875
Category grades
Schools grade is shown separately in the Schools card above.
Census & demographics
- Census place
- Kearny, AZ
- Population (ZIP)
- 2,533
Population outlook (Pinal County) Hauer SSP2
- Today (2025)
- 437,574 people
- By 2030
- 446,903 · +2.1%
- By 2040
- 452,589 · +3.4%
- By 2050
- 444,126 · +1.5%
- By 2075
- 430,300 · -1.7%
- By 2100
- 393,536 · -10.1%
Race, ethnicity, and origin ACS 2023
- Neighborhood character
- Majority White (61%)
- Race & ethnicity
- White 61% Hispanic / Latino 38% Two or more races 15% Native American 1%
- Hispanic origin (detail)
- Mexican 35%
- Common ancestry
- Slovak 7% Italian 1% Lithuanian 1%
- Foreign-born
- 4% · Canada
- Languages at home
- 83% English-only · Spanish 16% German/W. Germanic 1%
Political lean MEDSL · Pinal
- 2024 margin
- Strong R (+22.1) · D 38.5% · R 60.6%
- 2008→2024 swing
- -7.6pp toward R · 2008: -14.5pp · 2024: -22.1pp
- All cycles
- 2024: R+22.1 2020: R+17.3 2016: R+19.3 2012: R+17.1 2008: R+14.5
Not yet ingested
- Civics
- —
Market trends
- HPI YoY
- ▲ 22.16%
- Current HPI
- 120.15
- Rent YoY
- —
- Metro
- —
- State GDP YoY
- ▲ 4.54%
- F500 in state
- 20
Industry mix (Fortune 500 HQ in AZ)
| Industry | F500 HQs | Revenue |
|---|---|---|
| Technology | 2 | $13B |
|
||
| Mining / Metals | 1 | $23B |
|
||
| Environmental Services | 1 | $16B |
|
||
| Metals / Steel | 1 | $14B |
|
||
| Technology Distribution | 1 | $9B |
|
||
| Homebuilding | 1 | $8B |
|
||
Price history
+838.0% since first listed10 events — show timeline
- 2026-06-08 Listed $109,900 ARMLS
- 2025-04-22 Listing Removed — ARMLS
- 2024-11-22 Listed $160,000 ARMLS
- 2021-03-07 Listing Removed — ARMLS
- 2021-02-08 Contingent — ARMLS
- 2020-12-23 Price Changed $124,000 ARMLS
- 2020-12-12 Price Changed $129,900 ARMLS
- 2020-11-02 Listed $135,000 ARMLS
- 2020-09-08 Sold (Public Records) $60,000 Public Records
- 1994-09-26 Sold (Public Records) $11,717 Public Records
Property tax history
+2.0%/yrLatest (2025): $846 · +7.6% YoY. Source: county tax records.
Cash-flow waterfall
monthlySold comps — $/sqft
last 12 mo · ≤1 miLoading sold comps…