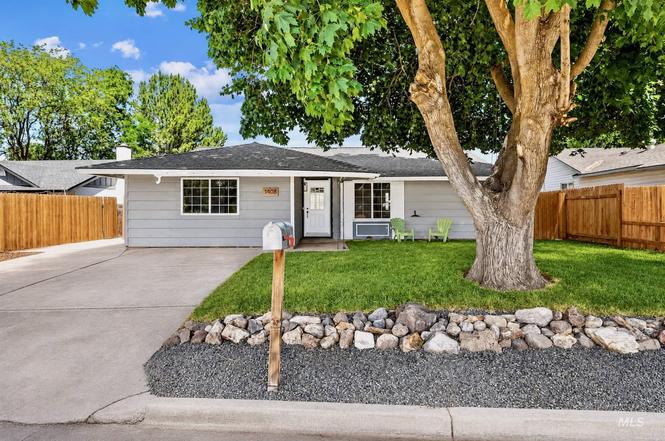
1408 N Indiana Ave · Caldwell, ID
Flood risk 1/10 · Minimal
- FEMA flood zone
- X (unshaded)
- Chance of flooding over 30 yrs
- 0.0%
- Est. flood insurance / yr
- $507 – $1,088
Fire risk 4/10 · Minor
- Est. fire insurance / yr
- $584 – $1,086
Heat risk 4/10 · Minor
- Hot days now (above 99°F)
- 7 days/yr
- Hot days in 30 yrs
- 16 days/yr
Wind risk 1/10 · Minimal
- Chance of severe wind over 30 yrs
- —
Air-quality risk 7/10 · Major
- Unhealthy air days now
- 11 days/yr
- Unhealthy air days in 30 yrs
- 18 days/yr
Risk factors via First Street. Map © Google.
Why this score? — see what drove the D- grade
The composite is a weighted blend of 9 inputs, each scored 0–100. Each bar is that input's sub-score; the figure is the points it added to the 100-point composite (weight × sub-score).
- Cash flow +9.1/30.0
- ARV discount +7.5/15.0
- Appreciation +5.0/10.0
- Livability +3.4/5.0
- DSCR +2.5/10.0
- Rent growth +2.5/5.0
- Condition / age +2.5/5.0
- Schools +2.0/10.0
- 1% rule +1.5/10.0
$329,000
🖨 Deal sheet 📄 Offer letter ✓ Due diligence
Listing remarks
Set on a peacefully secluded setting of open land, this thoughtfully updated home offers the rare feeling of country living while remaining close to the charm and momentum of Caldwell's up and coming happenings. A generous and freshly renovated yard creates a charming setting with room to breathe, with an expansive front lawn perfectly positioned for sunset evenings, gatherings with friends, and playing with your kids on the tree swing. Inside are refinished wood floors with warm designer finishes that create an appealing and inviting atmosphere throughout the home. Morning light fills the open living room, which flows naturally into the spacious kitchen and dining area, creating a layout t
Key facts
- Open living room
- Renovated yard
- Spacious kitchen
Tags
Property features AI
Exterior
- Parking: RV access/parking; Finished driveway
- Utilities: City water service; Sewer connected; Cable connected
- Home design: Single family residence; Built in 1972
- Construction: Frame construction with HardiPlank-type siding; Architectural-style roof; Crawl space foundation
- Exterior features: Full wood fencing; Pressurized irrigation sprinkler system; Manual sprinkler system; Full sprinkler system; Paved road frontage; Storage shed
Interior
- Kitchen: Dishwasher; Disposal; Oven/range (freestanding); Refrigerator
- Bedrooms: 3 bedrooms (all on the main level); Primary bedroom approximately 13 x 13; Second bedroom approximately 10 x 10; Third bedroom approximately 10 x 10
- Flooring: Hardwood; Carpet
- Bathrooms: 1 bathroom
- Heating & cooling: Baseboard heating; No central air
- Interior features: Den/office; Family room; Master bedroom on main level
- Laundry & utility: Washer; Dryer; Electric water heater
Neighborhood map
What this means for you Summary
Snapshot
- This is a 3-bed/1.0-bath other listed at $329k.
Deal economics
- At list price, monthly cash flow is $-255 ($-3k/yr) — negative.
- To cash-flow at today's rent, offer at most $284k (13.7% below list).
- To meet the 1% rule (rent ≥ 1% of price), the offer needs to be $213k (35.3% below list).
- Recommended offer: $213k (35.3% below list) — sets the bar for 1% rule.
- Cap rate 5.4% vs local median 3.1% in Caldwell — top-decile yield for the area; either an underpriced asset or a hidden risk that comps aren't pricing in. Stress-test before assuming the spread holds.
Location & tenants
- Location reads 67/100 on livability (#88 in ID) — a middle-class / working-renter tenant base. Strengths: cost of living A+, housing A+; Watch: crime C-, employment D+, amenities F.
- Caldwell District (suburban): math 17% / reading 31% proficiency, ranked #90 of 92 in ID (top 98%) — low school quality limits family demand, transient renter base, plan for 1-2y turnover; 72% free/reduced lunch — lower-income household profile, screen leases tightly.
- Zoned schools: Sacajawea Elementary School (math 15% / reading 24%, grade F, #346 of 357 statewide, top 97%, 405 students, 91% FRL); Caldwell Senior High School (math 16% / reading 38%, grade F, #131 of 169 statewide, top 77%, 1,474 students, 76% FRL).
- Market conditions: 1 active listings in the ZIP; 10 comparable units currently listed for rent nearby; rentals leasing fast (median 3d on market — plan ~1-2 weeks tenant-placement turnaround); 3,620 units permitted in Canyon County in 2024 (196 in 5+ unit buildings).
Forward outlook
- In year one you build about $12k of equity ($2k loan paydown + $10k appreciation (3.0% local appreciation)).
- Canyon County population projected at +41% by 2050 — long-run rental-demand tailwind backs the buy-and-hold thesis.
- By year 3, paydown + projected appreciation supports a ~$30k cash-out refi (75% LTV) — recoverable capital for the next deal without selling this one.
Negotiation context
- Only 7 days on market — expect competitive offers; lowballing is unlikely to land.
- 3 sale attempts since 23y ago with the ask held roughly flat each time — persistent listings suggest the price (not the market) is what's stuck; bring a comps-based counter.
Questions for the listing agent
- What do current leases actually rent for vs. the listed asking? Can we see a recent rent roll and the last 12 months of T-12 income?
- Built in 1972 — when were the roof, HVAC, electrical panel, plumbing, and water heater last replaced?
- Is there a deadline driving the sale (1031 exchange, divorce, estate, relocation)? That informs how much negotiation room exists.
- Schools are D-rated, which usually means shorter tenancies and higher turnover. Who's the typical renter profile here, and what's been the actual vacancy rate?
- The area grade is low — what's the realistic commute time and amenity access for the typical tenant pool here? Any planned neighborhood developments (good or bad) we should know about?
- What's the average days-on-market for RENTAL listings here right now (not sales)? A rising rental-DOM trend means longer vacancies and softer asking-rent achievability than the comps imply.
- What's the recent tenant-quality profile in this submarket — average credit score on applications, eviction rate, late-payment / NSF rate, and stable-employment percentage? A property-management company in the area should have these aggregated.
- How much new for-sale + rental construction is in the pipeline within 1–3 miles? Heavy new supply typically softens prices + rents 12–24 months out; constrained supply supports both.
Investment metrics
- 1% rule
- 0.65% ✗
- Cap rate
- 5.36%
- Cash-on-cash
- -3.32%
- DSCR
- 0.85
- GRM
- 12.9
CMA / ARV
No comps found within radius.
Projected returns pro-forma
3.0% appreciation · 3.0% rent growth · sell at horizon
- IRR
- 4.4%
- Equity multiple
- 1.25×
- Total profit
- $23,228
- Equity at exit
- $147,933
- IRR
- 7.5%
- Equity multiple
- 2.14×
- Total profit
- $105,246
- Equity at exit
- $227,982
Cash invested: $92,120 (down + closing). Projections, not guarantees.
Landlord ↔ Tenant lean methodology
- Overall (STATE)
- 91 Strongly Landlord-Friendly
- State Idaho
- 91 Strongly Landlord-Friendly · R+18
- County
- — inherits STATE
- City
- — inherits STATE
ZIP-level market 83605-2202
- Active inventory
- 1
- Price-to-rent
- 12.9×
Monthly cashflow live
- Estimated rent
- $2,130 high interval (Pro) →
- Mortgage (P&I)
- −$1,725
- Tax from tax record
- −$75 /mo · $900/yr
- Insurance
- −$137
- HOA
- −$0
- Vacancy / Maint / Mgmt
- −$447
- Net cashflow
- $-255
Break-even live
UW: 25.0% down · 7.5% · 30yr · 1.5% tax · 5.0% vac · 8.0% maint · 8.0% mgmt
Financing live
Cash to close
- Down payment
- $82,250
- Closing costs
- $9,870
- Reserves months
- —
- Total cash needed
- —
Loan-product check · same deal, 3 products live
Conventional
25% down · 7.5% · 30yr
- Down + closing
- —
- Monthly P&I
- —
- Monthly cashflow
- —
- DSCR
- —
- Eligible?
- —
Personal DTI + credit; lowest rate.
DSCR
20% down · 8.5% · 30yr
- Down + closing
- —
- Monthly P&I
- —
- Monthly cashflow
- —
- DSCR
- —
- Eligible?
- —
No personal income docs; deal must DSCR.
Hard money
10% down · 12.0% · 12mo
- Down + closing
- —
- Monthly P&I
- —
- Monthly cashflow
- —
- DSCR
- —
- Eligible?
- —
Short-term bridge; refi at stabilization.
Rent comps 10 comps
| Address | Beds | Baths | Sqft | Rent | $/sqft | DOM | Units | Dist |
|---|---|---|---|---|---|---|---|---|
| 1412 N 1st Ave Caldwell, ID | 2.0 | 2.0 | 1000 | $1,400 | $1.40 | 3d | 1 | 0.45mi |
| 2809 Blackfoot Ln Caldwell, ID | 2.0 | 2.0 | 966 | $1,450 | $1.50 | 2d | 1 | 1.13mi |
| 2720 Blackfoot Ln Caldwell, ID | 2.0 | 2.0 | 940 | $1,425 | $1.52 | 19d | 1 | 1.15mi |
| 511 Rooster Ln Caldwell, ID | 2.0 | 2.0 | 940 | $1,450 | $1.54 | 2d | 1 | 1.21mi |
| 516 Rooster Ln Caldwell, ID | 2.0 | 2.0 | 940 | $1,450 | $1.54 | 2d | 1 | 1.21mi |
| 3809 Winged Dove St Unit 1532707P Caldwell, ID | 3.0 | 2.0 | 1571 | $3,522 | $2.24 | 14d | 1 | 1.27mi |
| 3804 Bobwhite St Unit 1460920P Caldwell, ID | 3.0 | 2.0 | 1140 | $3,847 | $3.37 | 19d | 1 | 1.34mi |
| 304 Cliff Swallow Ave Unit 1460924P Caldwell, ID | 1.0–6.0 | 1.0–4.0 | 2050 | $5,653 | $2.76 | 3d | 2 | 1.41mi |
| 216 Cliff Swallow Ave Unit 1460934P Caldwell, ID | 3.0 | 2.0 | 1227 | $3,943 | $3.21 | 2d | 1 | 1.43mi |
| 409 Hildago Way Caldwell, ID | 3.0 | 2.0 | 1447 | $1,950 | $1.35 | 11d | 1 | 1.44mi |
Listing history 7 events
-
2026-06-18days on market $329,000 Active 7 DOM
-
2026-06-17days on market $329,000 Active 6 DOM
-
2026-06-16days on market $329,000 Active 5 DOM
-
2026-06-15days on market $329,000 Active 4 DOM
-
2026-06-13days on market $329,000 Active 2 DOM
-
2026-06-13remarks 699-char remark
-
2026-06-13$329,000 Active 1 DOM
ⓘ Source: listings_history table (triggers on properties + properties_extension) + one-shot
backfill from property_details.listing_events for pre-trigger history.
Tax reassessment forecast ID · Resets to sale price
- Current annual tax
- $900 · $75/mo
- Projected year-2 tax
- $2,270 · $189/mo
- Expected delta
- +$1,370/yr (+$114/mo · 152.1%)
ⓘ Screening estimate from a state-policy table — verify with the county assessor before closing.
Climate risk First Street
- Flood 1/10 Low FEMA zone X (unshaded) · 0% chance over 30 yrs
- Wildfire 4/10 Moderate
- Heat 4/10 Moderate 7 d/yr ≥99°F today · 16 d/yr by 30 yrs out
- Wind 1/10 Low
- Air quality 7/10 Severe 11 unhealthy d/yr today · 18 by 30 yrs out
Nearby sold comps map
Loading sold comps map…
Walkable amenities ~0.75 mi
Loading nearby amenities…
Taxation est. · year 1
- Rental income
- $25,558
- − Mortgage interest
- −$18,429
- − Property taxes
- −$900
- − Insurance
- −$1,645
- − Repairs & maintenance
- −$2,045
- − Management
- −$2,045
- − Depreciation
- −$9,571
- Taxable loss
- −$9,076
- Est. tax savings @ 24.0%
- +$2,178
- After-tax cash flow
- $-880/yr
For passive investors: Depreciation is non-cash, so a rental often shows a tax loss while cash-flowing — sheltering income. Rental losses are passive: they offset passive income freely, and up to $25,000/yr can offset ordinary (W-2) income if you actively participate and your MAGI is under $100k (phasing out to $0 by $150k); unused losses carry forward. On sale, claimed depreciation is recaptured at up to 25%, and gains may owe capital-gains tax (a 1031 exchange can defer both). Figures are a year-1 estimate at your 24.0% rate — not tax advice; consult a CPA.
Schools (NCES district)
- District
- Caldwell District
- NCES district ID
- 1600510
- Math proficiency
- 17% ▼ -11.00%
- Reading proficiency
- 31% ▼ -4.00%
- Median HH income
- $36,116
- Composite
- 19.85/100
- National rank
- #8694
- State rank
- #90 of 92 in ID
Livability — Caldwell
- Score
- 67/100
- State rank
- #88
- US rank
- #10145
Category grades
Schools grade is shown separately in the Schools card above.
Census & demographics
- Census place
- Caldwell, ID
Population outlook (Canyon County) Hauer SSP2
- Today (2025)
- 248,853 people
- By 2030
- 269,596 · +8.3%
- By 2040
- 311,081 · +25.0%
- By 2050
- 350,809 · +41.0%
- By 2075
- 441,884 · +77.6%
- By 2100
- 505,641 · +103.2%
Not yet ingested
- Political lean
- —
- Race & ethnicity
- —
- Common origin
- —
- Civics
- —
Market trends
- HPI YoY
- —
- Current HPI
- —
- Rent YoY
- —
- Metro
- —
- State GDP YoY
- ▲ 4.51%
- F500 in state
- 6
Industry mix (Fortune 500 HQ in ID)
| Industry | F500 HQs | Revenue |
|---|---|---|
| Retail | 1 | $79B |
|
||
| Technology | 1 | $25B |
|
||
| Food / Agriculture | 1 | $6B |
|
||
Price history
+603.0% since first listed6 events — show timeline
- 2026-06-11 Listed $329,000 IMLS
- 2020-10-01 Sold (Public Records) — Public Records
- 2020-09-11 Pending — IMLS
- 2020-09-10 Listed $209,990 IMLS
- 2004-02-24 Sold (Public Records) — Public Records
- 2003-10-09 Listed $46,800 IMLS
Property tax history
+1.0%/yrLatest (2025): $900 · +13.4% YoY. Source: county tax records.
Cash-flow waterfall
monthlySold comps — $/sqft
last 12 mo · ≤1 miLoading sold comps…