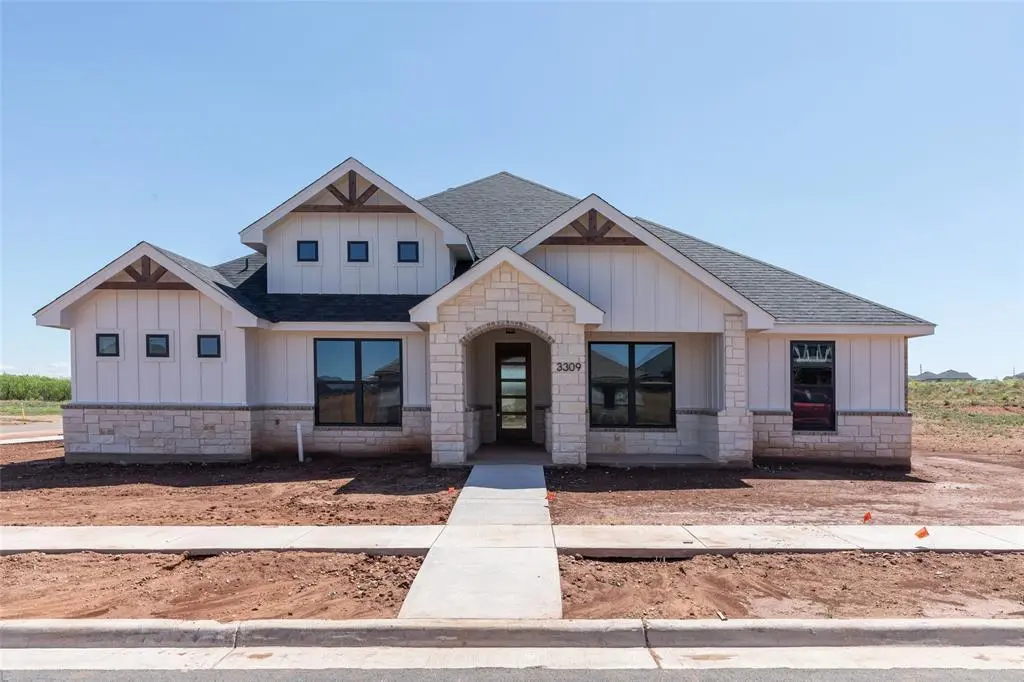
3309 Birdie Ln · Abilene, TX
Flood risk 1/10 · Minimal
- FEMA flood zone
- X (unshaded)
- Chance of flooding over 30 yrs
- 0.0%
- Est. flood insurance / yr
- $507 – $1,088
Fire risk 9/10 · Severe
- Est. fire insurance / yr
- $1,222 – $2,270
Heat risk 6/10 · Moderate
- Hot days now (above 103°F)
- 7 days/yr
- Hot days in 30 yrs
- 23 days/yr
Wind risk 4/10 · Minor
- Chance of severe wind over 30 yrs
- 17.0%
Air-quality risk 1/10 · Minimal
- Unhealthy air days now
- 0 days/yr
- Unhealthy air days in 30 yrs
- 0 days/yr
Risk factors via First Street. Map © Google.
Why this score? — see what drove the D- grade
The composite is a weighted blend of 9 inputs, each scored 0–100. Each bar is that input's sub-score; the figure is the points it added to the 100-point composite (weight × sub-score).
- Cash flow +9.7/30.0
- ARV discount +5.9/15.0
- Schools +5.6/10.0
- Rent growth +5.0/5.0
- Livability +3.8/5.0
- 1% rule +3.1/10.0
- DSCR +2.8/10.0
- Condition / age +2.5/5.0
- Appreciation +0.0/10.0
$499,900
🖨 Deal sheet (PDF) 📄 Offer letter ✓ Due diligence
Listing remarks
Owner Agent. Want a minute golf cart drive to the golf course? Discover the epitome of luxury living with our stunning 4-bedroom, 2.5-bathroom plus office nestled on a prime corner lot! Embrace tranquility as you step into the spacious living area, adorned with natural light cascading through large windows, creating a warm and inviting ambiance. Entertain with ease in the gourmet kitchen, complete with sleek countertops, modern appliances, and ample cabinet space. Retreat to the expansive master suite, featuring a private en-suite bathroom and a walk-in closet fit for a fashionista. Need space for your vehicles and more? Look no further! Our home comes with a rare 3-car garage, providing p
Key facts
- Gourmet kitchen
- Corner lot
- 0.24 acre lot
Tags
Neighborhood map
What this means for you Summary
Snapshot
- This is a 4-bed/2.5-bath single-family listed at $500k.
Deal economics
- At list price, monthly cash flow is $-325 ($-4k/yr) — negative.
- To cash-flow at today's rent, offer at most $453k (9.4% below list).
- To meet the 1% rule (rent ≥ 1% of price), the offer needs to be $403k (19.4% below list).
- Recommended offer: $403k (19.4% below list) — sets the bar for 1% rule.
Location & tenants
- Location reads 75/100 on livability (#142 in TX, #4,037 nationally) — a middle-class / working-renter tenant base. Strengths: cost of living A+, housing A+, health & safety A+; Watch: crime D, commute F.
- Wylie ISD (rural): math 63% / reading 62% proficiency, ranked #32 of 826 in TX (top 4%) — acceptable for families but not a draw, mixed tenant base, ~2y average lease; only 17% free/reduced lunch — higher-income household profile.
- Zoned schools: Wylie West El (428 students, 21% FRL); Wylie West J H (math 62% / reading 58%, grade B, #158 of 1,662 statewide, top 10%, 972 students, 24% FRL); Wylie H S (math 60% / reading 76%, grade B, #150 of 1,632 statewide, top 10%, 1,467 students, 18% FRL) — zoned schools at 21% FRL track the district average.
- Market conditions: Rents rising fast (+40.7%/yr); 294 active listings in the ZIP; 10 comparable units currently listed for rent nearby; rentals leasing fast (median 9d on market — plan ~1-2 weeks tenant-placement turnaround); solid renter incomes; 508 units permitted in Taylor County in 2024 (0 in 5+ unit buildings).
- At $4,029/mo this rent would consume 61% of the median local household income ($79k/yr) (locally 1181% of renters already pay >50% of income on rent) — very limited rent-growth headroom before tenants either downsize or default.
Forward outlook
- Local home prices are declining (-3.0%/yr); year-one equity from $3k of loan paydown is wiped out by about $15k of value loss. Plan a longer hold.
- Taylor County population projected at +16% by 2050 — long-run rental-demand tailwind backs the buy-and-hold thesis.
Negotiation context
- It's been on market 17 days — a 2% lower offer ($492k) is reasonable based on typical stale-listing flexibility.
- 3 sale attempts with the ask held roughly flat each time — persistent listings suggest the price (not the market) is what's stuck; bring a comps-based counter.
Risks & watch-outs
- Climate carrying-cost: severe wildfire risk; extreme-heat days projected 7→23/yr by 2055 (HVAC capex compounding) — expect insurance premiums to compound above CPI over the hold.
Questions for the listing agent
- What do current leases actually rent for vs. the listed asking? Can we see a recent rent roll and the last 12 months of T-12 income?
- What does the HOA fee cover, when was the last increase, and are there any pending special assessments or reserve-fund shortfalls?
- Is there a deadline driving the sale (1031 exchange, divorce, estate, relocation)? That informs how much negotiation room exists.
- Schools are D-rated, which usually means shorter tenancies and higher turnover. Who's the typical renter profile here, and what's been the actual vacancy rate?
- Crime grade is D in this area — have there been break-ins, vandalism, or insurance claims at this property in the last 3 years? What carrier currently insures it and at what premium?
- The area grade is low — what's the realistic commute time and amenity access for the typical tenant pool here? Any planned neighborhood developments (good or bad) we should know about?
- What's the average days-on-market for RENTAL listings here right now (not sales)? A rising rental-DOM trend means longer vacancies and softer asking-rent achievability than the comps imply.
- What's the recent tenant-quality profile in this submarket — average credit score on applications, eviction rate, late-payment / NSF rate, and stable-employment percentage? A property-management company in the area should have these aggregated.
- How much new for-sale + rental construction is in the pipeline within 1–3 miles? Heavy new supply typically softens prices + rents 12–24 months out; constrained supply supports both.
Investment metrics
- 1% rule
- 0.81% ✗
- Cap rate
- 5.51%
- Cash-on-cash
- -2.79%
- DSCR
- 0.88
- GRM
- 10.3
CMA / ARV
- ARV (on-the-fly)
- $482,922
- Comps found
- 12
Show comp detail 12 sales within ~0.75 mi
| Address | Dist | Beds/Ba | Sqft | Sold | Price | $/sf | Match |
|---|---|---|---|---|---|---|---|
| 3309 Birdie Ln | 0.00mi | 4/2.5 | 2,439 (0%) | 1mo | $499,900 | $205 | 99 |
| 3326 Birdie | 0.05mi | 4/3.0 | 2,481 (+2%) | 0mo | $508,000 | $205 | 92 |
| 3418 Ace | 0.19mi | 4/2.5 | 2,420 (-1%) | 0mo | $465,000 | $192 | 90 |
| 6625 Tin Cup Dr | 0.02mi | 4/2.5 | 2,278 (-7%) | 0mo | $469,900 | $206 | 88 |
| 3318 Birdie | 0.04mi | 4/3.0 | 2,288 (-6%) | 1mo | $469,000 | $205 | 85 |
| 3418 Double Eagle Ln | 0.23mi | 4/3.0 | 2,350 (-4%) | 1mo | $465,000 | $198 | 80 |
| 6433 Tin Cup | 0.14mi | 3/2.0 (-1) | 2,350 (-4%) | 1mo | $479,000 | $204 | 80 |
| 37 Pinehurst St | 0.61mi | 4/2.0 | 2,433 (-0%) | 2mo | $375,000 | $154 | 68 |
| 6410 Glen Abbey | 0.25mi | 4/2.0 | 2,159 (-12%) | 3mo | $415,000 | $192 | 64 |
| 6134 Laurel Ct | 0.53mi | 3/2.5 (-1) | 2,532 (+4%) | 2mo | $305,150 | $121 | 62 |
| 13 Winners Cir | 0.46mi | 3/2.0 (-1) | 2,224 (-9%) | 3mo | $339,900 | $153 | 54 |
| 29 Pebble Bch | 0.62mi | 3/2.0 (-1) | 2,270 (-7%) | 1mo | $320,000 | $141 | 52 |
Match score weights: distance 35% · size 25% · config 20% · recency 20%. Top-matched comps best support the ARV.
Projected returns pro-forma
-3.0% appreciation · 8.0% rent growth · sell at horizon
- IRR
- -15.4%
- Equity multiple
- 0.43×
- Total profit
- $-80,317
- Equity at exit
- $74,537
- IRR
- 0.1%
- Equity multiple
- 1.00×
- Total profit
- $697
- Equity at exit
- $43,222
Cash invested: $139,972 (down + closing). Projections, not guarantees.
Landlord ↔ Tenant lean methodology
- Overall (STATE)
- 87 Strongly Landlord-Friendly
- State Texas
- 87 Strongly Landlord-Friendly · R+5
- County
- — inherits STATE
- City
- — inherits STATE
ZIP-level market 79606
- Rents YoY
- 40.7%
- Active inventory
- 294
- Price-to-rent
- 10.3×
Monthly cashflow live
- Estimated rent
- $4,029 high interval (Pro) →
- Mortgage (P&I)
- −$2,622
- Tax est. 1.5%
- −$625 /mo · $7,498/yr
- Insurance
- −$208
- HOA
- −$53
- Vacancy / Maint / Mgmt
- −$846
- Net cashflow
- $-325
Break-even live
Sensitivity live
| Price | -10% $21 | -5% $-152 | +0% $-325 | +5% $-498 | +10% $-670 |
|---|---|---|---|---|---|
| Rent | -10% $-643 | -5% $-484 | +0% $-325 | +5% $-166 | +10% $-7 |
| Rate | -1.0pp $-73 | -0.5pp $-198 | base $-325 | +0.5pp $-454 | +1.0pp $-586 |
UW: 25.0% down · 7.5% · 30yr · 1.5% tax · 5.0% vac · 8.0% maint · 8.0% mgmt
Financing live
Cash to close
- Down payment
- $124,975
- Closing costs
- $14,997
- Reserves months
- —
- Total cash needed
- —
Loan-product check · same deal, 3 products live
Conventional
25% down · 7.5% · 30yr
- Down + closing
- —
- Monthly P&I
- —
- Monthly cashflow
- —
- DSCR
- —
- Eligible?
- —
Personal DTI + credit; lowest rate.
DSCR
20% down · 8.5% · 30yr
- Down + closing
- —
- Monthly P&I
- —
- Monthly cashflow
- —
- DSCR
- —
- Eligible?
- —
No personal income docs; deal must DSCR.
Hard money
10% down · 12.0% · 12mo
- Down + closing
- —
- Monthly P&I
- —
- Monthly cashflow
- —
- DSCR
- —
- Eligible?
- —
Short-term bridge; refi at stabilization.
Rent comps 10 comps
| Address | Beds | Baths | Sqft | Rent | $/sqft | DOM | Units | Dist |
|---|---|---|---|---|---|---|---|---|
| 6901 Glen Abbey St Abilene, TX | 4.0 | 2.0 | 1648 | $3,795 | $2.30 | 23d | 1 | 0.24mi |
| 7061 Tin Cup Dr Abilene, TX | 4.0 | 2.0 | 1648 | $3,495 | $2.12 | 13d | 1 | 0.39mi |
| 3726 Pensacola Dr Abilene, TX | 4.0 | 2.5 | 2126 | $7,000 | $3.29 | 1d | 1 | 0.44mi |
| 3626 Yamini Dr Abilene, TX | 4.0 | 2.0 | 1788 | $2,799 | $1.57 | 23d | 1 | 0.45mi |
| 5733 Legacy Dr Abilene, TX | 3.0 | 2.0 | 1843 | $5,000 | $2.71 | 6d | 1 | 1.16mi |
| 7534 John Carroll Dr Abilene, TX | 4.0 | 2.0 | 1984 | $2,795 | $1.41 | 5d | 1 | 1.18mi |
| 5400 Ridgeline Dr Abilene, TX | 3.0 | 2.0 | 2571 | $6,000 | $2.33 | 26d | 1 | 1.19mi |
| 6609 Summerwood Trl Abilene, TX | 4.0 | 2.0 | 1851 | $3,195 | $1.73 | 7d | 1 | 1.22mi |
| 8345 South Rdg Abilene, TX | 4.0 | 2.5 | 2300 | $4,000 | $1.74 | 9d | 1 | 1.28mi |
| 4742 Kevin Ct Abilene, TX | 3.0 | 2.0 | 1630 | $3,400 | $2.09 | 7d | 1 | 1.47mi |
HOA detail
- Monthly dues
- $53 · $636/yr
Listing history 6 events
-
2026-04-26status Pending
-
2026-04-09$499,900 Active
-
2026-04-08historical
-
2026-01-09$499,900 Active
-
2026-01-08historical
-
2025-12-01$499,900 Active
ⓘ Source: listings_history table (triggers on properties + properties_extension) + one-shot
backfill from property_details.listing_events for pre-trigger history.
Climate risk First Street
- Flood 1/10 Low FEMA zone X (unshaded) · 0% chance over 30 yrs
- Wildfire 9/10 Extreme
- Heat 6/10 Major 7 d/yr ≥103°F today · 23 d/yr by 30 yrs out
- Wind 4/10 Moderate 17% chance of damaging wind over 30 yrs
- Air quality 1/10 Low 0 unhealthy d/yr today · 0 by 30 yrs out
Nearby sold comps map
Loading sold comps map…
Walkable amenities ~0.75 mi
Loading nearby amenities…
Taxation est. · year 1
- Rental income
- $48,346
- − Mortgage interest
- −$28,002
- − Property taxes
- −$7,498
- − Insurance
- −$2,500
- − Repairs & maintenance
- −$3,868
- − Management
- −$3,868
- − HOA
- −$636
- − Depreciation
- −$14,543
- Taxable loss
- −$12,568
- Est. tax savings @ 24.0%
- +$3,016
- After-tax cash flow
- $-883/yr
For passive investors: Depreciation is non-cash, so a rental often shows a tax loss while cash-flowing — sheltering income. Rental losses are passive: they offset passive income freely, and up to $25,000/yr can offset ordinary (W-2) income if you actively participate and your MAGI is under $100k (phasing out to $0 by $150k); unused losses carry forward. On sale, claimed depreciation is recaptured at up to 25%, and gains may owe capital-gains tax (a 1031 exchange can defer both). Figures are a year-1 estimate at your 24.0% rate — not tax advice; consult a CPA.
Schools (NCES district)
- District
- Wylie ISD
- NCES district ID
- 4846500
- Math proficiency
- 63% ▼ -12.00%
- Reading proficiency
- 62% ▼ -4.00%
- Median HH income
- $78,248
- Composite
- 55.86/100
- National rank
- #1206
- State rank
- #32 of 826 in TX
Livability — Abilene
- Score
- 75/100
- State rank
- #142
- US rank
- #4037
Category grades
Schools grade is shown separately in the Schools card above.
Census & demographics
- Census place
- Abilene, TX
- County
- Taylor County · 136,672 people
- City population
- 136,672
- Metro
- Abilene, TX
- Population (ZIP)
- 29,182
- Household income
- $79,196
- Rent vs Own
- Severe rent burden
- 1181.0
Population outlook (Taylor County) Hauer SSP2
- Today (2025)
- 145,270 people
- By 2030
- 150,050 · +3.3%
- By 2040
- 159,417 · +9.7%
- By 2050
- 168,883 · +16.3%
- By 2075
- 194,436 · +33.8%
- By 2100
- 203,163 · +39.9%
Race, ethnicity, and origin ACS 2023
- Neighborhood character
- Predominantly White (69%)
- Race & ethnicity
- White 69% Hispanic / Latino 19% Two or more races 11% Black 6% Asian 4%
- Hispanic origin (detail)
- Mexican 14%
- Common ancestry
- Italian 4% Slovak 2% Serbian 1%
- Foreign-born
- 7% · Canada, Vietnam
- Languages at home
- 86% English-only · Spanish 10% Tagalog/Filipino 1% Other Indo-European 1%
Political lean MEDSL · Taylor
- 2024 margin
- Solid R (+49.8) · D 24.6% · R 74.4% · Other 1.0%
- 2008→2024 swing
- -4.2pp toward R · 2008: -45.6pp · 2024: -49.8pp
- All cycles
- 2024: R+49.8 2020: R+45.3 2016: R+51.1 2012: R+53.6 2008: R+45.6
Not yet ingested
- Civics
- —
Market trends
- HPI YoY
- ▼ -167.33%
- Current HPI
- 179.2555
- Rent YoY
- ▲ 40.73%
- Metro
- Abilene, TX
- State GDP YoY
- ▲ 3.95%
- F500 in state
- 110
Industry mix (Fortune 500 HQ in TX)
| Industry | F500 HQs | Revenue |
|---|---|---|
| Energy | 16 | $1,198B |
|
||
| Technology | 5 | $198B |
|
||
| Engineering / Construction | 4 | $72B |
|
||
| Energy Services | 3 | $60B |
|
||
| Utilities | 3 | $41B |
|
||
| Healthcare | 2 | $330B |
|
||
Price history
+0.0% since first listed6 events — show timeline
- 2026-04-26 Pending — NTREIS
- 2026-04-09 Listed $499,900 NTREIS
- 2026-04-08 Listing Removed — NTREIS
- 2026-01-09 Listed $499,900 NTREIS
- 2026-01-08 Listing Removed — NTREIS
- 2025-12-01 Listed $499,900 NTREIS
Cash-flow waterfall
monthlySold comps — $/sqft
last 12 mo · ≤1 miLoading sold comps…