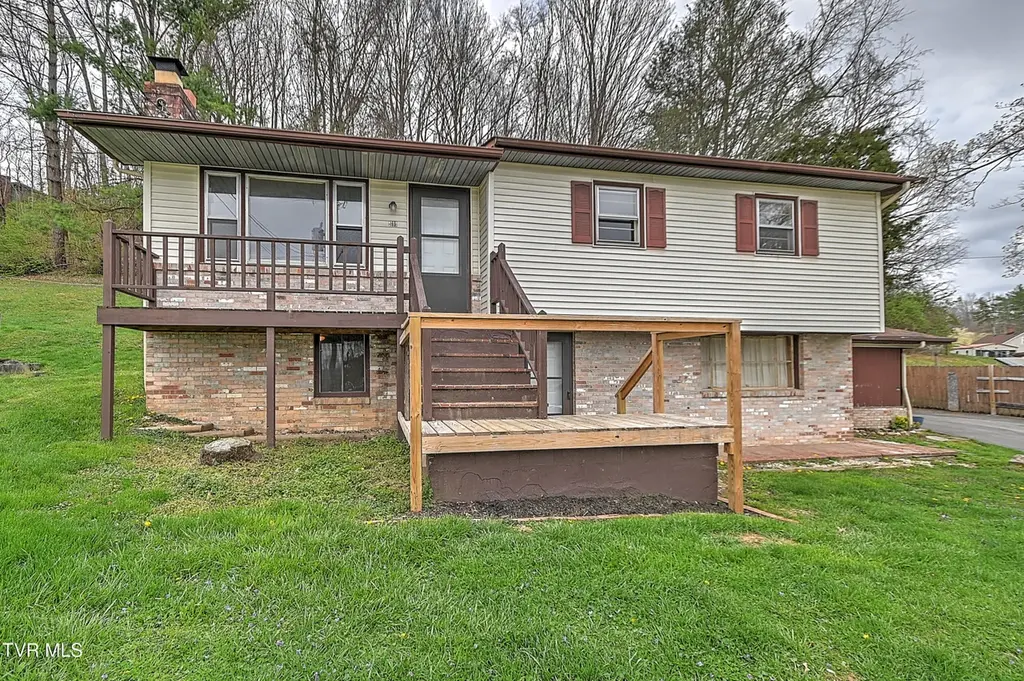
169 Denton Ln · Bristol, VA
Flood risk 1/10 · Minimal
- FEMA flood zone
- X (unshaded)
- Chance of flooding over 30 yrs
- 0.0%
- Est. flood insurance / yr
- $507 – $1,088
Fire risk 4/10 · Minor
- Est. fire insurance / yr
- $666 – $1,236
Heat risk 4/10 · Minor
- Hot days now (above 97°F)
- 7 days/yr
- Hot days in 30 yrs
- 22 days/yr
Wind risk 2/10 · Minimal
- Chance of severe wind over 30 yrs
- —
Air-quality risk 2/10 · Minimal
- Unhealthy air days now
- 1 days/yr
- Unhealthy air days in 30 yrs
- 2 days/yr
Risk factors via First Street. Map © Google.
Why this score? — see what drove the D grade
The composite is a weighted blend of 9 inputs, each scored 0–100. Each bar is that input's sub-score; the figure is the points it added to the 100-point composite (weight × sub-score).
- Cash flow +15.1/30.0
- ARV discount +7.6/15.0
- Schools +5.2/10.0
- DSCR +4.6/10.0
- Livability +3.7/5.0
- 1% rule +3.0/10.0
- Rent growth +2.5/5.0
- Condition / age +2.5/5.0
- Appreciation +0.0/10.0
$219,000
🖨 Deal sheet (PDF) 📄 Offer letter ✓ Due diligence
Listing remarks
Welcome to 169 Denton Lane in beautiful Bristol! This inviting 4 bedroom, 2 full bath home offers approximately 2,086 total square feet of comfortable living space, perfectly designed for everyday living and entertaining. Step inside to find a spacious layout filled with natural light, creating a warm and welcoming atmosphere throughout. With multiple living areas, there's plenty of room to relax, host guests, or create the perfect work-from-home setup. Enjoy the best of indoor and outdoor living with both open and enclosed porch spaces - ideal for morning coffee, evening relaxation, or year round enjoyment . The attached carport adds convenience and protection, while the property provides
Key facts
- Attached carport
- Minutes from dining
- 9,148 sq ft lot
Tags
Property features AI
Exterior
- Parking: Attached garage (1 car); Carport
- Utilities: Public water; Public sewer
- Home design: Single-family residence; Two levels
- Construction: Brick and vinyl siding exterior; Shingle roof; Finished below-grade area
- Exterior features: Cul-de-sac lot; Wooded lot
Interior
- Kitchen: Refrigerator
- Flooring: Carpet; Vinyl; Wood
- Bathrooms: 2 full bathrooms
- Heating & cooling: Baseboard heating; Attic fan; Ceiling fan(s); Wall/window unit(s)
- Interior features: Fireplace (3 total); Basement
Neighborhood map
What this means for you Summary
Snapshot
- This is a 3-bed/2.0-bath single-family listed at $219k.
Deal economics
- At list price, monthly cash flow is $72 ($867/yr) — positive.
- The deal already cash-flows at list — no discount required.
- To meet the 1% rule (rent ≥ 1% of price), the offer needs to be $175k (20.3% below list).
- Recommended offer: $175k (20.3% below list) — sets the bar for 1% rule.
- Cap rate 6.7% vs local median 4.9% in Bristol — top-decile yield for the area; either an underpriced asset or a hidden risk that comps aren't pricing in. Stress-test before assuming the spread holds.
Location & tenants
- Location reads 74/100 on livability (#140 in VA, #4,544 nationally) — a middle-class / working-renter tenant base. Strengths: cost of living A+, housing A+, health & safety A+; Watch: crime F, commute F, employment F.
- Bristol City Public School District (urban): math 57% / reading 70% proficiency, ranked #53 of 131 in VA (top 40%) — acceptable for families but not a draw, mixed tenant base, ~2y average lease.
- Zoned schools: Stonewall Jackson Elementary (math 47% / reading 67%, grade C+, #597 of 1,108 statewide, top 57%, 254 students, 102% FRL); Virginia Middle (math 56% / reading 71%, grade B+, #128 of 342 statewide, top 39%, 487 students, 101% FRL); Virginia High (math 62% / reading 77%, grade B, #159 of 319 statewide, top 53%, 637 students, 100% FRL) — zoned schools average 101% FRL vs 58% district-wide (43 pts higher); higher-poverty schools than district average — tighter screening recommended.
- Market conditions: 157 active listings in the ZIP; 8 comparable units currently listed for rent nearby; rentals at typical pace (median 15d on market — plan ~3-4 weeks tenant-placement turnaround); 15 units permitted in Bristol city in 2024 (5 in 5+ unit buildings).
Forward outlook
- Local home prices are declining (-3.0%/yr); year-one equity from $2k of loan paydown is wiped out by about $7k of value loss. Plan a longer hold.
- Bristol County population projected at -20% by 2050 — secular population decline; favor cash flow + early exit over multi-decade hold.
Negotiation context
- It's been on market 41 days — a 3% lower offer ($212k) is reasonable based on typical stale-listing flexibility.
Questions for the listing agent
- It's been on market 41 days. Have you received any prior offers? Is the seller open to a 20% concession, seller financing, or rate buy-down credit?
- Built in 1966 — when were the roof, HVAC, electrical panel, plumbing, and water heater last replaced?
- Is there a deadline driving the sale (1031 exchange, divorce, estate, relocation)? That informs how much negotiation room exists.
- Schools are A-rated — typically a magnet for longer-tenancy family renters. What's the average tenant stay here, and is there a school-zone premium baked into asking?
- Crime grade is F in this area — have there been break-ins, vandalism, or insurance claims at this property in the last 3 years? What carrier currently insures it and at what premium?
- The area grade is low — what's the realistic commute time and amenity access for the typical tenant pool here? Any planned neighborhood developments (good or bad) we should know about?
- What's the average days-on-market for RENTAL listings here right now (not sales)? A rising rental-DOM trend means longer vacancies and softer asking-rent achievability than the comps imply.
- What's the recent tenant-quality profile in this submarket — average credit score on applications, eviction rate, late-payment / NSF rate, and stable-employment percentage? A property-management company in the area should have these aggregated.
- How much new for-sale + rental construction is in the pipeline within 1–3 miles? Heavy new supply typically softens prices + rents 12–24 months out; constrained supply supports both.
Investment metrics
- 1% rule
- 0.80% ✗
- Cap rate
- 6.69%
- Cash-on-cash
- 1.41%
- DSCR
- 1.06
- GRM
- 10.5
CMA / ARV
- ARV (median comp)
- $219,654
- List price
- $219,000
- Delta
- -2.12%
- Verdict
- FAIR
- Comps
- 20 within 1.0 mi
Show comp detail 6 sales within ~0.75 mi
| Address | Dist | Beds/Ba | Sqft | Sold | Price | $/sf | Match |
|---|---|---|---|---|---|---|---|
| 543 Ventura Cir | 0.12mi | 3/1.0 | 1,462 (-4%) | 16mo | $216,000 | $148 | 72 |
| 664 Page St | 0.57mi | 3/1.0 | 1,446 (-5%) | 0mo | $168,500 | $117 | 61 |
| 1225 Bristol View Dr | 0.51mi | 4/2.0 (+1) | 1,501 (-1%) | 11mo | $280,000 | $187 | 60 |
| 332 Randolph St | 0.45mi | 3/2.0 | 1,342 (-12%) | 1mo | $215,000 | $160 | 59 |
| 160 Gouge St St | 0.43mi | 3/1.5 | 1,725 (+14%) | 6mo | $207,000 | $120 | 50 |
| 351 Hill Park Dr | 0.38mi | 3/1.0 | 1,316 (-13%) | 21mo | $145,000 | $110 | 39 |
Match score weights: distance 35% · size 25% · config 20% · recency 20%. Top-matched comps best support the ARV.
Projected returns pro-forma
-3.0% appreciation · 3.0% rent growth · sell at horizon
- IRR
- -14.1%
- Equity multiple
- 0.49×
- Total profit
- $-30,986
- Equity at exit
- $32,654
- IRR
- -5.4%
- Equity multiple
- 0.65×
- Total profit
- $-21,464
- Equity at exit
- $18,935
Cash invested: $61,320 (down + closing). Projections, not guarantees.
Landlord ↔ Tenant lean methodology
- Overall (STATE)
- 55 Moderately Landlord-Leaning
- State Virginia
- 55 Moderately Landlord-Leaning · D+2
- County
- — inherits STATE
- City
- — inherits STATE
ZIP-level market 24201
- Active inventory
- 157
- Price-to-rent
- 10.5×
Monthly cashflow live
- Estimated rent
- $1,746 high interval (Pro) →
- Mortgage (P&I)
- −$1,148
- Tax from tax record
- −$67 /mo · $807/yr
- Insurance
- −$91
- HOA
- −$0
- Vacancy / Maint / Mgmt
- −$367
- Net cashflow
- $72
Break-even live
Sensitivity live
| Price | -10% $196 | -5% $134 | +0% $72 | +5% $10 | +10% $-52 |
|---|---|---|---|---|---|
| Rent | -10% $-66 | -5% $3 | +0% $72 | +5% $141 | +10% $210 |
| Rate | -1.0pp $183 | -0.5pp $128 | base $72 | +0.5pp $16 | +1.0pp $-42 |
UW: 25.0% down · 7.5% · 30yr · 1.5% tax · 5.0% vac · 8.0% maint · 8.0% mgmt
Financing live
Cash to close
- Down payment
- $54,750
- Closing costs
- $6,570
- Reserves months
- —
- Total cash needed
- —
Loan-product check · same deal, 3 products live
Conventional
25% down · 7.5% · 30yr
- Down + closing
- —
- Monthly P&I
- —
- Monthly cashflow
- —
- DSCR
- —
- Eligible?
- —
Personal DTI + credit; lowest rate.
DSCR
20% down · 8.5% · 30yr
- Down + closing
- —
- Monthly P&I
- —
- Monthly cashflow
- —
- DSCR
- —
- Eligible?
- —
No personal income docs; deal must DSCR.
Hard money
10% down · 12.0% · 12mo
- Down + closing
- —
- Monthly P&I
- —
- Monthly cashflow
- —
- DSCR
- —
- Eligible?
- —
Short-term bridge; refi at stabilization.
Rent comps 8 comps
| Address | Beds | Baths | Sqft | Rent | $/sqft | DOM | Units | Dist |
|---|---|---|---|---|---|---|---|---|
| 203 Opal Ln Unit 4 Bristol, VA | 2.0 | 1.5 | 1200 | $1,500 | $1.25 | 22d | 1 | 0.25mi |
| 1156 Bristol View Dr Bristol, VA | 2.0 | 2.5 | 1152 | $1,650 | $1.43 | 15d | 2 | 0.38mi |
| 2510 Catherine St Bristol, VA | 3.0 | 2.0 | 1418 | $2,500 | $1.76 | 15d | 1 | 0.91mi |
| 1405 Newton St Bristol, VA | 3.0 | 1.0 | 1200 | $1,600 | $1.33 | 15d | 1 | 0.97mi |
| 1216 Norway St Unit 102 Bristol, VA | 2.0 | 1.0 | 1215 | $1,600 | $1.32 | 15d | 1 | 1.00mi |
| 1216 Norway St Unit 101 Bristol, VA | 4.0 | 2.0 | 1615 | $2,100 | $1.30 | 15d | 1 | 1.00mi |
| 145 Midway St Unit 1397968P Bristol, VA | 3.0 | 2.0 | 1388 | $5,335 | $3.84 | 22d | 1 | 1.08mi |
| 1718 Clifton Rd Bristol, TN | 3.0 | 1.5 | 1672 | $1,900 | $1.14 | 45d | 1 | 1.39mi |
Listing history 22 events
-
2026-06-22days on market $219,000 Active 41 DOM
-
2026-06-19days on market $219,000 Active 39 DOM
-
2026-06-18days on market $219,000 Active 38 DOM
-
2026-06-17days on market $219,000 Active 37 DOM
-
2026-06-16days on market $219,000 Active 36 DOM
-
2026-06-15pricedays on market $219,000 Active 35 DOM
-
2026-06-14days on market $214,995 Active 74 DOM
-
2026-06-13days on market $214,995 Active 73 DOM
-
2026-06-10days on market $214,995 Active 71 DOM
-
2026-06-09days on market $214,995 Active 70 DOM
-
2026-06-08days on market $214,995 Active 69 DOM
-
2026-06-07days on market $214,995 Active 68 DOM
-
2026-06-03days on market $214,995 Active 64 DOM
-
2026-06-02days on market $214,995 Active 63 DOM
-
2026-06-01days on market $214,995 Active 62 DOM
-
2026-05-31days on market $214,995 Active 61 DOM
-
2026-05-30days on market $214,995 Active 60 DOM
-
2026-05-15price $214,995 1493-char remark
-
2026-05-11price $219,000 1301-char remark
-
2026-04-19price $219,000 1493-char remark
-
2026-03-31$229,995 Active 1493-char remark
-
2026-03-31$229,995 Active 1301-char remark
ⓘ Source: listings_history table (triggers on properties + properties_extension) + one-shot
backfill from property_details.listing_events for pre-trigger history.
Tax reassessment forecast VA · Resets to sale price
- Current annual tax
- $807 · $67/mo
- Projected year-2 tax
- $1,796 · $150/mo
- Expected delta
- +$989/yr (+$82/mo · 122.7%)
ⓘ Screening estimate from a state-policy table — verify with the county assessor before closing.
Climate risk First Street
- Flood 1/10 Low FEMA zone X (unshaded) · 0% chance over 30 yrs
- Wildfire 4/10 Moderate
- Heat 4/10 Moderate 7 d/yr ≥97°F today · 22 d/yr by 30 yrs out
- Wind 2/10 Low
- Air quality 2/10 Low 1 unhealthy d/yr today · 2 by 30 yrs out
Nearby sold comps map
Loading sold comps map…
Walkable amenities ~0.75 mi
Loading nearby amenities…
Taxation est. · year 1
- Rental income
- $20,950
- − Mortgage interest
- −$12,267
- − Property taxes
- −$807
- − Insurance
- −$1,095
- − Repairs & maintenance
- −$1,676
- − Management
- −$1,676
- − Depreciation
- −$6,371
- Taxable loss
- −$2,942
- Est. tax savings @ 24.0%
- +$706
- After-tax cash flow
- $1,573/yr
For passive investors: Depreciation is non-cash, so a rental often shows a tax loss while cash-flowing — sheltering income. Rental losses are passive: they offset passive income freely, and up to $25,000/yr can offset ordinary (W-2) income if you actively participate and your MAGI is under $100k (phasing out to $0 by $150k); unused losses carry forward. On sale, claimed depreciation is recaptured at up to 25%, and gains may owe capital-gains tax (a 1031 exchange can defer both). Figures are a year-1 estimate at your 24.0% rate — not tax advice; consult a CPA.
Schools (NCES district)
- District
- Bristol City Public School District
- NCES district ID
- 5100450
- Math proficiency
- 57% ▼ -24.00%
- Reading proficiency
- 70% ▼ -6.00%
- Median HH income
- $33,978
- Composite
- 52.4/100
- National rank
- #1579
- State rank
- #53 of 131 in VA
Livability — Bristol
- Score
- 74/100
- State rank
- #140
- US rank
- #4544
Category grades
Schools grade is shown separately in the Schools card above.
Census & demographics
- Census place
- Bristol, VA
- City population
- 16,039
- Population (ZIP)
- 16,039
Population outlook (Bristol County) Hauer SSP2
- Today (2025)
- 16,113 people
- By 2030
- 15,510 · -3.7%
- By 2040
- 14,121 · -12.4%
- By 2050
- 12,847 · -20.3%
- By 2075
- 9,870 · -38.7%
- By 2100
- 7,883 · -51.1%
Race, ethnicity, and origin ACS 2023
- Neighborhood character
- Predominantly White (85%)
- Race & ethnicity
- White 85% Black 7% Two or more races 6% Hispanic / Latino 3%
- Common ancestry
- Slovak 4% Serbian 1% Iranian 0%
- Foreign-born
- 1% · Canada
- Languages at home
- 98% English-only · Spanish 2%
Political lean MEDSL · Bristol
- 2024 margin
- Solid R (+39.7) · D 29.8% · R 69.5%
- 2008→2024 swing
- -13.6pp toward R · 2008: -26.0pp · 2024: -39.7pp
- All cycles
- 2024: R+39.7 2020: R+38.9 2016: R+43.8 2012: R+31.1 2008: R+26.0
Not yet ingested
- Civics
- —
Market trends
- HPI YoY
- ▼ -206.40%
- Current HPI
- 196.2099
- Rent YoY
- —
- Metro
- —
- State GDP YoY
- ▲ 2.40%
- F500 in state
- 50
Industry mix (Fortune 500 HQ in VA)
| Industry | F500 HQs | Revenue |
|---|---|---|
| Aerospace / Defense | 4 | $236B |
|
||
| Technology / Defense | 3 | $32B |
|
||
| Financial Services | 2 | $176B |
|
||
| Utilities | 2 | $27B |
|
||
| Insurance | 2 | $25B |
|
||
| Technology | 2 | $15B |
|
||
Price history
-6.5% since first listed4 events — show timeline
- 2026-05-15 Price Changed $214,995 TVRMLS
- 2026-05-11 Price Changed $219,000 SWVAR
- 2026-04-19 Price Changed $219,000 TVRMLS
- 2026-03-31 Listed $229,995 SWVAR
Cash-flow waterfall
monthlySold comps — $/sqft
last 12 mo · ≤1 miLoading sold comps…