1218 Weston Rd · Cave-In-Rock, IL
Flood risk 1/10 · Minimal
- FEMA flood zone
- X (unshaded)
- Chance of flooding over 30 yrs
- 0.0%
- Est. flood insurance / yr
- $473 – $860
Fire risk 3/10 · Minor
- Est. fire insurance / yr
- $839 – $1,559
Heat risk 4/10 · Minor
- Hot days now (above 107°F)
- 7 days/yr
- Hot days in 30 yrs
- 20 days/yr
Wind risk 3/10 · Minor
- Chance of severe wind over 30 yrs
- 5.0%
Air-quality risk 2/10 · Minimal
- Unhealthy air days now
- 1 days/yr
- Unhealthy air days in 30 yrs
- 1 days/yr
Risk factors via First Street. Map © Google.
Why this score? — see what drove the B- grade
The composite is a weighted blend of 9 inputs, each scored 0–100. Each bar is that input's sub-score; the figure is the points it added to the 100-point composite (weight × sub-score).
- Cash flow +30.0/30.0
- 1% rule +10.0/10.0
- DSCR +10.0/10.0
- ARV discount +7.5/15.0
- Schools +3.1/10.0
- Rent growth +2.5/5.0
- Livability +2.5/5.0
- Condition / age +1.0/5.0
- Appreciation +0.0/10.0
$50,000
🖨 Deal sheet 📄 Offer letter ✓ Due diligence
Listing remarks
Stop!! The perfect place to start your homestead dreams. Brick home with hardwood floors on 10.68 acres. It has been empty for sometime and needs just a little TLC. This home is ready for someone just like you.
Key facts
- Brick home
- 10.68 acres
- Hardwood floors
Tags
Property features AI
Exterior
- Utilities: Public water
- Home design: Single-family residence; One story
- Construction: Frame construction; Shingle roof
- Exterior features: Wooded lot; Rolling slope
Interior
- Kitchen: Electric water heater
- Bathrooms: 1 full bathroom
- Heating & cooling: Wood stove heating; Attic fan cooling
- Interior features: Eat-in kitchen; Living room fireplace
- Laundry & utility: Laundry in basement; Unfinished basement
Neighborhood map
What this means for you Summary
Snapshot
- This is a 2-bed/1.0-bath single-family listed at $50k. Condition is rated poor.
Deal economics
- At list price, monthly cash flow is $420 ($5k/yr) — positive.
- The deal already cash-flows at list — no discount required.
- Meets the 1% rule at list price ($934 rent vs $50k).
- Recommended offer: $49k (1.5% below list) — sets the bar for market timing.
Location & tenants
- Location reads: area grade B — affects rentability + tenant quality, not the cash-flow math above.
- Crittenden County (rural): math 33% / reading 41% proficiency, ranked #56 of 165 in KY (top 34%) — families likely to look elsewhere, expect single-tenant / working-renter base with shorter leases.
- Zoned schools: Crittenden County Elementary School (math 47% / reading 45%, grade D-, #137 of 676 statewide, top 21%, 642 students, 66% FRL); Crittenden County Middle School (math 26% / reading 39%, grade F, #116 of 217 statewide, top 55%, 291 students, 60% FRL); Crittenden County High School (math 22% / reading 37%, grade F, #127 of 254 statewide, top 58%, 429 students, 56% FRL).
Forward outlook
- Local home prices are declining (-3.0%/yr); year-one equity from $346 of loan paydown is wiped out by about $2k of value loss. Plan a longer hold.
- Crittenden County population projected at -11% by 2050 — secular population decline; favor cash flow + early exit over multi-decade hold.
- At projected returns (-3.0% appreciation + 3.0% rent growth), your $14k cash investment doubles in ~4 years — after that, you're playing with house money.
Negotiation context
- It's been on market 29 days — a 2% lower offer ($49k) is reasonable based on typical stale-listing flexibility.
Questions for the listing agent
- Have any recent inspections been done? Can we get a copy of the seller's disclosures and any deferred-maintenance estimates?
- Is there a deadline driving the sale (1031 exchange, divorce, estate, relocation)? That informs how much negotiation room exists.
- What's the average days-on-market for RENTAL listings here right now (not sales)? A rising rental-DOM trend means longer vacancies and softer asking-rent achievability than the comps imply.
- What's the recent tenant-quality profile in this submarket — average credit score on applications, eviction rate, late-payment / NSF rate, and stable-employment percentage? A property-management company in the area should have these aggregated.
- How much new for-sale + rental construction is in the pipeline within 1–3 miles? Heavy new supply typically softens prices + rents 12–24 months out; constrained supply supports both.
Investment metrics
- 1% rule
- 1.87% ✓
- Cap rate
- 16.37%
- Cash-on-cash
- 35.99%
- DSCR
- 2.60
- GRM
- 4.5
CMA / ARV
No comps found within radius.
Projected returns pro-forma
-3.0% appreciation · 3.0% rent growth · sell at horizon
- IRR
- 31.7%
- Equity multiple
- 2.33×
- Total profit
- $18,635
- Equity at exit
- $7,455
- IRR
- 38.8%
- Equity multiple
- 4.62×
- Total profit
- $50,649
- Equity at exit
- $4,323
Cash invested: $14,000 (down + closing). Projections, not guarantees.
Landlord ↔ Tenant lean methodology
- Overall (STATE)
- 43 Moderately Tenant-Leaning
- State Illinois
- 43 Moderately Tenant-Leaning · D+7
- County
- — inherits STATE
- City
- — inherits STATE
ZIP-level market 42064
- Home prices YoY
- -17.0%
- Price-to-rent
- 4.5×
Monthly cashflow live
- Estimated rent
- $934 medium interval (Pro) →
- Mortgage (P&I)
- −$262
- Tax from tax record
- −$35 /mo · $423/yr
- Insurance
- −$21
- HOA
- −$0
- Vacancy / Maint / Mgmt
- −$196
- Net cashflow
- $420
Break-even live
UW: 25.0% down · 7.5% · 30yr · 1.5% tax · 5.0% vac · 8.0% maint · 8.0% mgmt
Financing live
Cash to close
- Down payment
- $12,500
- Closing costs
- $1,500
- Reserves months
- —
- Total cash needed
- —
Loan-product check · same deal, 3 products live
Conventional
25% down · 7.5% · 30yr
- Down + closing
- —
- Monthly P&I
- —
- Monthly cashflow
- —
- DSCR
- —
- Eligible?
- —
Personal DTI + credit; lowest rate.
DSCR
20% down · 8.5% · 30yr
- Down + closing
- —
- Monthly P&I
- —
- Monthly cashflow
- —
- DSCR
- —
- Eligible?
- —
No personal income docs; deal must DSCR.
Hard money
10% down · 12.0% · 12mo
- Down + closing
- —
- Monthly P&I
- —
- Monthly cashflow
- —
- DSCR
- —
- Eligible?
- —
Short-term bridge; refi at stabilization.
Listing history 16 events
-
2026-06-18days on market $50,000 Active 29 DOM
-
2026-06-17days on market $50,000 Active 28 DOM
-
2026-06-16days on market $50,000 Active 27 DOM
-
2026-06-15days on market $50,000 Active 26 DOM
-
2026-06-13days on market $50,000 Active 24 DOM
-
2026-06-12days on market $50,000 Active 23 DOM
-
2026-06-09days on market $50,000 Active 20 DOM
-
2026-06-08days on market $50,000 Active 19 DOM
-
2026-06-07days on market $50,000 Active 18 DOM
-
2026-06-07days on market $50,000 Active 17 DOM
-
2026-06-04days on market $50,000 Active 14 DOM
-
2026-06-02days on market $50,000 Active 13 DOM
-
2026-06-01days on market $50,000 Active 12 DOM
-
2026-05-31days on market $50,000 Active 11 DOM
-
2026-05-31days on market $50,000 Active 10 DOM
-
2026-05-19$50,000 Active
ⓘ Source: listings_history table (triggers on properties + properties_extension) + one-shot
backfill from property_details.listing_events for pre-trigger history.
Tax reassessment forecast IL · Partial reset (capped growth)
- Current annual tax
- $423 · $35/mo
- Projected year-2 tax
- $779 · $65/mo
- Expected delta
- +$356/yr (+$30/mo · 84.3%)
ⓘ Screening estimate from a state-policy table — verify with the county assessor before closing.
Climate risk First Street
- Flood 1/10 Low FEMA zone X (unshaded) · 0% chance over 30 yrs
- Wildfire 3/10 Moderate
- Heat 4/10 Moderate 7 d/yr ≥107°F today · 20 d/yr by 30 yrs out
- Wind 3/10 Moderate 5% chance of damaging wind over 30 yrs
- Air quality 2/10 Low 1 unhealthy d/yr today · 1 by 30 yrs out
Nearby sold comps map
Loading sold comps map…
Walkable amenities ~0.75 mi
Loading nearby amenities…
Taxation est. · year 1
- Rental income
- $11,212
- − Mortgage interest
- −$2,801
- − Property taxes
- −$423
- − Insurance
- −$250
- − Repairs & maintenance
- −$897
- − Management
- −$897
- − Depreciation
- −$1,455
- Taxable income
- $4,490
- Est. tax owed @ 24.0%
- −$1,078
- After-tax cash flow
- $3,961/yr
For passive investors: Depreciation is non-cash, so a rental often shows a tax loss while cash-flowing — sheltering income. Rental losses are passive: they offset passive income freely, and up to $25,000/yr can offset ordinary (W-2) income if you actively participate and your MAGI is under $100k (phasing out to $0 by $150k); unused losses carry forward. On sale, claimed depreciation is recaptured at up to 25%, and gains may owe capital-gains tax (a 1031 exchange can defer both). Figures are a year-1 estimate at your 24.0% rate — not tax advice; consult a CPA.
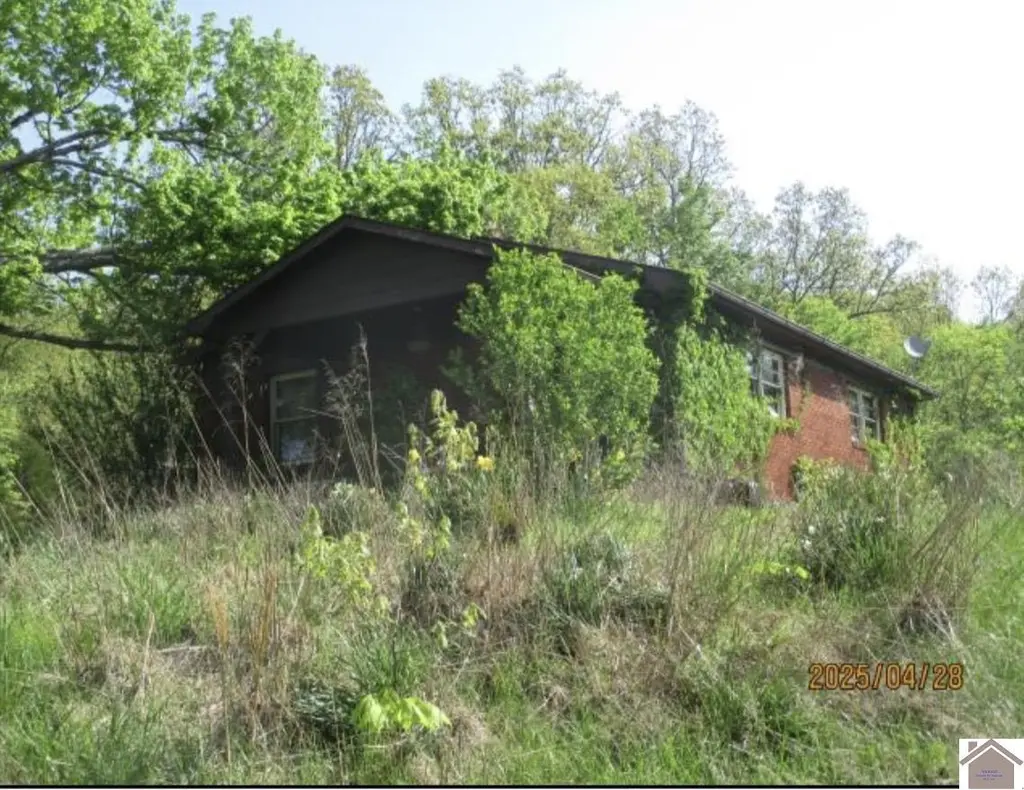
Condition & rehab AI · 1 photo
This property requires extensive repairs and maintenance, including roof repair and landscaping, to become move-in ready.
Repairs flagged
- Major roof — Vegetation is growing on the roof, indicating potential water damage
- Major exterior — Vegetation is covering the roof and sides of the house
- Major landscaping — The property is overgrown with vegetation
Value-add opportunities
- Both landscaping and exterior maintenance — Improving the landscaping and exterior would enhance curb appeal and attract potential buyers
- Both roof repair — Fixing the roof would prevent further water damage and improve the home's structural integrity
Renovation cost estimate screening
| Repair item | Severity | Est. cost |
|---|---|---|
| roof · Vegetation is growing on the roof, indicating potential water damage | Major | $15,000–50,000 |
| exterior · Vegetation is covering the roof and sides of the house | Major | $15,000–50,000 |
| landscaping · The property is overgrown with vegetation | Major | $15,000–50,000 |
| Total estimated repair cost · 3 items | $45,000–150,000 |
Value-add ROI direction
- Both landscaping and exterior maintenance — Improving the landscaping and exterior would enhance curb appeal and attract potential buyers ↑
- Both roof repair — Fixing the roof would prevent further water damage and improve the home's structural integrity ↑
ⓘ Cost ranges are severity-bucket heuristics (US national rule-of-thumb). Get contractor quotes + a written scope before underwriting a rehab budget.
Schools (NCES district)
- District
- Crittenden County
- NCES district ID
- 2101380
- Math proficiency
- 33% ▼ -10.00%
- Reading proficiency
- 41% ▼ -9.00%
- Median HH income
- $36,316
- Composite
- 30.67/100
- National rank
- #6181
- State rank
- #56 of 165 in KY
Livability — Cave-In-Rock
No livability data for this city. (Only ~50 U.S. cities are tracked.)
Census & demographics
- Population (ZIP)
- 8,020
Population outlook (Crittenden County) Hauer SSP2
- Today (2025)
- 8,874 people
- By 2030
- 8,634 · -2.7%
- By 2040
- 8,244 · -7.1%
- By 2050
- 7,884 · -11.2%
- By 2075
- 7,033 · -20.7%
- By 2100
- 5,847 · -34.1%
Race, ethnicity, and origin ACS 2023
- Neighborhood character
- Predominantly White (95%)
- Race & ethnicity
- White 95% Hispanic / Latino 3% Two or more races 2%
- Common ancestry
- Italian 6% Iranian 2% Serbian 2%
- Foreign-born
- 1%
- Languages at home
- 92% English-only · German/W. Germanic 6% Spanish 1%
Political lean MEDSL · Crittenden
- 2024 margin
- Solid R (+68.4) · D 15.2% · R 83.6% · Other 1.3%
- 2008→2024 swing
- -34.0pp toward R · 2008: -34.4pp · 2024: -68.4pp
- All cycles
- 2024: R+68.4 2020: R+64.1 2016: R+66.2 2012: R+48.8 2008: R+34.4
Not yet ingested
- Civics
- —
Market trends
- HPI YoY
- ▼ -34.91%
- Current HPI
- 170.1117
- Rent YoY
- —
- Metro
- —
- State GDP YoY
- ▲ 1.59%
- F500 in state
- 60
Industry mix (Fortune 500 HQ in IL)
| Industry | F500 HQs | Revenue |
|---|---|---|
| Insurance | 4 | $201B |
|
||
| Consumer Goods | 4 | $87B |
|
||
| Industrial Machinery | 3 | $64B |
|
||
| Healthcare | 2 | $55B |
|
||
| Retail / Pharmacy | 1 | $148B |
|
||
| Agriculture / Food | 1 | $86B |
|
||
Price history
1 event — show timeline
- 2026-05-19 Listed $50,000 WKRMLS
Cash-flow waterfall
monthlySold comps — $/sqft
last 12 mo · ≤1 miLoading sold comps…