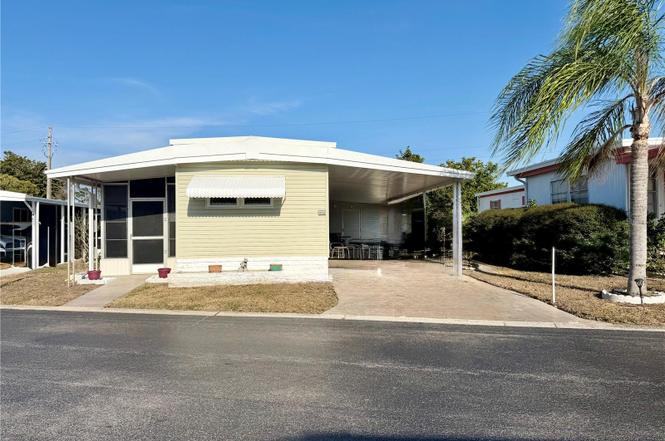
9790 66th St N #466 · Pinellas Park, FL
Flood risk 4/10 · Minor
- FEMA flood zone
- X (unshaded)
- Chance of flooding over 30 yrs
- 0.13%
- Est. flood insurance / yr
- $507 – $1,088
Fire risk 1/10 · Minimal
- Est. fire insurance / yr
- $947 – $1,759
Heat risk 10/10 · Severe
- Hot days now (above 107°F)
- 7 days/yr
- Hot days in 30 yrs
- 27 days/yr
Wind risk 10/10 · Severe
- Chance of severe wind over 30 yrs
- 99.0%
Air-quality risk 3/10 · Minor
- Unhealthy air days now
- 3 days/yr
- Unhealthy air days in 30 yrs
- 3 days/yr
Risk factors via First Street. Map © Google.
Why this score? — see what drove the B- grade
The composite is a weighted blend of 9 inputs, each scored 0–100. Each bar is that input's sub-score; the figure is the points it added to the 100-point composite (weight × sub-score).
- Cash flow +29.4/30.0
- 1% rule +10.0/10.0
- DSCR +10.0/10.0
- ARV discount +7.5/15.0
- Schools +4.3/10.0
- Livability +3.9/5.0
- Condition / age +2.5/5.0
- Rent growth +1.2/5.0
- Appreciation +0.0/10.0
$94,900
🖨 Deal sheet 📄 Offer letter ✓ Due diligence
Listing remarks
Welcome home! This beautifully updated and TURNKEY for the next owner, 2- bedroom, 1- bath mobile home has been thoughtfully renovated over the past several years and is meticulously maintained. Enjoy added living space in the bright 20x7 Florida room, plus the convenience of a covered carport where you can enjoy your grill and relax. The spacious shed includes a laundry room and a separate dedicated tool/ workroom. Behind that you will find a quiet and private patio where you can enjoy spacious back yard space. Whether you're looking for seasonal sunshine or fulltime fun FL living, this home check all the boxes! Located in desirable Clearwater Cascade 55+ community featuring two heated p
Key facts
- Back yard space
- Spacious shed
- Covered carport
Tags
Property features AI
Finance
- Other: Furnished; Living area ~576 sq ft (per public records); Large lot acreage (~60.1 acres total parcel)
- Financial info: Lease restrictions apply
- HOA & community: Has HOA; monthly association fee $353 (association approval required); Community clubhouse; Fitness center; Buyer approval required; Senior community; Pets allowed (size and number limits; contact for details)
Exterior
- Parking: Carport (1 space)
- Utilities: Public water; Public sewer; Electricity connected; Water connected; Sewer connected; Cable connected
- Home design: Residential mobile home (single wide); One story; Faces west; Completed condition
- Construction: Vinyl siding; Other roof
- Exterior features: Shade shutters; In-ground pool; Paved road access
Interior
- Kitchen: Microwave; Range; Electric water heater
- Bedrooms: 2 bedrooms
- Flooring: Laminate; Vinyl
- Bathrooms: 1 full bathroom
- Heating & cooling: Central heating (electric); Central air conditioning
- Interior features: Eat-in kitchen; Window treatments; 5 total rooms
- Laundry & utility: Washer; Dryer; Laundry: Other
Neighborhood map
What this means for you Summary
Snapshot
- This is a 2-bed/1.0-bath manufactured listed at $95k.
Deal economics
- At list price, monthly cash flow is $338 ($4k/yr) — positive.
- The deal already cash-flows at list — no discount required.
- Meets the 1% rule at list price ($2k rent vs $95k).
- Recommended offer: $86k (9.0% below list) — sets the bar for market timing.
- Cap rate 10.6% vs local median 4.0% in Pinellas Park — top-decile yield for the area; either an underpriced asset or a hidden risk that comps aren't pricing in. Stress-test before assuming the spread holds.
Location & tenants
- Location reads 78/100 on livability (#170 in FL, #2,546 nationally) — a middle-class / working-renter tenant base. Strengths: commute A+, cost of living A+, housing A+; Watch: employment D+, schools D-, amenities F.
- Pinellas (suburban): math 51% / reading 51% proficiency, ranked #31 of 73 in FL (top 42%) — acceptable for families but not a draw, mixed tenant base, ~2y average lease.
- Market conditions: Rents falling (-5.3%/yr); 200 active listings in the ZIP; 1 comparable units currently listed for rent nearby; 2,676 units permitted in Pinellas County in 2024 (1,422 in 5+ unit buildings).
- This rent runs 30% of the median local income ($66k/yr) — at the standard rent-burdened threshold; future hikes will face affordability resistance.
Forward outlook
- Local home prices are declining (-3.0%/yr); year-one equity from $656 of loan paydown is wiped out by about $3k of value loss. Plan a longer hold.
- Pinellas County population projected at +14% by 2050 — modest demand growth; plan on rents tracking national, not racing it.
Negotiation context
- It's been on market 117 days — a 9% lower offer ($86k) is reasonable based on typical stale-listing flexibility.
- Current owner paid $40k; list at $95k implies a 137% gain — meaningful room to come down on a strong offer.
Risks & watch-outs
- Watch-outs: HOA is 21% of rent.
- Climate carrying-cost: severe wind risk, 99% chance of damaging wind over 30y; extreme-heat days projected 7→27/yr by 2055 (HVAC capex compounding) — expect insurance premiums to compound above CPI over the hold.
Questions for the listing agent
- It's been on market 117 days. Have you received any prior offers? Is the seller open to a 9% concession, seller financing, or rate buy-down credit?
- Built in 1974 — when were the roof, HVAC, electrical panel, plumbing, and water heater last replaced?
- What does the HOA fee cover, when was the last increase, and are there any pending special assessments or reserve-fund shortfalls?
- Why hasn't it sold? Are there any deal-killer items the seller is aware of (foundation, flood, title, zoning, code violations)?
- Is there a deadline driving the sale (1031 exchange, divorce, estate, relocation)? That informs how much negotiation room exists.
- Schools are D-rated, which usually means shorter tenancies and higher turnover. Who's the typical renter profile here, and what's been the actual vacancy rate?
- What's the average days-on-market for RENTAL listings here right now (not sales)? A rising rental-DOM trend means longer vacancies and softer asking-rent achievability than the comps imply.
- What's the recent tenant-quality profile in this submarket — average credit score on applications, eviction rate, late-payment / NSF rate, and stable-employment percentage? A property-management company in the area should have these aggregated.
- How much new for-sale + rental construction is in the pipeline within 1–3 miles? Heavy new supply typically softens prices + rents 12–24 months out; constrained supply supports both.
Investment metrics
- 1% rule
- 1.77% ✓
- Cap rate
- 10.56%
- Cash-on-cash
- 15.24%
- DSCR
- 1.68
- GRM
- 4.7
CMA / ARV
No comps found within radius.
Projected returns pro-forma
-3.0% appreciation · 0.0% rent growth · sell at horizon
- IRR
- 1.5%
- Equity multiple
- 1.05×
- Total profit
- $1,438
- Equity at exit
- $14,150
- IRR
- 6.7%
- Equity multiple
- 1.41×
- Total profit
- $10,885
- Equity at exit
- $8,205
Cash invested: $26,572 (down + closing). Projections, not guarantees.
Landlord ↔ Tenant lean methodology
- Overall (STATE)
- 87 Strongly Landlord-Friendly
- State Florida
- 87 Strongly Landlord-Friendly · R+3
- County
- — inherits STATE
- City
- — inherits STATE
ZIP-level market 33782
- Rents YoY
- -5.3%
- Active inventory
- 200
- Price-to-rent
- 4.7×
Monthly cashflow live
- Estimated rent
- $1,675 medium interval (Pro) →
- Mortgage (P&I)
- −$498
- Tax from tax record
- −$96 /mo · $1,150/yr
- Insurance
- −$40
- HOA
- −$353
- Vacancy / Maint / Mgmt
- −$352
- Net cashflow
- $338
Break-even live
UW: 25.0% down · 7.5% · 30yr · 1.5% tax · 5.0% vac · 8.0% maint · 8.0% mgmt
Financing live
Cash to close
- Down payment
- $23,725
- Closing costs
- $2,847
- Reserves months
- —
- Total cash needed
- —
Loan-product check · same deal, 3 products live
Conventional
25% down · 7.5% · 30yr
- Down + closing
- —
- Monthly P&I
- —
- Monthly cashflow
- —
- DSCR
- —
- Eligible?
- —
Personal DTI + credit; lowest rate.
DSCR
20% down · 8.5% · 30yr
- Down + closing
- —
- Monthly P&I
- —
- Monthly cashflow
- —
- DSCR
- —
- Eligible?
- —
No personal income docs; deal must DSCR.
Hard money
10% down · 12.0% · 12mo
- Down + closing
- —
- Monthly P&I
- —
- Monthly cashflow
- —
- DSCR
- —
- Eligible?
- —
Short-term bridge; refi at stabilization.
Rent comps 1 comps
| Address | Beds | Baths | Sqft | Rent | $/sqft | DOM | Units | Dist |
|---|---|---|---|---|---|---|---|---|
| 8304 Bardmoor Blvd #104 Seminole, FL | 1.0 | 1.0 | 700 | $1,599 | $2.28 | 3d | 1 | 1.04mi |
HOA detail
- Monthly dues
- $353 · $4,236/yr
- Likely covers
- water
Listing history 14 events
-
2026-06-18days on market $94,900 Active 117 DOM
-
2026-06-17days on market $94,900 Active 116 DOM
-
2026-06-16days on market $94,900 Active 115 DOM
-
2026-06-15days on market $94,900 Active 114 DOM
-
2026-06-13days on market $94,900 Active 112 DOM
-
2026-06-09days on market $94,900 Active 108 DOM
-
2026-06-08days on market $94,900 Active 107 DOM
-
2026-06-07days on market $94,900 Active 106 DOM
-
2026-06-04days on market $94,900 Active 103 DOM
-
2026-06-03days on market $94,900 Active 102 DOM
-
2026-06-01days on market $94,900 Active 100 DOM
-
2026-05-31days on market $94,900 Active 99 DOM
-
2026-02-21$94,900 Active
-
2011-02-07soldstatus $40,000
ⓘ Source: listings_history table (triggers on properties + properties_extension) + one-shot
backfill from property_details.listing_events for pre-trigger history.
Tax reassessment forecast FL · Resets to sale price
- Current annual tax
- $1,150 · $96/mo
- Projected year-2 tax
- $1,150 · $96/mo
- Expected delta
- $0/yr ($0/mo · 0.0%)
ⓘ Screening estimate from a state-policy table — verify with the county assessor before closing.
Climate risk First Street
- Flood 4/10 Moderate FEMA zone X (unshaded) · 13% chance over 30 yrs
- Wildfire 1/10 Low
- Heat 10/10 Extreme 7 d/yr ≥107°F today · 27 d/yr by 30 yrs out
- Wind 10/10 Extreme 99% chance of damaging wind over 30 yrs
- Air quality 3/10 Moderate 3 unhealthy d/yr today · 3 by 30 yrs out
Nearby sold comps map
Loading sold comps map…
Walkable amenities ~0.75 mi
Loading nearby amenities…
Taxation est. · year 1
- Rental income
- $20,105
- − Mortgage interest
- −$5,316
- − Property taxes
- −$1,150
- − Insurance
- −$474
- − Repairs & maintenance
- −$1,608
- − Management
- −$1,608
- − HOA
- −$4,236
- − Depreciation
- −$2,761
- Taxable income
- $2,951
- Est. tax owed @ 24.0%
- −$708
- After-tax cash flow
- $3,342/yr
For passive investors: Depreciation is non-cash, so a rental often shows a tax loss while cash-flowing — sheltering income. Rental losses are passive: they offset passive income freely, and up to $25,000/yr can offset ordinary (W-2) income if you actively participate and your MAGI is under $100k (phasing out to $0 by $150k); unused losses carry forward. On sale, claimed depreciation is recaptured at up to 25%, and gains may owe capital-gains tax (a 1031 exchange can defer both). Figures are a year-1 estimate at your 24.0% rate — not tax advice; consult a CPA.
Schools (NCES district)
- District
- Pinellas
- NCES district ID
- 1201560
- Math proficiency
- 51% ▼ -5.00%
- Reading proficiency
- 51% ▼ -3.00%
- Median HH income
- $46,270
- Composite
- 43.27/100
- National rank
- #3046
- State rank
- #31 of 73 in FL
Livability — Pinellas Park
- Score
- 78/100
- State rank
- #170
- US rank
- #2546
Category grades
Schools grade is shown separately in the Schools card above.
Census & demographics
- Census place
- Pinellas Park, FL
- County
- Pinellas County · 939,478 people
- City population
- 50,533
- Metro
- Tampa-St. Petersburg-Clearwater, FL
- Population (ZIP)
- 22,461
- Household income
- $66,461
- Rent vs Own
- Severe rent burden
- 486.0
Population outlook (Pinellas County) Hauer SSP2
- Today (2025)
- 1,027,532 people
- By 2030
- 1,063,586 · +3.5%
- By 2040
- 1,125,020 · +9.5%
- By 2050
- 1,168,637 · +13.7%
- By 2075
- 1,265,188 · +23.1%
- By 2100
- 1,260,357 · +22.7%
Race, ethnicity, and origin ACS 2023
- Neighborhood character
- Predominantly White (68%)
- Race & ethnicity
- White 68% Hispanic / Latino 12% Asian 12% Two or more races 8% Black 5%
- Hispanic origin (detail)
- Mexican 3% Puerto Rican 2% Cuban 2%
- Common ancestry
- Lithuanian 3% Italian 3% Romanian 2%
- Foreign-born
- 17% · Canada, Vietnam, China
- Languages at home
- 78% English-only · Spanish 9% Vietnamese 7% Other Indo-European 2%
Political lean MEDSL · Pinellas
- 2024 margin
- Lean R (+5.2) · D 46.9% · R 52.1%
- 2008→2024 swing
- -13.5pp toward R · 2008: 8.3pp · 2024: -5.2pp
- All cycles
- 2024: R+5.2 2020: D+0.2 2016: R+1.1 2012: D+5.6 2008: D+8.3
Not yet ingested
- Civics
- —
Market trends
- HPI YoY
- ▼ -250.17%
- Current HPI
- 314.1689
- Rent YoY
- ▼ -5.28%
- Metro
- Tampa-St. Petersburg-Clearwater, FL
- State GDP YoY
- ▲ 3.28%
- F500 in state
- 36
Industry mix (Fortune 500 HQ in FL)
| Industry | F500 HQs | Revenue |
|---|---|---|
| Industrial Technology | 2 | $29B |
|
||
| Insurance | 2 | $17B |
|
||
| Retail | 1 | $60B |
|
||
| Technology Distribution | 1 | $58B |
|
||
| Homebuilding | 1 | $35B |
|
||
| Technology Manufacturing | 1 | $35B |
|
||
Price history
+137.2% since first listed2 events — show timeline
- 2026-02-21 Listed $94,900 Stellar MLS as Distributed by MLS Grid
- 2011-02-07 Sold (Public Records) $40,000 Public Records
Property tax history
+3.5%/yrLatest (2025): $1,150 · -7.7% YoY. Source: county tax records.
Cash-flow waterfall
monthlySold comps — $/sqft
last 12 mo · ≤1 miLoading sold comps…