 🏷️ Likely Rental
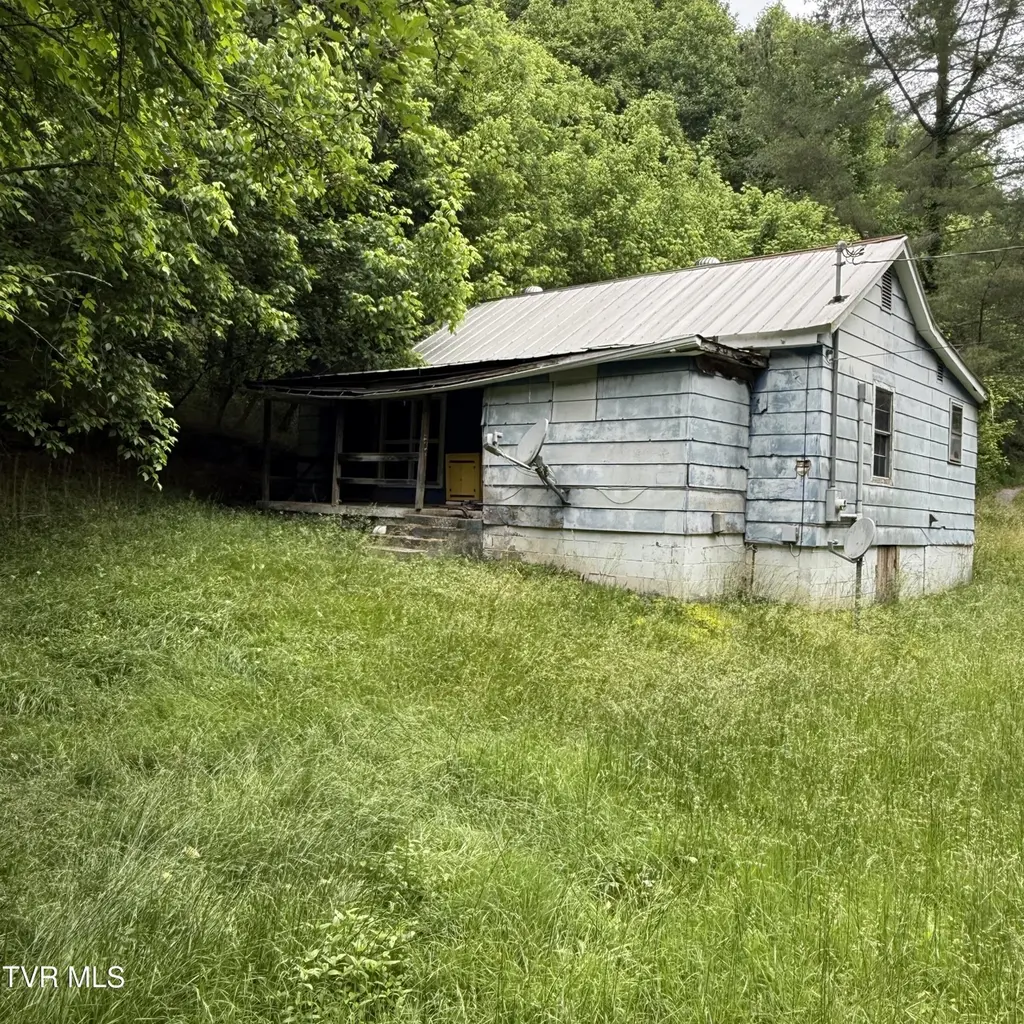
1553 Sugar Pine Ln · Mount Carmel, TN
Flood risk 10/10 · Severe
- FEMA flood zone
- X (unshaded)
- Chance of flooding over 30 yrs
- 0.99%
- Est. flood insurance / yr
- $473 – $860
Fire risk 6/10 · Moderate
- Est. fire insurance / yr
- $666 – $1,236
Heat risk 4/10 · Minor
- Hot days now (above 99°F)
- 7 days/yr
- Hot days in 30 yrs
- 21 days/yr
Wind risk 2/10 · Minimal
- Chance of severe wind over 30 yrs
- —
Air-quality risk 2/10 · Minimal
- Unhealthy air days now
- 0 days/yr
- Unhealthy air days in 30 yrs
- 2 days/yr
Risk factors via First Street. Map © Google.
Why this score? — see what drove the C- grade
The composite is a weighted blend of 9 inputs, each scored 0–100. Each bar is that input's sub-score; the figure is the points it added to the 100-point composite (weight × sub-score).
- Cash flow +15.0/30.0
- ARV discount +7.5/15.0
- Schools +5.8/10.0
- Appreciation +5.1/10.0
- 1% rule +5.0/10.0
- DSCR +5.0/10.0
- Livability +3.2/5.0
- Rent growth +2.5/5.0
- Condition / age +2.5/5.0
$10,000
🖨 Deal sheet 📄 Offer letter ✓ Due diligence
Listing remarks
Opportunity to give this home its next chapter. Nice location in Gate City. Blue house on left. Secluded and private- yet just off Hwy 23 in the Daniel Boone community. Home sold ''As is''. Cash only. Great opportunity if you're willing to put in the effort. Needs work. Owner states that septic line has a possible break. ALL viewers must sign a HOLD HARMLESS Agreement provided by their REALTOR. Electricity is not on. Floors could be unstable. Many unknowns due to being vacant. All contents within home sold with home. Home needs a lot of work, but this project could be a great fixer upper to add to your portfolio. PLEASE no trespassing on property without an agent accompanying you. Seller ma
Key facts
- 4,356 sq ft lot
- Built 1950
- Listed 4 days
Property features AI
Exterior
- Utilities: Public water (see remarks); Electricity connected; Water connected; Septic tank sewer
- Home design: Single-family house; One level; Residential zoning; Located in the Daniel Boone subdivision
- Construction: Masonite exterior; Block foundation; Built as a house (one-story)
- Exterior features: Shingle roof; Rolling slope topography; Lot dimensions approximately 89 x 48
Interior
- Bedrooms: Total of 5 rooms (bedrooms and other rooms combined)
- Bathrooms: 1 full bathroom
- Heating & cooling: Space heater; No central cooling
- Interior features: Crawl space basement; Has a view
Neighborhood map
What this means for you Summary
Snapshot
- This is a 2-bed/1.0-bath single-family listed at $10k.
Deal economics
- At list price, monthly cash flow is $917 ($11k/yr) — positive.
- The deal already cash-flows at list — no discount required.
- Meets the 1% rule at list price ($1k rent vs $10k).
- Cap rate 123.0% vs local median 4.2% in Mount Carmel — top-decile yield for the area; either an underpriced asset or a hidden risk that comps aren't pricing in. Stress-test before assuming the spread holds.
Location & tenants
- Location reads 65/100 on livability (#140 in TN) — a middle-class / working-renter tenant base. Strengths: cost of living A+, housing A+; Watch: crime C-, employment D+, amenities F.
- Scott County Public School District (rural): math 66% / reading 73% proficiency, ranked #33 of 131 in VA (top 25%) — acceptable for families but not a draw, mixed tenant base, ~2y average lease.
- Zoned schools: Shoemaker Elementary (math 64% / reading 72%, grade B+, #366 of 1,108 statewide, top 33%, 450 students, 81% FRL); Gate City Middle (math 74% / reading 71%, grade A, #61 of 342 statewide, top 18%, 333 students, 78% FRL); Gate City High (math 77% / reading 82%, grade A-, #63 of 319 statewide, top 22%, 619 students, 77% FRL) — zoned schools average 79% FRL vs 48% district-wide (31 pts higher); higher-poverty schools than district average — tighter screening recommended.
- Market conditions: 22 units permitted in Scott County in 2024 (0 in 5+ unit buildings).
Forward outlook
- In year one you build about $91 of equity ($69 loan paydown + $22 appreciation (0.2% local appreciation)).
- Scott County population projected at -24% by 2050 — secular population decline; favor cash flow + early exit over multi-decade hold.
- At projected returns (0.2% appreciation + 3.0% rent growth), your $3k cash investment doubles in ~1 year — after that, you're playing with house money.
Negotiation context
- Only 4 days on market — expect competitive offers; lowballing is unlikely to land.
Risks & watch-outs
- Watch-outs: flood insurance adds $56/mo; built in 1950 — expect roof / HVAC / electrical / plumbing capex.
- Climate carrying-cost: severe flood risk; major wildfire risk — expect insurance premiums to compound above CPI over the hold.
Questions for the listing agent
- Built in 1950 — when were the roof, HVAC, electrical panel, plumbing, and water heater last replaced?
- What's the actual annual flood-insurance premium (NFIP or private), and is the property in a SFHA with mandatory coverage?
- Is there a deadline driving the sale (1031 exchange, divorce, estate, relocation)? That informs how much negotiation room exists.
- Schools are D-rated, which usually means shorter tenancies and higher turnover. Who's the typical renter profile here, and what's been the actual vacancy rate?
- What's the average days-on-market for RENTAL listings here right now (not sales)? A rising rental-DOM trend means longer vacancies and softer asking-rent achievability than the comps imply.
- What's the recent tenant-quality profile in this submarket — average credit score on applications, eviction rate, late-payment / NSF rate, and stable-employment percentage? A property-management company in the area should have these aggregated.
- How much new for-sale + rental construction is in the pipeline within 1–3 miles? Heavy new supply typically softens prices + rents 12–24 months out; constrained supply supports both.
Investment metrics
- 1% rule
- 13.20% ✓
- Cap rate
- 123.02%
- Cash-on-cash
- 416.89%
- DSCR
- 19.55
- GRM
- 0.6
CMA / ARV
- ARV (on-the-fly)
- $147,246
- Comps found
- 1
Show comp detail 1 sale within ~0.75 mi
| Address | Dist | Beds/Ba | Sqft | Sold | Price | $/sf | Match |
|---|---|---|---|---|---|---|---|
| 123 Military Ln | 0.13mi | 2/1.0 | 1,062 (-0%) | 18mo | $147,000 | $138 | 78 |
Match score weights: distance 35% · size 25% · config 20% · recency 20%. Top-matched comps best support the ARV.
Projected returns pro-forma
0.22% appreciation · 3.0% rent growth · sell at horizon
- IRR
- —
- Equity multiple
- 21.82×
- Total profit
- $58,284
- Equity at exit
- $3,016
- IRR
- —
- Equity multiple
- 46.58×
- Total profit
- $127,628
- Equity at exit
- $3,717
Cash invested: $2,800 (down + closing). Projections, not guarantees.
Landlord ↔ Tenant lean methodology
- Overall (STATE)
- 87 Strongly Landlord-Friendly
- State Tennessee
- 87 Strongly Landlord-Friendly · R+13
- County
- — inherits STATE
- City
- — inherits STATE
ZIP-level market 24251
- Home prices YoY
- 0.1%
- Price-to-rent
- 0.6×
Monthly cashflow live
- Estimated rent
- $1,320 medium interval (Pro) →
- Mortgage (P&I)
- −$52
- Tax from tax record
- −$13 /mo · $162/yr
- Insurance
- −$4
- Flood insurance flood zone
- −$56 /mo · $666/yr
- HOA
- −$0
- Vacancy / Maint / Mgmt
- −$277
- Net cashflow
- $917
Break-even live
UW: 25.0% down · 7.5% · 30yr · 1.5% tax · 5.0% vac · 8.0% maint · 8.0% mgmt
Financing live
Cash to close
- Down payment
- $2,500
- Closing costs
- $300
- Reserves months
- —
- Total cash needed
- —
Loan-product check · same deal, 3 products live
Conventional
25% down · 7.5% · 30yr
- Down + closing
- —
- Monthly P&I
- —
- Monthly cashflow
- —
- DSCR
- —
- Eligible?
- —
Personal DTI + credit; lowest rate.
DSCR
20% down · 8.5% · 30yr
- Down + closing
- —
- Monthly P&I
- —
- Monthly cashflow
- —
- DSCR
- —
- Eligible?
- —
No personal income docs; deal must DSCR.
Hard money
10% down · 12.0% · 12mo
- Down + closing
- —
- Monthly P&I
- —
- Monthly cashflow
- —
- DSCR
- —
- Eligible?
- —
Short-term bridge; refi at stabilization.
Listing history 1 events
-
2026-05-25$10,000 Active
ⓘ Source: listings_history table (triggers on properties + properties_extension) + one-shot
backfill from property_details.listing_events for pre-trigger history.
Tax reassessment forecast TN · Resets to sale price
- Current annual tax
- $162 · $13/mo
- Projected year-2 tax
- $162 · $13/mo
- Expected delta
- $0/yr ($0/mo · 0.0%)
ⓘ Screening estimate from a state-policy table — verify with the county assessor before closing.
Climate risk First Street
- Flood 10/10 Extreme FEMA zone X (unshaded) · 99% chance over 30 yrs
- Wildfire 6/10 Major
- Heat 4/10 Moderate 7 d/yr ≥99°F today · 21 d/yr by 30 yrs out
- Wind 2/10 Low
- Air quality 2/10 Low 0 unhealthy d/yr today · 2 by 30 yrs out
Nearby sold comps map
Loading sold comps map…
Walkable amenities ~0.75 mi
Loading nearby amenities…
Taxation est. · year 1
- Rental income
- $15,840
- − Mortgage interest
- −$560
- − Property taxes
- −$162
- − Insurance
- −$716
- − Repairs & maintenance
- −$1,267
- − Management
- −$1,267
- − Depreciation
- −$291
- Taxable income
- $11,577
- Est. tax owed @ 24.0%
- −$2,778
- After-tax cash flow
- $8,228/yr
For passive investors: Depreciation is non-cash, so a rental often shows a tax loss while cash-flowing — sheltering income. Rental losses are passive: they offset passive income freely, and up to $25,000/yr can offset ordinary (W-2) income if you actively participate and your MAGI is under $100k (phasing out to $0 by $150k); unused losses carry forward. On sale, claimed depreciation is recaptured at up to 25%, and gains may owe capital-gains tax (a 1031 exchange can defer both). Figures are a year-1 estimate at your 24.0% rate — not tax advice; consult a CPA.
Schools (NCES district)
- District
- Scott County Public School District
- NCES district ID
- 5103480
- Math proficiency
- 66% ▼ -26.00%
- Reading proficiency
- 73% ▼ -12.00%
- Median HH income
- $36,567
- Composite
- 57.65/100
- National rank
- #1061
- State rank
- #33 of 131 in VA
Livability — Mount Carmel
- Score
- 65/100
- State rank
- #140
- US rank
- #12696
Category grades
Schools grade is shown separately in the Schools card above.
Census & demographics
- City population
- 5,504
- Population (ZIP)
- 7,976
Population outlook (Scott County) Hauer SSP2
- Today (2025)
- 20,405 people
- By 2030
- 19,379 · -5.0%
- By 2040
- 17,325 · -15.1%
- By 2050
- 15,464 · -24.2%
- By 2075
- 11,845 · -42.0%
- By 2100
- 8,516 · -58.3%
Race, ethnicity, and origin ACS 2023
- Neighborhood character
- Predominantly White (94%)
- Race & ethnicity
- White 94% Two or more races 3% Hispanic / Latino 3% Black 2%
- Common ancestry
- Serbian 4% Slovak 2% Italian 2%
- Foreign-born
- 1%
Political lean MEDSL · Scott
- 2024 margin
- Solid R (+70.4) · D 14.5% · R 84.9%
- 2008→2024 swing
- -27.3pp toward R · 2008: -43.1pp · 2024: -70.4pp
- All cycles
- 2024: R+70.4 2020: R+67.8 2016: R+66.3 2012: R+50.6 2008: R+43.1
Not yet ingested
- Civics
- —
Market trends
- HPI YoY
- ▲ 0.22%
- Current HPI
- 211.6519
- Rent YoY
- —
- Metro
- —
- State GDP YoY
- ▲ 2.78%
- F500 in state
- 22
Industry mix (Fortune 500 HQ in TN)
| Industry | F500 HQs | Revenue |
|---|---|---|
| Healthcare | 3 | $91B |
|
||
| Retail | 3 | $72B |
|
||
| Transportation / Logistics | 1 | $88B |
|
||
| Paper / Packaging | 1 | $19B |
|
||
| Insurance | 1 | $13B |
|
||
| Energy | 1 | $12B |
|
||
Price history
1 event — show timeline
- 2026-05-25 Listed $10,000 TVRMLS
Property tax history
+3.6%/yrLatest (2025): $162 · +0.0% YoY. Source: county tax records.
Cash-flow waterfall
monthlySold comps — $/sqft
last 12 mo · ≤1 miLoading sold comps…