 🏗️ New Construction
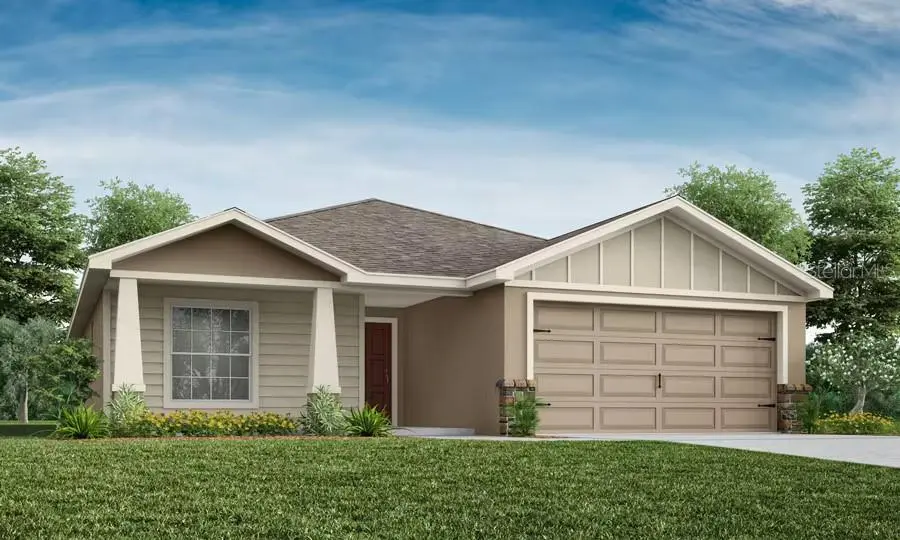
1672 Astrid Rd · Davenport, FL
Flood risk No data
- FEMA flood zone
- —
- Chance of flooding over 30 yrs
- —
- Est. flood insurance / yr
- —
Fire risk No data
- Est. fire insurance / yr
- —
Heat risk No data
- Hot days now (above threshold)
- —
- Hot days in 30 yrs
- —
Wind risk No data
- Chance of severe wind over 30 yrs
- —
Air-quality risk No data
- Unhealthy air days now
- —
- Unhealthy air days in 30 yrs
- —
Risk factors via First Street. Map © Google.
Why this score? — see what drove the F grade
The composite is a weighted blend of 9 inputs, each scored 0–100. Each bar is that input's sub-score; the figure is the points it added to the 100-point composite (weight × sub-score).
- ARV discount +7.5/15.0
- Cash flow +7.1/30.0
- Schools +3.5/10.0
- Livability +3.5/5.0
- Condition / age +2.5/5.0
- Rent growth +1.8/5.0
- 1% rule +1.7/10.0
- DSCR +1.3/10.0
- Appreciation +0.0/10.0
$357,770
🖨 Deal sheet 📄 Offer letter ✓ Due diligence
Listing remarks
Under Construction. New construction home with 1715 square feet on one-story including 4 bedrooms, 2 baths, and an open living area. Enjoy an open kitchen with Quartz countertops, Samsung stainless steel appliances, a walk-in pantry, and a spacious island, fully open to the dining café and gathering room. The living area, laundry room, and baths include luxury wood vinyl plank flooring, with stain-resistant carpet in the bedrooms. Your owner's suite is complete with a walk-in wardrobe and a private en-suite bath with dual vanities, a tiled shower, and a closeted toilet. Plus, enjoy a covered lanai, 2-car garage, custom-fit window blinds, architectural shingles, energy-efficient insul
Key facts
- Spacious island
- Quartz countertops
- Walk-in wardrobe
Tags
Property features AI
Finance
- Other: CDD present
- HOA & community: HOA managed by Hcmanagement; HOA required; $150 annually ($12.50 monthly); Pets allowed
Exterior
- Parking: Attached 2-car garage (approx. 18 x 21)
- Utilities: Public water; Public sewer; Cable available
- Home design: Single-family residence; Under construction (projected completion May 31, 2026); One level; North-facing entry
- Construction: Block construction; Shingle roof; Slab foundation; New construction by Highland Homes (Builder model: Parker)
- Exterior features: Paved road frontage; Irrigation system; Deed-restricted community; Playground; Community pool
Interior
- Kitchen: Dishwasher; Disposal; Microwave; Range; Refrigerator; Electric water heater
- Bedrooms: 4 bedrooms
- Flooring: Carpet; Vinyl
- Bathrooms: 2 full bathrooms
- Heating & cooling: Central heating; Central air conditioning
- Interior features: In-wall pest control system
- Laundry & utility: Laundry inside
Neighborhood map
What this means for you Summary
Snapshot
- This is a 4-bed/2.0-bath land listed at $358k.
Deal economics
- At list price, monthly cash flow is $-501 ($-6k/yr) — negative.
- To cash-flow at today's rent, offer at most $269k (24.7% below list).
- To meet the 1% rule (rent ≥ 1% of price), the offer needs to be $240k (32.8% below list).
- Recommended offer: $240k (32.8% below list) — sets the bar for 1% rule.
Location & tenants
- Location reads 70/100 on livability (#423 in FL) — a middle-class / working-renter tenant base. Strengths: crime A+, housing A+, health & safety A+; Watch: schools D+, employment D+, amenities F.
- Polk (suburban): math 39% / reading 43% proficiency, ranked #62 of 73 in FL (top 85%) — families likely to look elsewhere, expect single-tenant / working-renter base with shorter leases.
- Market conditions: Rents soft (-2.7%/yr); 1382 active listings in the ZIP; 40 comparable units currently listed for rent nearby; rentals at typical pace (median 21d on market — plan ~3-4 weeks tenant-placement turnaround); solid renter incomes; 10,384 units permitted in Polk County in 2024 (1,716 in 5+ unit buildings).
- This rent runs 35% of the median local income ($81k/yr) — at the standard rent-burdened threshold; future hikes will face affordability resistance.
Forward outlook
- Local home prices are declining (-3.0%/yr); year-one equity from $2k of loan paydown is wiped out by about $11k of value loss. Plan a longer hold.
- Polk County population projected at +33% by 2050 — long-run rental-demand tailwind backs the buy-and-hold thesis.
Negotiation context
- It's been on market 28 days — a 2% lower offer ($352k) is reasonable based on typical stale-listing flexibility.
- 2 sale attempts with the ask held roughly flat each time — persistent listings suggest the price (not the market) is what's stuck; bring a comps-based counter.
Questions for the listing agent
- What do current leases actually rent for vs. the listed asking? Can we see a recent rent roll and the last 12 months of T-12 income?
- What does the HOA fee cover, when was the last increase, and are there any pending special assessments or reserve-fund shortfalls?
- Is there a deadline driving the sale (1031 exchange, divorce, estate, relocation)? That informs how much negotiation room exists.
- Schools are D-rated, which usually means shorter tenancies and higher turnover. Who's the typical renter profile here, and what's been the actual vacancy rate?
- The area grade is low — what's the realistic commute time and amenity access for the typical tenant pool here? Any planned neighborhood developments (good or bad) we should know about?
- What's the average days-on-market for RENTAL listings here right now (not sales)? A rising rental-DOM trend means longer vacancies and softer asking-rent achievability than the comps imply.
- What's the recent tenant-quality profile in this submarket — average credit score on applications, eviction rate, late-payment / NSF rate, and stable-employment percentage? A property-management company in the area should have these aggregated.
- How much new for-sale + rental construction is in the pipeline within 1–3 miles? Heavy new supply typically softens prices + rents 12–24 months out; constrained supply supports both.
Investment metrics
- 1% rule
- 0.67% ✗
- Cap rate
- 4.61%
- Cash-on-cash
- -6.00%
- DSCR
- 0.73
- GRM
- 12.4
CMA / ARV
No comps found within radius.
Projected returns pro-forma
-3.0% appreciation · 0.0% rent growth · sell at horizon
- IRR
- -29.9%
- Equity multiple
- 0.03×
- Total profit
- $-96,927
- Equity at exit
- $53,345
- IRR
- -49.2%
- Equity multiple
- -0.52×
- Total profit
- $-152,739
- Equity at exit
- $30,933
Cash invested: $100,176 (down + closing). Projections, not guarantees.
Landlord ↔ Tenant lean methodology
- Overall (STATE)
- 87 Strongly Landlord-Friendly
- State Florida
- 87 Strongly Landlord-Friendly · R+3
- County
- — inherits STATE
- City
- — inherits STATE
ZIP-level market 33837
- Home prices YoY
- -33.9%
- Rents YoY
- -2.7%
- Active inventory
- 1382
- Price-to-rent
- 12.4×
Monthly cashflow live
- Estimated rent
- $2,404 high interval (Pro) →
- Mortgage (P&I)
- −$1,876
- Tax from tax record
- −$363 /mo · $4,355/yr
- Insurance
- −$149
- HOA
- −$12
- Vacancy / Maint / Mgmt
- −$505
- Net cashflow
- $-501
Break-even live
UW: 25.0% down · 7.5% · 30yr · 1.5% tax · 5.0% vac · 8.0% maint · 8.0% mgmt
Financing live
Cash to close
- Down payment
- $89,442
- Closing costs
- $10,733
- Reserves months
- —
- Total cash needed
- —
Loan-product check · same deal, 3 products live
Conventional
25% down · 7.5% · 30yr
- Down + closing
- —
- Monthly P&I
- —
- Monthly cashflow
- —
- DSCR
- —
- Eligible?
- —
Personal DTI + credit; lowest rate.
DSCR
20% down · 8.5% · 30yr
- Down + closing
- —
- Monthly P&I
- —
- Monthly cashflow
- —
- DSCR
- —
- Eligible?
- —
No personal income docs; deal must DSCR.
Hard money
10% down · 12.0% · 12mo
- Down + closing
- —
- Monthly P&I
- —
- Monthly cashflow
- —
- DSCR
- —
- Eligible?
- —
Short-term bridge; refi at stabilization.
Rent comps 40 comps
| Address | Beds | Baths | Sqft | Rent | $/sqft | DOM | Units | Dist |
|---|---|---|---|---|---|---|---|---|
| 1497 Fleur Dr Davenport, FL | 4.0 | 2.5 | 2029 | $2,150 | $1.06 | 3d | 1 | 0.11mi |
| 1391 Mountain Flower Ln Davenport, FL | 4.0 | 2.0 | 1855 | $2,400 | $1.29 | 23d | 1 | 0.11mi |
| 1387 Mountain Flower Ln Davenport, FL | 4.0 | 2.0 | 1698 | $2,300 | $1.35 | 23d | 1 | 0.12mi |
| 2442 Matterhorn Trl Davenport, FL | 4.0 | 2.5 | 2029 | $2,400 | $1.18 | 23d | 1 | 0.15mi |
| 145 Silver Maple Bnd Davenport, FL | 3.0 | 2.0 | 1450 | $2,100 | $1.45 | 23d | 1 | 0.34mi |
| 703 Gotts Rd Davenport, FL | 3.0 | 1.0 | 1160 | $1,700 | $1.47 | 23d | 1 | 0.46mi |
| 607 Lindbergh Way Davenport, FL | 3.0 | 2.0 | 1407 | $1,851 | $1.32 | 3d | 1 | 0.61mi |
| 646 Lindbergh Way Davenport, FL | 3.0 | 2.0 | 1407 | $1,836 | $1.30 | 3d | 1 | 0.62mi |
| 422 Earheart Dr Davenport, FL | 4.0 | 2.0 | 2110 | $2,001 | $0.95 | 14d | 1 | 0.64mi |
| 1016 Gotts Rd Davenport, FL | 3.0 | 2.5 | 2096 | $2,150 | $1.03 | 23d | 1 | 0.67mi |
| 670 Highland Meadows St Davenport, FL | 3.0 | 2.0 | 1576 | $2,350 | $1.49 | 23d | 1 | 0.68mi |
| 202 Highland Meadows Pl Davenport, FL | 3.0 | 2.0 | 1252 | $2,000 | $1.60 | 14d | 1 | 0.69mi |
| 481 Earheart Dr Davenport, FL | 4.0 | 2.0 | 1938 | $2,126 | $1.10 | 14d | 1 | 0.69mi |
| 445 Earheart Dr Davenport, FL | 4.0 | 2.0 | 2110 | $2,036 | $0.96 | 3d | 1 | 0.70mi |
| 120 Captain Hook Way Davenport, FL | 4.0 | 3.0 | 1715 | $2,124 | $1.24 | 23d | 1 | 0.70mi |
| 250 Highland Meadows Ct Davenport, FL | 3.0 | 2.0 | 1527 | $1,999 | $1.31 | 23d | 1 | 0.74mi |
| 2057 Barroso ST Davenport, FL | 3.0 | 2.5 | 1465 | $2,100 | $1.43 | 23d | 1 | 0.86mi |
| 112 Andalusia Loop Davenport, FL | 4.0 | 2.0 | 1972 | $2,016 | $1.02 | 21d | 1 | 0.88mi |
| 2380 Sanderling St Haines City, FL | 4.0 | 2.0 | 1694 | $2,300 | $1.36 | 23d | 1 | 0.89mi |
| 2361 Sanderling St Haines City, FL | 4.0 | 2.0 | 2113 | $2,079 | $0.98 | 3d | 1 | 0.93mi |
| 440 Tisone Ln Davenport, FL | 4.0 | 2.0 | 2102 | $3,500 | $1.67 | 14d | 1 | 1.02mi |
| 210 E Palm St Davenport, FL | 4.0 | 2.0 | 1126 | $2,250 | $2.00 | 21d | 1 | 1.03mi |
| 118 E Pine St Davenport, FL | 3.0 | 2.0 | 1220 | $1,975 | $1.62 | 3d | 1 | 1.04mi |
| 401 Savannah Preserve Loop Davenport, FL | 4.0 | 2.0 | 1966 | $2,050 | $1.04 | 23d | 1 | 1.04mi |
| 118 Aria Way Davenport, FL | 3.0 | 2.0 | 1818 | $2,400 | $1.32 | 14d | 1 | 1.05mi |
| 250 Sandestin Dr Haines City, FL | 3.0 | 2.0 | 1959 | $2,026 | $1.03 | 14d | 1 | 1.06mi |
| 220 Champions Way Davenport, FL | 1.0–3.0 | 1.0–2.5 | 1107 | $1,997 | $1.80 | 2d | 7 | 1.07mi |
| 2606 Irish Elk Ave Davenport, FL | 3.0 | 2.0 | 1700 | $2,000 | $1.18 | 3d | 1 | 1.09mi |
| 2622 Irish Elk Ave Davenport, FL | 4.0 | 2.0 | 1840 | $2,200 | $1.20 | 23d | 1 | 1.12mi |
| 4466 Hummingbird Ln Haines City, FL | 4.0 | 2.0 | 1547 | $2,200 | $1.42 | 3d | 1 | 1.16mi |
| 223 Bergamot Loop Davenport, FL | 3.0 | 2.0 | 1080 | $2,300 | $2.13 | 3d | 1 | 1.16mi |
| 487 Eaglecrest Dr Haines City, FL | 3.0 | 2.0 | 1414 | $2,150 | $1.52 | 23d | 1 | 1.16mi |
| 522 Pentas Ln Haines City, FL | 4.0 | 2.0 | 1749 | $2,200 | $1.26 | 23d | 1 | 1.18mi |
| 365 Citrus Pointe Dr Davenport, FL | 3.0 | 2.0 | 1975 | $2,500 | $1.27 | 21d | 1 | 1.22mi |
| 569 Disa Dr Davenport, FL | 4.0 | 2.0 | 1767 | $2,200 | $1.25 | 3d | 1 | 1.22mi |
| 584 Disa Dr Davenport, FL | 4.0 | 2.0 | 1767 | $2,200 | $1.25 | 3d | 1 | 1.25mi |
| 666 Persian Dr Haines City, FL | 3.0 | 2.0 | 1572 | $2,000 | $1.27 | 23d | 1 | 1.25mi |
| 384 Citrus Pointe Dr Davenport, FL | 4.0 | 2.0 | 1820 | $2,250 | $1.24 | 23d | 1 | 1.26mi |
| 353 Citrus Pointe Dr Davenport, FL | 4.0 | 2.5 | 1923 | $2,285 | $1.19 | 3d | 1 | 1.26mi |
| 110 Forest Ave Unit 2 Davenport, FL | 3.0 | 2.0 | 1250 | $1,295 | $1.04 | 3d | 1 | 1.32mi |
HOA detail
- Monthly dues
- $12 · $144/yr
Listing history 9 events
-
2026-06-18days on market $357,770 Active 28 DOM
-
2026-06-17days on market $357,770 Active 27 DOM
-
2026-06-16days on market $357,770 Active 26 DOM
-
2026-06-15status $357,770 Active 25 DOM
-
2026-05-21status Pending
-
2026-05-14status Active
-
2026-04-13status Pending
-
2026-03-26$357,770 Active
-
2026-03-10soldstatus $864,000
ⓘ Source: listings_history table (triggers on properties + properties_extension) + one-shot
backfill from property_details.listing_events for pre-trigger history.
Tax reassessment forecast FL · Resets to sale price
- Current annual tax
- $4,355 · $363/mo
- Projected year-2 tax
- $4,355 · $363/mo
- Expected delta
- $0/yr ($0/mo · 0.0%)
ⓘ Screening estimate from a state-policy table — verify with the county assessor before closing.
Nearby sold comps map
Loading sold comps map…
Walkable amenities ~0.75 mi
Loading nearby amenities…
Taxation est. · year 1
- Rental income
- $28,851
- − Mortgage interest
- −$20,041
- − Property taxes
- −$4,355
- − Insurance
- −$1,789
- − Repairs & maintenance
- −$2,308
- − Management
- −$2,308
- − HOA
- −$144
- − Depreciation
- −$10,408
- Taxable loss
- −$12,502
- Est. tax savings @ 24.0%
- +$3,000
- After-tax cash flow
- $-3,010/yr
For passive investors: Depreciation is non-cash, so a rental often shows a tax loss while cash-flowing — sheltering income. Rental losses are passive: they offset passive income freely, and up to $25,000/yr can offset ordinary (W-2) income if you actively participate and your MAGI is under $100k (phasing out to $0 by $150k); unused losses carry forward. On sale, claimed depreciation is recaptured at up to 25%, and gains may owe capital-gains tax (a 1031 exchange can defer both). Figures are a year-1 estimate at your 24.0% rate — not tax advice; consult a CPA.
Schools (NCES district)
- District
- Polk
- NCES district ID
- 1201590
- Math proficiency
- 39% ▼ -11.00%
- Reading proficiency
- 43% ▼ -4.00%
- Median HH income
- $43,979
- Composite
- 34.74/100
- National rank
- #5132
- State rank
- #62 of 73 in FL
Livability — Davenport
- Score
- 70/100
- State rank
- #423
- US rank
- #7541
Category grades
Schools grade is shown separately in the Schools card above.
Census & demographics
- Census place
- Davenport, FL
- County
- Polk County · 740,051 people
- City population
- 104,279
- Metro
- Lakeland-Winter Haven, FL
- Population (ZIP)
- 47,389
- Household income
- $81,276
- Rent vs Own
- Severe rent burden
- 424.0
Population outlook (Polk County) Hauer SSP2
- Today (2025)
- 752,975 people
- By 2030
- 804,621 · +6.9%
- By 2040
- 906,117 · +20.3%
- By 2050
- 1,000,476 · +32.9%
- By 2075
- 1,197,520 · +59.0%
- By 2100
- 1,271,518 · +68.9%
Race, ethnicity, and origin ACS 2023
- Neighborhood character
- Diverse neighborhood (Simpson 0.68)
- Race & ethnicity
- Hispanic / Latino 42% White 36% Two or more races 16% Black 15% Asian 2%
- Hispanic origin (detail)
- Mexican 7% Puerto Rican 22% Cuban 2% Dominican 1%
- Common ancestry
- Hispanic 5% Romanian 3% Lithuanian 1%
- Foreign-born
- 18% · Canada, Jamaica
- Languages at home
- 55% English-only · Spanish 35% French/Haitian/Cajun 6% Other Indo-European 2%
Political lean MEDSL · Polk
- 2024 margin
- Strong R (+20.7) · D 39.2% · R 59.9%
- 2008→2024 swing
- -14.6pp toward R · 2008: -6.1pp · 2024: -20.7pp
- All cycles
- 2024: R+20.7 2020: R+14.4 2016: R+14.1 2012: R+6.8 2008: R+6.1
Not yet ingested
- Civics
- —
Market trends
- HPI YoY
- ▼ -131.62%
- Current HPI
- 256.8165
- Rent YoY
- ▼ -2.73%
- Metro
- Lakeland-Winter Haven, FL
- State GDP YoY
- ▲ 3.28%
- F500 in state
- 36
Industry mix (Fortune 500 HQ in FL)
| Industry | F500 HQs | Revenue |
|---|---|---|
| Industrial Technology | 2 | $29B |
|
||
| Insurance | 2 | $17B |
|
||
| Retail | 1 | $60B |
|
||
| Technology Distribution | 1 | $58B |
|
||
| Homebuilding | 1 | $35B |
|
||
| Technology Manufacturing | 1 | $35B |
|
||
Price history
-58.6% since first listed5 events — show timeline
- 2026-05-21 Pending — Stellar MLS as Distributed by MLS Grid
- 2026-05-14 Relisted — Stellar MLS as Distributed by MLS Grid
- 2026-04-13 Pending — Stellar MLS as Distributed by MLS Grid
- 2026-03-26 Listed $357,770 Stellar MLS as Distributed by MLS Grid
- 2026-03-10 Sold (Public Records) $864,000 Public Records
Cash-flow waterfall
monthlySold comps — $/sqft
last 12 mo · ≤1 miLoading sold comps…