350 S Main St · Macy, IN
Flood risk No data
- FEMA flood zone
- —
- Chance of flooding over 30 yrs
- —
- Est. flood insurance / yr
- —
Fire risk No data
- Est. fire insurance / yr
- —
Heat risk No data
- Hot days now (above threshold)
- —
- Hot days in 30 yrs
- —
Wind risk No data
- Chance of severe wind over 30 yrs
- —
Air-quality risk No data
- Unhealthy air days now
- —
- Unhealthy air days in 30 yrs
- —
Risk factors via First Street. Map © Google.
Why this score? — see what drove the C- grade
The composite is a weighted blend of 9 inputs, each scored 0–100. Each bar is that input's sub-score; the figure is the points it added to the 100-point composite (weight × sub-score).
- Cash flow +19.3/30.0
- ARV discount +7.5/15.0
- DSCR +6.1/10.0
- 1% rule +5.1/10.0
- Condition / age +4.0/5.0
- Schools +2.9/10.0
- Livability +2.9/5.0
- Rent growth +2.5/5.0
- Appreciation +0.0/10.0
$100,000
🖨 Deal sheet 📄 Offer letter ✓ Due diligence
Listing remarks
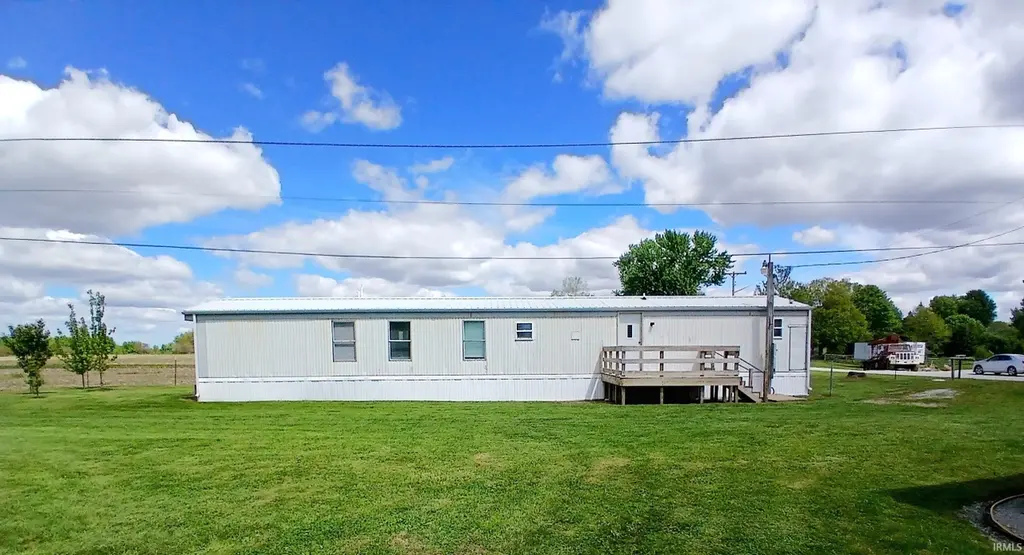
Welcome to this beautifully updated 3-bedroom, 2-bath manufactured home in Macy, Indiana! Nestled on nearly half an acre, this move-in-ready property offers a great combination of space, comfort, and modern updates. Thoughtfully renovated throughout, this home provides added peace of mind with major improvements already completed, including all-new PEX plumbing, a new sump pump, insulated skirting, brand-new water heater, new furnace, and water softener system. These valuable upgrades make this property an attractive option for both homeowners and investors looking for a low-maintenance opportunity. Inside, you’ll find fresh paint, textured walls, stylish new flooring, and updated cei
Key facts
- New furnace
- New pex plumbing
- Insulated skirting
Tags
Property features AI
Exterior
- Utilities: Private well water source; Public sewer
- Home design: Manufactured residential home
- Construction: Aluminum siding; Vinyl siding; Basement (other type) with sump pump
- Exterior features: Metal roof; Lot includes other features; Approximately 0.4 acre lot
Interior
- Kitchen: Gas range; Refrigerator
- Bedrooms: Total of 7 rooms (bedroom count not specified)
- Bathrooms: 2 full bathrooms (both on the main level)
- Heating & cooling: Natural gas heating; Central air conditioning
- Interior features: Blinds; Water softener (owned)
- Laundry & utility: Washer and dryer included; Laundry located on the main level; Electric water heater; Sump pump in basement
Neighborhood map
What this means for you Summary
Snapshot
- This is a 3-bed/2.0-bath manufactured listed at $100k. Condition is rated good.
Deal economics
- At list price, monthly cash flow is $110 ($1k/yr) — positive.
- The deal already cash-flows at list — no discount required.
- Meets the 1% rule at list price ($1k rent vs $100k).
- Recommended offer: $97k (3.0% below list) — sets the bar for market timing.
Location & tenants
- Location reads 57/100 on livability (#605 in IN) — a working-class tenant base; expect higher turnover. Strengths: cost of living A+, housing B+; Watch: employment D, crime F, amenities F.
- North Miami Community Schools (rural): math 26% / reading 42% proficiency, ranked #197 of 301 in IN (top 65%) — families likely to look elsewhere, expect single-tenant / working-renter base with shorter leases.
- Zoned schools: North Miami Elementary School (math 36% / reading 37%, grade F, #571 of 994 statewide, top 58%, 369 students, 52% FRL) — zoned schools average 52% FRL vs 26% district-wide (26 pts higher); higher-poverty schools than district average — tighter screening recommended.
- Market conditions: 17 active listings in the ZIP; 35 units permitted in Miami County in 2024 (0 in 5+ unit buildings).
Forward outlook
- Local home prices are declining (-3.0%/yr); year-one equity from $691 of loan paydown is wiped out by about $3k of value loss. Plan a longer hold.
- Miami County population projected at -12% by 2050 — secular population decline; favor cash flow + early exit over multi-decade hold.
Negotiation context
- It's been on market 48 days — a 3% lower offer ($97k) is reasonable based on typical stale-listing flexibility.
Questions for the listing agent
- It's been on market 48 days. Have you received any prior offers? Is the seller open to a 3% concession, seller financing, or rate buy-down credit?
- Is there a deadline driving the sale (1031 exchange, divorce, estate, relocation)? That informs how much negotiation room exists.
- Schools are F-rated, which usually means shorter tenancies and higher turnover. Who's the typical renter profile here, and what's been the actual vacancy rate?
- Crime grade is F in this area — have there been break-ins, vandalism, or insurance claims at this property in the last 3 years? What carrier currently insures it and at what premium?
- What's the average days-on-market for RENTAL listings here right now (not sales)? A rising rental-DOM trend means longer vacancies and softer asking-rent achievability than the comps imply.
- What's the recent tenant-quality profile in this submarket — average credit score on applications, eviction rate, late-payment / NSF rate, and stable-employment percentage? A property-management company in the area should have these aggregated.
- How much new for-sale + rental construction is in the pipeline within 1–3 miles? Heavy new supply typically softens prices + rents 12–24 months out; constrained supply supports both.
Investment metrics
- 1% rule
- 1.01% ✓
- Cap rate
- 7.62%
- Cash-on-cash
- 4.72%
- DSCR
- 1.21
- GRM
- 8.2
CMA / ARV
No comps found within radius.
Projected returns pro-forma
-3.0% appreciation · 3.0% rent growth · sell at horizon
- IRR
- -8.9%
- Equity multiple
- 0.67×
- Total profit
- $-9,170
- Equity at exit
- $14,910
- IRR
- 0.6%
- Equity multiple
- 1.04×
- Total profit
- $1,116
- Equity at exit
- $8,646
Cash invested: $28,000 (down + closing). Projections, not guarantees.
Landlord ↔ Tenant lean methodology
- Overall (STATE)
- 90 Strongly Landlord-Friendly
- State Indiana
- 90 Strongly Landlord-Friendly · R+11
- County
- — inherits STATE
- City
- — inherits STATE
ZIP-level market 46951
- Home prices YoY
- -16.5%
- Active inventory
- 17
- Price-to-rent
- 8.2×
Monthly cashflow live
- Estimated rent
- $1,014 medium interval (Pro) →
- Mortgage (P&I)
- −$524
- Tax est. 1.5%
- −$125 /mo · $1,500/yr
- Insurance
- −$42
- HOA
- −$0
- Vacancy / Maint / Mgmt
- −$213
- Net cashflow
- $110
Break-even live
UW: 25.0% down · 7.5% · 30yr · 1.5% tax · 5.0% vac · 8.0% maint · 8.0% mgmt
Financing live
Cash to close
- Down payment
- $25,000
- Closing costs
- $3,000
- Reserves months
- —
- Total cash needed
- —
Loan-product check · same deal, 3 products live
Conventional
25% down · 7.5% · 30yr
- Down + closing
- —
- Monthly P&I
- —
- Monthly cashflow
- —
- DSCR
- —
- Eligible?
- —
Personal DTI + credit; lowest rate.
DSCR
20% down · 8.5% · 30yr
- Down + closing
- —
- Monthly P&I
- —
- Monthly cashflow
- —
- DSCR
- —
- Eligible?
- —
No personal income docs; deal must DSCR.
Hard money
10% down · 12.0% · 12mo
- Down + closing
- —
- Monthly P&I
- —
- Monthly cashflow
- —
- DSCR
- —
- Eligible?
- —
Short-term bridge; refi at stabilization.
Listing history 17 events
-
2026-06-19days on market $100,000 Active 48 DOM
-
2026-06-18days on market $100,000 Active 47 DOM
-
2026-06-17days on market $100,000 Active 46 DOM
-
2026-06-16days on market $100,000 Active 45 DOM
-
2026-06-15days on market $100,000 Active 44 DOM
-
2026-06-14days on market $100,000 Active 42 DOM
-
2026-06-12days on market $100,000 Active 41 DOM
-
2026-06-09days on market $100,000 Active 38 DOM
-
2026-06-08days on market $100,000 Active 37 DOM
-
2026-06-07days on market $100,000 Active 36 DOM
-
2026-06-07days on market $100,000 Active 35 DOM
-
2026-06-03days on market $100,000 Active 32 DOM
-
2026-06-02days on market $100,000 Active 31 DOM
-
2026-06-01days on market $100,000 Active 30 DOM
-
2026-05-31days on market $100,000 Active 29 DOM
-
2026-05-31days on market $100,000 Active 28 DOM
-
2026-05-02$120,000 Active 1092-char remark
ⓘ Source: listings_history table (triggers on properties + properties_extension) + one-shot
backfill from property_details.listing_events for pre-trigger history.
Nearby sold comps map
Loading sold comps map…
Walkable amenities ~0.75 mi
Loading nearby amenities…
Taxation est. · year 1
- Rental income
- $12,171
- − Mortgage interest
- −$5,602
- − Property taxes
- −$1,500
- − Insurance
- −$500
- − Repairs & maintenance
- −$974
- − Management
- −$974
- − Depreciation
- −$2,909
- Taxable loss
- −$287
- Est. tax savings @ 24.0%
- +$69
- After-tax cash flow
- $1,391/yr
For passive investors: Depreciation is non-cash, so a rental often shows a tax loss while cash-flowing — sheltering income. Rental losses are passive: they offset passive income freely, and up to $25,000/yr can offset ordinary (W-2) income if you actively participate and your MAGI is under $100k (phasing out to $0 by $150k); unused losses carry forward. On sale, claimed depreciation is recaptured at up to 25%, and gains may owe capital-gains tax (a 1031 exchange can defer both). Figures are a year-1 estimate at your 24.0% rate — not tax advice; consult a CPA.
Condition & rehab AI · 12 photos
This move-in-ready manufactured home in Macy, Indiana, offers a great combination of space, comfort, and modern updates. The property has been thoughtfully renovated with new systems and flooring, making it an attractive option for both homeowners and investors.
Value-add opportunities
- Both landscaping — improves curb appeal and adds value
- Both new exterior paint — enhances curb appeal and value
- Both new flooring in bathrooms — improves aesthetics and functionality
Renovation cost estimate screening
Value-add ROI direction
- Both landscaping — improves curb appeal and adds value ↑
- Both new exterior paint — enhances curb appeal and value ↑
- Both new flooring in bathrooms — improves aesthetics and functionality ↑
ⓘ Cost ranges are severity-bucket heuristics (US national rule-of-thumb). Get contractor quotes + a written scope before underwriting a rehab budget.
Schools (NCES district)
- District
- North Miami Community Schools
- NCES district ID
- 1807890
- Math proficiency
- 26% ▼ -10.00%
- Reading proficiency
- 42% ▼ -3.00%
- Median HH income
- $49,863
- Composite
- 29.45/100
- National rank
- #6513
- State rank
- #197 of 301 in IN
Livability — Macy
- Score
- 57/100
- State rank
- #605
- US rank
- #21805
Category grades
Schools grade is shown separately in the Schools card above.
Census & demographics
- Census place
- Macy, IN
- Population (ZIP)
- 2,016
Population outlook (Miami County) Hauer SSP2
- Today (2025)
- 34,421 people
- By 2030
- 33,571 · -2.5%
- By 2040
- 31,919 · -7.3%
- By 2050
- 30,313 · -11.9%
- By 2075
- 26,202 · -23.9%
- By 2100
- 20,856 · -39.4%
Race, ethnicity, and origin ACS 2023
- Neighborhood character
- Predominantly White (93%)
- Race & ethnicity
- White 93% Two or more races 6%
- Common ancestry
- Iranian 3% English 3% Italian 2%
- Foreign-born
- 0%
- Languages at home
- 97% English-only · German/W. Germanic 3%
Political lean MEDSL · Miami
- 2024 margin
- Solid R (+54.5) · D 21.8% · R 76.3% · Other 1.9%
- 2008→2024 swing
- -35.1pp toward R · 2008: -19.5pp · 2024: -54.5pp
- All cycles
- 2024: R+54.5 2020: R+53.1 2016: R+53.6 2012: R+30.9 2008: R+19.5
Not yet ingested
- Civics
- —
Market trends
- HPI YoY
- ▼ -44.39%
- Current HPI
- 224.6246
- Rent YoY
- —
- Metro
- —
- State GDP YoY
- ▲ 2.90%
- F500 in state
- 18
Industry mix (Fortune 500 HQ in IN)
| Industry | F500 HQs | Revenue |
|---|---|---|
| Industrial Machinery | 2 | $37B |
|
||
| Healthcare | 1 | $177B |
|
||
| Pharmaceuticals | 1 | $45B |
|
||
| Metals / Steel | 1 | $18B |
|
||
| Agriculture | 1 | $17B |
|
||
| Packaging | 1 | $12B |
|
||
Price history
-16.7% since first listed2 events — show timeline
- 2026-05-28 Price Changed $100,000 IRMLS
- 2026-05-02 Listed $120,000 IRMLS
Property tax history
+45.7%/yrLatest (2024): $198 · +45.7% YoY. Source: county tax records.
Cash-flow waterfall
monthlySold comps — $/sqft
last 12 mo · ≤1 miLoading sold comps…