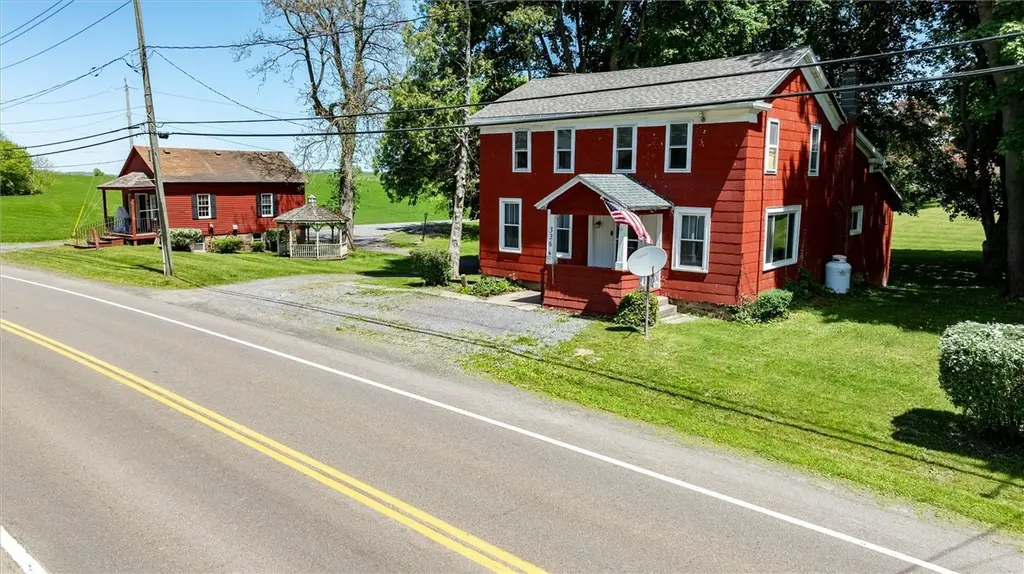
336 State Route 14 Hwy · Lyons, NY
Flood risk No data
- FEMA flood zone
- —
- Chance of flooding over 30 yrs
- —
- Est. flood insurance / yr
- —
Fire risk No data
- Est. fire insurance / yr
- —
Heat risk No data
- Hot days now (above threshold)
- —
- Hot days in 30 yrs
- —
Wind risk No data
- Chance of severe wind over 30 yrs
- —
Air-quality risk No data
- Unhealthy air days now
- —
- Unhealthy air days in 30 yrs
- —
Risk factors via First Street. Map © Google.
Why this score? — see what drove the C grade
The composite is a weighted blend of 9 inputs, each scored 0–100. Each bar is that input's sub-score; the figure is the points it added to the 100-point composite (weight × sub-score).
- Cash flow +18.8/30.0
- Appreciation +10.0/10.0
- ARV discount +7.5/15.0
- DSCR +5.9/10.0
- 1% rule +5.7/10.0
- Livability +3.8/5.0
- Schools +3.2/10.0
- Rent growth +2.5/5.0
- Condition / age +2.5/5.0
$159,000
🖨 Deal sheet 📄 Offer letter ✓ Due diligence
Listing remarks MLS
Imagine having your home just steps away from your business! Includes 2000+ sf 3 bedroom, 1.5 bath 1835 historic home. See MLS 629569 for home info. Barn built in 1920 converted & completetly redone in 1996 into a successful gift shop (Peppermints). Great exposure. Large lot. Ample parking.
Key facts
- Guest quarters
- Spacious kitchen
- Formal dining area
Tags
Property features AI
Exterior
- Parking: No garage; Circular driveway
- Utilities: Electricity connected; Well water; Septic tank; Cable available; High-speed internet available
- Home design: 2-story house; Existing construction; Asphalt roof; Composite siding; Stone foundation; Road frontage on a main thoroughfare
- Construction: Built previously (existing); Composite siding construction; Asphalt roof; Stone foundation
- Exterior features: Private yard; Covered porch; Porch; Dirt driveway; Gravel driveway; Corner lot; Rectangular lot; Agricultural lot; Shed(s) / storage; See remarks
Interior
- Kitchen: Country-style kitchen; Free-standing range; Oven; Refrigerator
- Bedrooms: Three bedrooms (all on second level)
- Flooring: Carpet; Hardwood; Laminate; Tile; Varies
- Bathrooms: Two full bathrooms; One full bathroom on the main level
- Heating & cooling: Oil heating; Baseboard heating; Hot water heating
- Interior features: Breakfast bar; Separate formal dining room; Separate formal living room; Country kitchen; Convertible bedroom; Workshop; See remarks / other interior features
- Laundry & utility: Main-level laundry; Washer; Dryer; Propane water heater; Sump pump
Neighborhood map
What this means for you Summary
Snapshot
- This is a 3-bed/2.0-bath single-family listed at $159k.
Deal economics
- At list price, monthly cash flow is $160 ($2k/yr) — positive.
- The deal already cash-flows at list — no discount required.
- Meets the 1% rule at list price ($2k rent vs $159k).
- Recommended offer: $157k (1.5% below list) — sets the bar for market timing.
Location & tenants
- Location reads 75/100 on livability (#270 in NY, #4,307 nationally) — a middle-class / working-renter tenant base. Strengths: cost of living A+, housing A+, health & safety A+; Watch: schools D, employment D, amenities F.
- Lyons Central School District (town): math 33% / reading 42% proficiency, ranked #549 of 590 in NY (top 93%) — families likely to look elsewhere, expect single-tenant / working-renter base with shorter leases.
- Market conditions: 26 active listings in the ZIP; 259 units permitted in Wayne County in 2024 (90 in 5+ unit buildings).
Forward outlook
- In year one you build about $17k of equity ($1k loan paydown + $16k appreciation (10.0% local appreciation)).
- Wayne County population projected at -24% by 2050 — secular population decline; favor cash flow + early exit over multi-decade hold.
- At projected returns (10.0% appreciation + 3.0% rent growth), your $45k cash investment doubles in ~3 years — after that, you're playing with house money.
- By year 3, paydown + projected appreciation supports a ~$43k cash-out refi (75% LTV) — recoverable capital for the next deal without selling this one.
Negotiation context
- It's been on market 18 days — a 2% lower offer ($157k) is reasonable based on typical stale-listing flexibility.
- 2 sale attempts since 20y ago with the ask held roughly flat each time — persistent listings suggest the price (not the market) is what's stuck; bring a comps-based counter.
- Current owner paid $72k; list at $159k implies a 119% gain — meaningful room to come down on a strong offer.
Risks & watch-outs
- Watch-outs: built in 1835 — expect roof / HVAC / electrical / plumbing capex.
Questions for the listing agent
- Built in 1835 — when were the roof, HVAC, electrical panel, plumbing, and water heater last replaced?
- Is there a deadline driving the sale (1031 exchange, divorce, estate, relocation)? That informs how much negotiation room exists.
- Schools are D-rated, which usually means shorter tenancies and higher turnover. Who's the typical renter profile here, and what's been the actual vacancy rate?
- What's the average days-on-market for RENTAL listings here right now (not sales)? A rising rental-DOM trend means longer vacancies and softer asking-rent achievability than the comps imply.
- What's the recent tenant-quality profile in this submarket — average credit score on applications, eviction rate, late-payment / NSF rate, and stable-employment percentage? A property-management company in the area should have these aggregated.
- How much new for-sale + rental construction is in the pipeline within 1–3 miles? Heavy new supply typically softens prices + rents 12–24 months out; constrained supply supports both.
Investment metrics
- 1% rule
- 1.07% ✓
- Cap rate
- 7.50%
- Cash-on-cash
- 4.32%
- DSCR
- 1.19
- GRM
- 7.8
CMA / ARV
No comps found within radius.
Projected returns pro-forma
10.0% appreciation · 3.0% rent growth · sell at horizon
- IRR
- 27.4%
- Equity multiple
- 3.18×
- Total profit
- $96,872
- Equity at exit
- $143,240
- IRR
- 24.0%
- Equity multiple
- 7.23×
- Total profit
- $277,413
- Equity at exit
- $308,902
Cash invested: $44,520 (down + closing). Projections, not guarantees.
Landlord ↔ Tenant lean methodology
- Overall (STATE)
- 15 Strongly Tenant-Friendly
- State New York
- 15 Strongly Tenant-Friendly · D+10
- County
- — inherits STATE
- City
- — inherits STATE
ZIP-level market 14489
- Home prices YoY
- 14.2%
- Active inventory
- 26
- Price-to-rent
- 7.8×
Monthly cashflow live
- Estimated rent
- $1,705 medium interval (Pro) →
- Mortgage (P&I)
- −$834
- Tax from tax record
- −$287 /mo · $3,445/yr
- Insurance
- −$66
- HOA
- −$0
- Vacancy / Maint / Mgmt
- −$358
- Net cashflow
- $160
Break-even live
UW: 25.0% down · 7.5% · 30yr · 1.5% tax · 5.0% vac · 8.0% maint · 8.0% mgmt
Financing live
Cash to close
- Down payment
- $39,750
- Closing costs
- $4,770
- Reserves months
- —
- Total cash needed
- —
Loan-product check · same deal, 3 products live
Conventional
25% down · 7.5% · 30yr
- Down + closing
- —
- Monthly P&I
- —
- Monthly cashflow
- —
- DSCR
- —
- Eligible?
- —
Personal DTI + credit; lowest rate.
DSCR
20% down · 8.5% · 30yr
- Down + closing
- —
- Monthly P&I
- —
- Monthly cashflow
- —
- DSCR
- —
- Eligible?
- —
No personal income docs; deal must DSCR.
Hard money
10% down · 12.0% · 12mo
- Down + closing
- —
- Monthly P&I
- —
- Monthly cashflow
- —
- DSCR
- —
- Eligible?
- —
Short-term bridge; refi at stabilization.
Listing history 17 events
-
2026-06-16status $159,000 Pending 18 DOM
-
2026-06-15days on market $159,000 Active 18 DOM
-
2026-06-13days on market $159,000 Active 16 DOM
-
2026-06-12days on market $159,000 Active 15 DOM
-
2026-06-09days on market $159,000 Active 12 DOM
-
2026-06-08days on market $159,000 Active 11 DOM
-
2026-06-07days on market $159,000 Active 10 DOM
-
2026-06-07days on market $159,000 Active 9 DOM
-
2026-06-04days on market $159,000 Active 6 DOM
-
2026-06-02days on market $159,000 Active 5 DOM
-
2026-06-01days on market $159,000 Active 4 DOM
-
2026-05-31days on market $159,000 Active 3 DOM
-
2026-05-28$159,000 Active
-
2007-05-16soldstatus $72,500 298-char remark
Show marketing remark (298 chars)
Imagine having your home just steps away from your business! Includes 2000+ sf 3 bedroom, 1.5 bath 1835 historic home. See MLS 629569 for home info. Barn built in 1920 converted & completetly redone in 1996 into a successful gift shop (Peppermints). Great exposure. Large lot. Ample parking.
-
2007-05-16soldstatus $72,500
Show marketing remark (298 chars)
Imagine having your home just steps away from your business! Includes 2000+ sf 3 bedroom, 1.5 bath 1835 historic home. See MLS 629569 for home info. Barn built in 1920 converted & completetly redone in 1996 into a successful gift shop (Peppermints). Great exposure. Large lot. Ample parking.
-
2006-10-13$97,000 298-char remark
Show marketing remark (298 chars)
Imagine having your home just steps away from your business! Includes 2000+ sf 3 bedroom, 1.5 bath 1835 historic home. See MLS 629569 for home info. Barn built in 1920 converted & completetly redone in 1996 into a successful gift shop (Peppermints). Great exposure. Large lot. Ample parking.
-
1995-09-27soldstatus $60,000
ⓘ Source: listings_history table (triggers on properties + properties_extension) + one-shot
backfill from property_details.listing_events for pre-trigger history.
Tax reassessment forecast NY · Partial reset (capped growth)
- Current annual tax
- $3,445 · $287/mo
- Projected year-2 tax
- $3,445 · $287/mo
- Expected delta
- $0/yr ($0/mo · 0.0%)
ⓘ Screening estimate from a state-policy table — verify with the county assessor before closing.
Nearby sold comps map
Loading sold comps map…
Walkable amenities ~0.75 mi
Loading nearby amenities…
Taxation est. · year 1
- Rental income
- $20,464
- − Mortgage interest
- −$8,906
- − Property taxes
- −$3,445
- − Insurance
- −$795
- − Repairs & maintenance
- −$1,637
- − Management
- −$1,637
- − Depreciation
- −$4,625
- Taxable loss
- −$582
- Est. tax savings @ 24.0%
- +$140
- After-tax cash flow
- $2,061/yr
For passive investors: Depreciation is non-cash, so a rental often shows a tax loss while cash-flowing — sheltering income. Rental losses are passive: they offset passive income freely, and up to $25,000/yr can offset ordinary (W-2) income if you actively participate and your MAGI is under $100k (phasing out to $0 by $150k); unused losses carry forward. On sale, claimed depreciation is recaptured at up to 25%, and gains may owe capital-gains tax (a 1031 exchange can defer both). Figures are a year-1 estimate at your 24.0% rate — not tax advice; consult a CPA.
Schools (NCES district)
- District
- Lyons Central School District
- NCES district ID
- 3618030
- Math proficiency
- 33% ▲ 4.00%
- Reading proficiency
- 42% ▼ -28.00%
- Median HH income
- $43,076
- Composite
- 31.73/100
- National rank
- #5909
- State rank
- #549 of 590 in NY
Livability — Lyons
- Score
- 75/100
- State rank
- #270
- US rank
- #4307
Category grades
Schools grade is shown separately in the Schools card above.
Census & demographics
- Population (ZIP)
- 7,016
Population outlook (Wayne County) Hauer SSP2
- Today (2025)
- 85,662 people
- By 2030
- 81,945 · -4.3%
- By 2040
- 73,735 · -13.9%
- By 2050
- 65,029 · -24.1%
- By 2075
- 47,451 · -44.6%
- By 2100
- 31,574 · -63.1%
Race, ethnicity, and origin ACS 2023
- Neighborhood character
- Predominantly White (86%)
- Race & ethnicity
- White 86% Hispanic / Latino 8% Two or more races 7% Black 2%
- Hispanic origin (detail)
- Puerto Rican 7%
- Common ancestry
- Iranian 8% Romanian 5% Lithuanian 3%
- Foreign-born
- 1% · Canada
- Languages at home
- 90% English-only · German/W. Germanic 7% Spanish 3% Russian/Polish/Slavic 1%
Political lean MEDSL · Wayne
- 2024 margin
- Strong R (+23.1) · D 38.5% · R 61.5%
- 2008→2024 swing
- -13.2pp toward R · 2008: -9.9pp · 2024: -23.1pp
- All cycles
- 2024: R+23.1 2020: R+19.6 2016: R+26.1 2012: R+9.3 2008: R+9.9
Not yet ingested
- Civics
- —
Market trends
- HPI YoY
- ▲ 38.65%
- Current HPI
- 311.1445
- Rent YoY
- —
- Metro
- —
- State GDP YoY
- ▲ 2.60%
- F500 in state
- 92
Industry mix (Fortune 500 HQ in NY)
| Industry | F500 HQs | Revenue |
|---|---|---|
| Financial Services | 10 | $950B |
|
||
| Consumer Goods | 9 | $162B |
|
||
| Insurance | 4 | $225B |
|
||
| Telecommunications | 2 | $144B |
|
||
| Pharmaceuticals | 2 | $112B |
|
||
| Media / Entertainment | 2 | $69B |
|
||
Price history
+165.0% since first listed5 events — show timeline
- 2026-05-28 Listed $159,000 UNYREIS
- 2007-05-16 Sold (Public Records) $72,500 Public Records
- 2007-05-16 Sold (MLS) $72,500 UNYREIS
- 2006-10-13 Listed $97,000 UNYREIS
- 1995-09-27 Sold (Public Records) $60,000 Public Records
Property tax history
+4.2%/yrLatest (2025): $3,445 · +25.1% YoY. Source: county tax records.
Cash-flow waterfall
monthlySold comps — $/sqft
last 12 mo · ≤1 miLoading sold comps…