16528 Monte Carlo Ln · Houston, TX
Flood risk 1/10 · Minimal
- FEMA flood zone
- X (unshaded)
- Chance of flooding over 30 yrs
- 0.0%
- Est. flood insurance / yr
- $507 – $1,088
Fire risk 4/10 · Minor
- Est. fire insurance / yr
- $1,222 – $2,270
Heat risk 9/10 · Severe
- Hot days now (above 110°F)
- 7 days/yr
- Hot days in 30 yrs
- 24 days/yr
Wind risk 9/10 · Severe
- Chance of severe wind over 30 yrs
- 99.0%
Air-quality risk 3/10 · Minor
- Unhealthy air days now
- 2 days/yr
- Unhealthy air days in 30 yrs
- 3 days/yr
Risk factors via First Street. Map © Google.
Why this score? — see what drove the B- grade
The composite is a weighted blend of 9 inputs, each scored 0–100. Each bar is that input's sub-score; the figure is the points it added to the 100-point composite (weight × sub-score).
- Cash flow +22.9/30.0
- ARV discount +15.0/15.0
- DSCR +7.3/10.0
- 1% rule +6.2/10.0
- Schools +4.5/10.0
- Livability +3.7/5.0
- Rent growth +2.9/5.0
- Condition / age +2.5/5.0
- Appreciation +0.0/10.0
$158,999
🖨 Deal sheet 📄 Offer letter ✓ Due diligence
Listing remarks
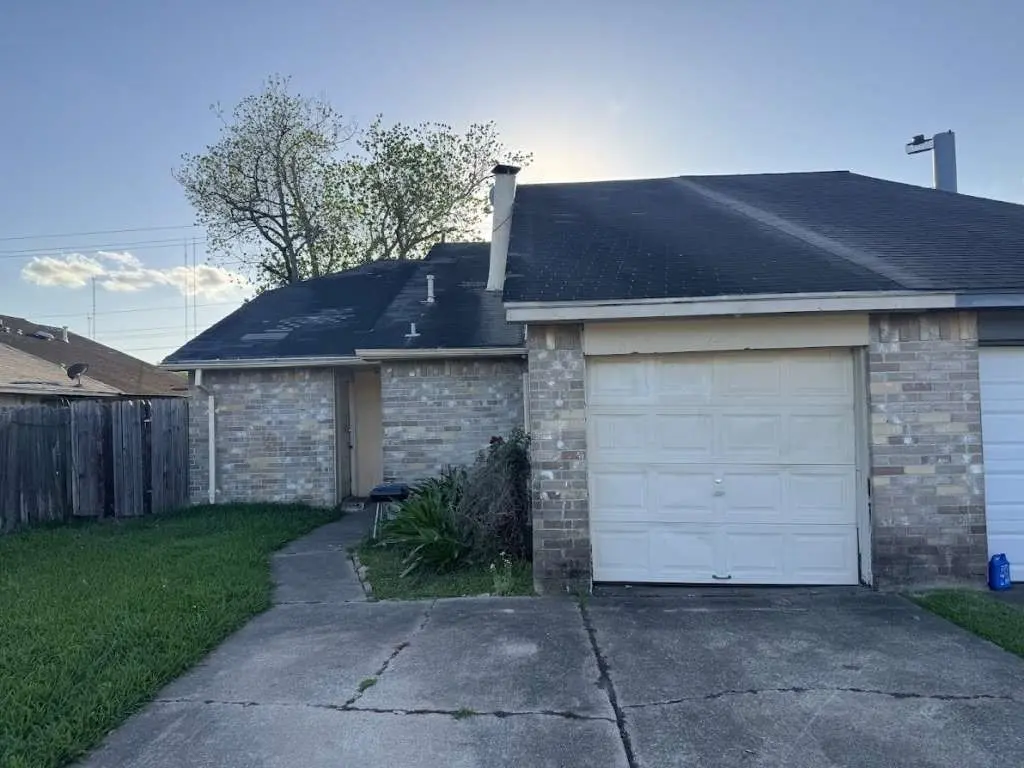
JUST LISTED! This 3-bedroom, two-bathroom, BRICK HOME located near South Post Oak Road. This property is an ideal setting for anyone looking to live in the Fort Bend area. It features an attached 2-car garage, a lovely family room with high ceilings, an exposed brick fireplace and beautiful ceramic tile flooring. The property is nestled in a great neighborhood with direct and easy access to Beltway 8. It is also near some great local restaurants, parks, shopping centers, and only 15 minutes from First Colony Mall! WE MAKE IT EASY TO OWN. This is a great opportunity! Don't wait, call us today to get more information on the owner's easy terms and smooth process that may be able to put the dee
Key facts
- Brick home
- Near parks
- 5,057 sq ft lot
Tags
Property features AI
Finance
- Other: Building area approximately 1,298 (living area provided)
- Financial info: Lease not considered
- HOA & community: HOA details not specified
Exterior
- Parking: Attached garage; 2 garage spaces
- Security: Security details not specified
- Utilities: Public water; Public sewer
- Home design: Residential property; Built in 1982; Slab foundation; Composition roof
- Construction: Construction materials: Unknown
- Exterior features: Subdivision lot; Lot approximately 0.116 acre
Interior
- Kitchen: Kitchen details not specified
- Bedrooms: Bedrooms not specified
- Flooring: Flooring details not specified
- Bathrooms: 2 full bathrooms
- Heating & cooling: Heating and cooling details not specified
- Interior features: One fireplace; 3 total rooms
- Laundry & utility: Laundry details not specified
Neighborhood map
What this means for you Summary
Snapshot
- This is a 3-bed/2.0-bath single-family listed at $159k.
Deal economics
- At list price, monthly cash flow is $279 ($3k/yr) — positive.
- The deal already cash-flows at list — no discount required.
- Meets the 1% rule at list price ($2k rent vs $159k).
- Recommended offer: $157k (1.5% below list) — sets the bar for market timing.
- Cap rate 8.4% vs local median 3.2% in Houston — top-decile yield for the area; either an underpriced asset or a hidden risk that comps aren't pricing in. Stress-test before assuming the spread holds.
Location & tenants
- Location reads 74/100 on livability (#184 in TX, #4,771 nationally) — a middle-class / working-renter tenant base. Strengths: amenities A+, cost of living A+, housing A+; Watch: crime F.
- Fort Bend ISD (suburban): math 44% / reading 53% proficiency, ranked #140 of 826 in TX (top 17%) — families likely to look elsewhere, expect single-tenant / working-renter base with shorter leases.
- Zoned schools: Blue Ridge El (math 8% / reading 17%, grade F, #4,180 of 4,322 statewide, top 97%, 263 students, 89% FRL); Christa Mcauliffe Middle (math 9% / reading 20%, grade F, #1,583 of 1,662 statewide, top 96%, 835 students, 94% FRL); Willowridge H S (math 12% / reading 29%, grade F, #1,389 of 1,632 statewide, top 86%, 1,319 students, 87% FRL) — zoned schools average 90% FRL vs 35% district-wide (55 pts higher); higher-poverty schools than district average — tighter screening recommended.
- Zoned-school proficiency averages 16% at this address vs 48% district-wide (-33 pts) — the specific schools serving this property underperform the Fort Bend ISD average; the district grade overstates school quality for this exact location.
- Market conditions: Rents rising (+1.7%/yr); 115 active listings in the ZIP; 20 comparable units currently listed for rent nearby; rentals at typical pace (median 21d on market — plan ~3-4 weeks tenant-placement turnaround); 12,093 units permitted in Fort Bend County in 2024 (815 in 5+ unit buildings).
- This rent runs 32% of the median local income ($67k/yr) — at the standard rent-burdened threshold; future hikes will face affordability resistance.
Forward outlook
- Local home prices are declining (-3.0%/yr); year-one equity from $1k of loan paydown is wiped out by about $5k of value loss. Plan a longer hold.
- Fort Bend County population projected at +75% by 2050 — long-run rental-demand tailwind backs the buy-and-hold thesis.
Negotiation context
- It's been on market 22 days — a 2% lower offer ($157k) is reasonable based on typical stale-listing flexibility.
Risks & watch-outs
- Climate carrying-cost: severe wind risk, 99% chance of damaging wind over 30y; extreme-heat days projected 7→24/yr by 2055 (HVAC capex compounding) — expect insurance premiums to compound above CPI over the hold.
Questions for the listing agent
- Is there a deadline driving the sale (1031 exchange, divorce, estate, relocation)? That informs how much negotiation room exists.
- Schools are D-rated, which usually means shorter tenancies and higher turnover. Who's the typical renter profile here, and what's been the actual vacancy rate?
- Crime grade is F in this area — have there been break-ins, vandalism, or insurance claims at this property in the last 3 years? What carrier currently insures it and at what premium?
- What's the average days-on-market for RENTAL listings here right now (not sales)? A rising rental-DOM trend means longer vacancies and softer asking-rent achievability than the comps imply.
- What's the recent tenant-quality profile in this submarket — average credit score on applications, eviction rate, late-payment / NSF rate, and stable-employment percentage? A property-management company in the area should have these aggregated.
- How much new for-sale + rental construction is in the pipeline within 1–3 miles? Heavy new supply typically softens prices + rents 12–24 months out; constrained supply supports both.
Investment metrics
- 1% rule
- 1.12% ✓
- Cap rate
- 8.40%
- Cash-on-cash
- 7.51%
- DSCR
- 1.33
- GRM
- 7.4
CMA / ARV
- ARV (on-the-fly)
- $202,488
- Comps found
- 12
Show comp detail 12 sales within ~0.75 mi
| Address | Dist | Beds/Ba | Sqft | Sold | Price | $/sf | Match |
|---|---|---|---|---|---|---|---|
| 5419 Quail Cove Ln | 0.10mi | 3/2.0 | 1,243 (-4%) | 7mo | $205,000 | $165 | 83 |
| 5422 Quail Cove Ln | 0.14mi | 3/2.0 | 1,375 (+6%) | 3mo | $215,000 | $156 | 81 |
| 16314 Edgemont Dr | 0.34mi | 3/2.0 | 1,328 (+2%) | 2mo | $180,000 | $136 | 78 |
| 5007 Ridgecreek Dr | 0.49mi | 3/2.0 | 1,336 (+3%) | 0mo | $199,000 | $149 | 72 |
| 5154 Prairie Ridge Rd | 0.42mi | 4/2.0 (+1) | 1,306 (+1%) | 4mo | $250,000 | $191 | 71 |
| 16715 Gold Bridge Ct | 0.15mi | 3/2.0 | 1,458 (+12%) | 6mo | $149,900 | $103 | 67 |
| 5606 Lyden Ridge Dr | 0.62mi | 3/2.0 | 1,258 (-3%) | 1mo | $194,900 | $155 | 65 |
| 16319 Clearmont Dr | 0.49mi | 3/2.0 | 1,177 (-9%) | 1mo | $175,000 | $149 | 61 |
| 5111 Raven Ridge Dr | 0.60mi | 3/2.0 | 1,181 (-9%) | 1mo | $175,000 | $148 | 57 |
| 4923 Cotton Ridge Trl | 0.60mi | 3/2.0 | 1,403 (+8%) | 5mo | $230,000 | $164 | 54 |
| 6431 Marinwood Dr | 0.72mi | 3/2.0 | 1,405 (+8%) | 1mo | $270,000 | $192 | 52 |
| 16511 Lazy Ridge Rd | 0.73mi | 3/2.0 | 1,168 (-10%) | 2mo | $210,000 | $180 | 47 |
Match score weights: distance 35% · size 25% · config 20% · recency 20%. Top-matched comps best support the ARV.
Projected returns pro-forma
-3.0% appreciation · 1.72% rent growth · sell at horizon
- IRR
- -6.3%
- Equity multiple
- 0.77×
- Total profit
- $-10,236
- Equity at exit
- $23,707
- IRR
- 1.7%
- Equity multiple
- 1.11×
- Total profit
- $5,061
- Equity at exit
- $13,747
Cash invested: $44,520 (down + closing). Projections, not guarantees.
Landlord ↔ Tenant lean methodology
- Overall (STATE)
- 87 Strongly Landlord-Friendly
- State Texas
- 87 Strongly Landlord-Friendly · R+5
- County
- — inherits STATE
- City
- — inherits STATE
ZIP-level market 77053
- Rents YoY
- 1.7%
- Active inventory
- 115
- Price-to-rent
- 7.4×
Monthly cashflow live
- Estimated rent
- $1,783 high interval (Pro) →
- Mortgage (P&I)
- −$834
- Tax from tax record
- −$230 /mo · $2,762/yr
- Insurance
- −$66
- HOA
- −$0
- Vacancy / Maint / Mgmt
- −$375
- Net cashflow
- $279
Break-even live
UW: 25.0% down · 7.5% · 30yr · 1.5% tax · 5.0% vac · 8.0% maint · 8.0% mgmt
Financing live
Cash to close
- Down payment
- $39,750
- Closing costs
- $4,770
- Reserves months
- —
- Total cash needed
- —
Loan-product check · same deal, 3 products live
Conventional
25% down · 7.5% · 30yr
- Down + closing
- —
- Monthly P&I
- —
- Monthly cashflow
- —
- DSCR
- —
- Eligible?
- —
Personal DTI + credit; lowest rate.
DSCR
20% down · 8.5% · 30yr
- Down + closing
- —
- Monthly P&I
- —
- Monthly cashflow
- —
- DSCR
- —
- Eligible?
- —
No personal income docs; deal must DSCR.
Hard money
10% down · 12.0% · 12mo
- Down + closing
- —
- Monthly P&I
- —
- Monthly cashflow
- —
- DSCR
- —
- Eligible?
- —
Short-term bridge; refi at stabilization.
Rent comps 20 comps
| Address | Beds | Baths | Sqft | Rent | $/sqft | DOM | Units | Dist |
|---|---|---|---|---|---|---|---|---|
| 16603 Sentinel Dr Houston, TX | 3.0 | 2.0 | 1296 | $1,799 | $1.39 | 17d | 1 | 0.08mi |
| 5030 Ridgecreek Dr Houston, TX | 3.0 | 2.0 | 1399 | $1,659 | $1.19 | 2d | 1 | 0.43mi |
| 5030 Shadowridge Dr Houston, TX | 3.0 | 2.0 | 1310 | $1,800 | $1.37 | 43d | 1 | 0.43mi |
| 16211 Corsair Rd Houston, TX | 3.0 | 2.0 | 1139 | $1,813 | $1.59 | 24d | 1 | 0.81mi |
| 16432 Chimney Rock Rd Apt 424 Houston, TX | 2.0 | 2.0 | 1026 | $1,292 | $1.26 | 5d | 1 | 0.82mi |
| 16432 Chimney Rock Rd Unit 3112 Houston, TX | 3.0 | 2.0 | 1349 | $1,481 | $1.10 | 2d | 1 | 0.82mi |
| 16432 Chimney Rock Rd Unit 16465 Houston, TX | 3.0 | 2.0 | 1349 | $1,524 | $1.13 | 43d | 1 | 0.82mi |
| 16432 Chimney Rock Rd Unit 16489 Houston, TX | 2.0 | 2.0 | 1026 | $1,317 | $1.28 | 43d | 1 | 0.82mi |
| 16432 Chimney Rock Rd Unit 2112 Houston, TX | 2.0 | 2.0 | 1026 | $1,284 | $1.25 | 2d | 1 | 0.82mi |
| 16432 Chimney Rock Rd Unit 2174 Houston, TX | 2.0 | 2.0 | 1026 | $1,327 | $1.29 | 10d | 1 | 0.82mi |
| 16432 Chimney Rock Rd Unit 3174 Houston, TX | 3.0 | 2.0 | 1349 | $1,513 | $1.12 | 10d | 1 | 0.82mi |
| 5721 Melanite Ave Houston, TX | 3.0 | 1.5 | 1634 | $1,481 | $0.91 | 19d | 1 | 1.08mi |
| 15810 Boonridge Rd Houston, TX | 3.0 | 2.0 | 1221 | $1,750 | $1.43 | 43d | 1 | 1.12mi |
| 4751 E Ridge Creek Dr Houston, TX | 4.0 | 2.5 | 1582 | $1,625 | $1.03 | 3d | 1 | 1.19mi |
| 6406 Summer Ridge Dr Missouri City, TX | 3.0 | 2.0 | 1624 | $1,958 | $1.21 | 2d | 1 | 1.40mi |
| 16006 Maladi Dr Unit 16006M Houston, TX | 4.0 | 2.0 | 1400 | $1,595 | $1.14 | 43d | 1 | 1.45mi |
| 15858 Clarke Springs Dr Houston, TX | 3.0 | 2.0 | 1232 | $1,495 | $1.21 | 22d | 1 | 1.48mi |
| 15858 Clarke Springs Dr Unit 15858C Houston, TX | 3.0 | 2.0 | 1232 | $1,495 | $1.21 | 20d | 1 | 1.48mi |
| 15871 Clarke Springs Dr Houston, TX | 3.0 | 2.0 | 1260 | $1,495 | $1.19 | 22d | 1 | 1.50mi |
| 15871 Clarke Springs Dr Unit 15871C Houston, TX | 3.0 | 2.0 | 1260 | $1,495 | $1.19 | 20d | 1 | 1.50mi |
Listing history 15 events
-
2026-06-18days on market $158,999 Active 22 DOM
-
2026-06-17days on market $158,999 Active 21 DOM
-
2026-06-16days on market $158,999 Active 20 DOM
-
2026-06-15days on market $158,999 Active 19 DOM
-
2026-06-13days on market $158,999 Active 17 DOM
-
2026-06-09days on market $158,999 Active 13 DOM
-
2026-06-08days on market $158,999 Active 12 DOM
-
2026-06-07days on market $158,999 Active 11 DOM
-
2026-06-04days on market $158,999 Active 8 DOM
-
2026-06-03days on market $158,999 Active 7 DOM
-
2026-06-02days on market $158,999 Active 6 DOM
-
2026-06-01days on market $158,999 Active 5 DOM
-
2026-05-31days on market $158,999 Active 4 DOM
-
2026-05-27$158,999 Active
-
2011-10-28soldstatus
ⓘ Source: listings_history table (triggers on properties + properties_extension) + one-shot
backfill from property_details.listing_events for pre-trigger history.
Tax reassessment forecast TX · Resets to sale price
- Current annual tax
- $2,762 · $230/mo
- Projected year-2 tax
- $2,910 · $242/mo
- Expected delta
- +$148/yr (+$12/mo · 5.4%)
ⓘ Screening estimate from a state-policy table — verify with the county assessor before closing.
Climate risk First Street
- Flood 1/10 Low FEMA zone X (unshaded) · 0% chance over 30 yrs
- Wildfire 4/10 Moderate
- Heat 9/10 Extreme 7 d/yr ≥110°F today · 24 d/yr by 30 yrs out
- Wind 9/10 Extreme 99% chance of damaging wind over 30 yrs
- Air quality 3/10 Moderate 2 unhealthy d/yr today · 3 by 30 yrs out
Nearby sold comps map
Loading sold comps map…
Walkable amenities ~0.75 mi
Loading nearby amenities…
Taxation est. · year 1
- Rental income
- $21,401
- − Mortgage interest
- −$8,906
- − Property taxes
- −$2,762
- − Insurance
- −$795
- − Repairs & maintenance
- −$1,712
- − Management
- −$1,712
- − Depreciation
- −$4,625
- Taxable income
- $888
- Est. tax owed @ 24.0%
- −$213
- After-tax cash flow
- $3,131/yr
For passive investors: Depreciation is non-cash, so a rental often shows a tax loss while cash-flowing — sheltering income. Rental losses are passive: they offset passive income freely, and up to $25,000/yr can offset ordinary (W-2) income if you actively participate and your MAGI is under $100k (phasing out to $0 by $150k); unused losses carry forward. On sale, claimed depreciation is recaptured at up to 25%, and gains may owe capital-gains tax (a 1031 exchange can defer both). Figures are a year-1 estimate at your 24.0% rate — not tax advice; consult a CPA.
Schools (NCES district)
- District
- Fort Bend ISD
- NCES district ID
- 4819650
- Math proficiency
- 44% ▼ -15.00%
- Reading proficiency
- 53% ▼ -4.00%
- Median HH income
- $82,360
- Composite
- 44.61/100
- National rank
- #2779
- State rank
- #140 of 826 in TX
Livability — Houston
- Score
- 74/100
- State rank
- #184
- US rank
- #4771
Category grades
Schools grade is shown separately in the Schools card above.
Census & demographics
- Census place
- Houston, TX
- County
- Fort Bend County · 836,777 people
- City population
- 3,226,434
- Metro
- Houston-The Woodlands-Sugar Land, TX
- Population (ZIP)
- 30,198
- Household income
- $66,510
- Rent vs Own
- Severe rent burden
- 562.0
Population outlook (Fort Bend County) Hauer SSP2
- Today (2025)
- 1,004,526 people
- By 2030
- 1,153,104 · +14.8%
- By 2040
- 1,453,718 · +44.7%
- By 2050
- 1,753,781 · +74.6%
- By 2075
- 2,455,772 · +144.5%
- By 2100
- 2,930,528 · +191.7%
Race, ethnicity, and origin ACS 2023
- Neighborhood character
- Majority Hispanic (54%)
- Race & ethnicity
- Hispanic / Latino 54% Black 41% Two or more races 22% White 3% Native American 2%
- Hispanic origin (detail)
- Mexican 39%
- Common ancestry
- Lithuanian 1% Portuguese 1% Slovak 1%
- Foreign-born
- 26% · Canada
- Languages at home
- 50% English-only · Spanish 49%
Political lean MEDSL · Fort Bend
- 2024 margin
- Toss-up / Even · D 49.5% · R 47.9% · Other 2.6%
- 2008→2024 swing
- +4.0pp toward D · 2008: -2.4pp · 2024: 1.6pp
- All cycles
- 2024: D+1.6 2020: D+10.6 2016: D+6.6 2012: R+6.8 2008: R+2.4
Not yet ingested
- Civics
- —
Market trends
- HPI YoY
- ▼ -182.09%
- Current HPI
- 266.6541
- Rent YoY
- ▲ 1.72%
- Metro
- Houston-The Woodlands-Sugar Land, TX
- State GDP YoY
- ▲ 3.95%
- F500 in state
- 110
Industry mix (Fortune 500 HQ in TX)
| Industry | F500 HQs | Revenue |
|---|---|---|
| Energy | 16 | $1,198B |
|
||
| Technology | 5 | $198B |
|
||
| Engineering / Construction | 4 | $72B |
|
||
| Energy Services | 3 | $60B |
|
||
| Utilities | 3 | $41B |
|
||
| Healthcare | 2 | $330B |
|
||
Price history
2 events — show timeline
- 2026-05-27 Listed $158,999 HARMLS
- 2011-10-28 Sold (Public Records) — Public Records
Property tax history
+7.6%/yrLatest (2025): $2,762 · +14.0% YoY. Source: county tax records.
Cash-flow waterfall
monthlySold comps — $/sqft
last 12 mo · ≤1 miLoading sold comps…