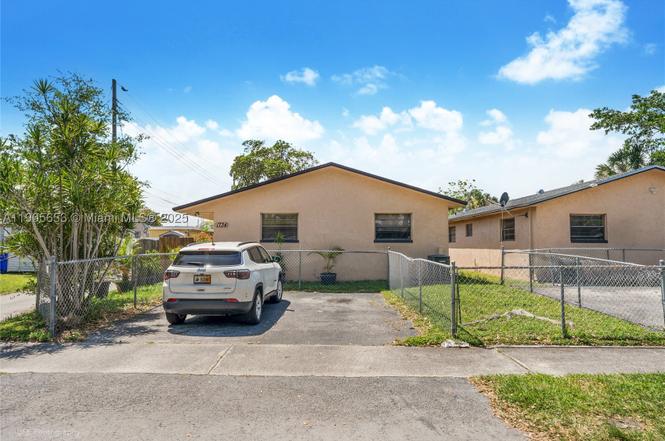
1734 N 16th Ct · Hollywood, FL
Flood risk 7/10 · Major
- FEMA flood zone
- AE
- Chance of flooding over 30 yrs
- 0.87%
- Est. flood insurance / yr
- $1,737 – $8,500
Fire risk 1/10 · Minimal
- Est. fire insurance / yr
- $947 – $1,759
Heat risk 10/10 · Severe
- Hot days now (above 104°F)
- 7 days/yr
- Hot days in 30 yrs
- 27 days/yr
Wind risk 10/10 · Severe
- Chance of severe wind over 30 yrs
- 99.0%
Air-quality risk 2/10 · Minimal
- Unhealthy air days now
- 1 days/yr
- Unhealthy air days in 30 yrs
- 2 days/yr
Risk factors via First Street. Map © Google.
Why this score? — see what drove the C+ grade
The composite is a weighted blend of 9 inputs, each scored 0–100. Each bar is that input's sub-score; the figure is the points it added to the 100-point composite (weight × sub-score).
- Cash flow +27.3/30.0
- DSCR +9.5/10.0
- ARV discount +7.5/15.0
- 1% rule +7.4/10.0
- Schools +4.1/10.0
- Livability +3.8/5.0
- Rent growth +2.6/5.0
- Condition / age +2.5/5.0
- Appreciation +0.0/10.0
$599,000
🖨 Deal sheet 📄 Offer letter ✓ Due diligence
Listing remarks
Spacious duplex featuring a 3 bed/2 bath unit and a 1 bed/1 bath unit located east of US-1—just minutes from the beach and downtown Hollywood! Both units offer ceramic tile flooring throughout, large kitchens, and are in excellent, move-in condition. Enjoy central A/C, generous layouts, and in-unit washer and dryer. Conveniently situated within walking distance to A-rated schools, shops, and public transportation. The property also offers two parking spaces and a large backyard, providing a quiet and comfortable setting in a desirable neighborhood.
Key facts
- Large kitchens
- Two parking spaces
- Large backyard
Tags
Property features AI
Finance
- Financial info: Rent includes gardener, sewer, trash collection, and water; One unit currently leased at $1,450/month
Exterior
- Parking: 2 parking spaces; Open parking
- Utilities: Public sewer; Cable available
- Home design: Single-story; Resale property; Tar and gravel roof; Block construction
- Construction: Block construction; Tar/Gravel roof
- Exterior features: Less than quarter acre lot; Zoned RM-12
Interior
- Bedrooms: 3 bedrooms
- Flooring: Tile
- Bathrooms: 2 full bathrooms
- Heating & cooling: Central heating (electric); Central air conditioning
- Interior features: Tile flooring; Ceiling fans
Neighborhood map
What this means for you Summary
Snapshot
- This is a 6-bed/4.0-bath single-family listed at $599k.
Deal economics
- At list price, monthly cash flow is $1k ($16k/yr) — positive.
- The deal already cash-flows at list — no discount required.
- Meets the 1% rule at list price ($7k rent vs $599k).
- Recommended offer: $527k (12.0% below list) — sets the bar for market timing.
- Cap rate 9.8% vs local median 3.2% in Hollywood — top-decile yield for the area; either an underpriced asset or a hidden risk that comps aren't pricing in. Stress-test before assuming the spread holds.
Location & tenants
- Location reads 76/100 on livability (#232 in FL, #3,548 nationally) — a middle-class / working-renter tenant base. Strengths: commute A+, housing A+, crime B+; Watch: amenities D.
- Broward (suburban): math 42% / reading 53% proficiency, ranked #46 of 73 in FL (top 63%) — families likely to look elsewhere, expect single-tenant / working-renter base with shorter leases.
- Market conditions: Rents flat; 589 active listings in the ZIP; 6 comparable units currently listed for rent nearby; rentals at typical pace (median 25d on market — plan ~3-4 weeks tenant-placement turnaround); 2,111 units permitted in Broward County in 2024 (1,265 in 5+ unit buildings).
- At $7,432/mo this rent would consume 158% of the median local household income ($56k/yr) (locally 3948% of renters already pay >50% of income on rent) — very limited rent-growth headroom before tenants either downsize or default.
Forward outlook
- Local home prices are declining (-3.0%/yr); year-one equity from $4k of loan paydown is wiped out by about $18k of value loss. Plan a longer hold.
- Broward County population projected at +34% by 2050 — long-run rental-demand tailwind backs the buy-and-hold thesis.
Negotiation context
- It's been on market 227 days — a 12% lower offer ($527k) is reasonable based on typical stale-listing flexibility.
- 8 sale attempts since 8y ago with the ask held roughly flat each time — persistent listings suggest the price (not the market) is what's stuck; bring a comps-based counter.
Risks & watch-outs
- Watch-outs: flood insurance adds $427/mo.
- Climate carrying-cost: in FEMA flood zone AE (mandatory federal flood insurance); severe wind risk, 99% chance of damaging wind over 30y; extreme-heat days projected 7→27/yr by 2055 (HVAC capex compounding) — expect insurance premiums to compound above CPI over the hold.
Questions for the listing agent
- It's been on market 227 days. Have you received any prior offers? Is the seller open to a 12% concession, seller financing, or rate buy-down credit?
- What's the actual annual flood-insurance premium (NFIP or private), and is the property in a SFHA with mandatory coverage?
- Why hasn't it sold? Are there any deal-killer items the seller is aware of (foundation, flood, title, zoning, code violations)?
- Is there a deadline driving the sale (1031 exchange, divorce, estate, relocation)? That informs how much negotiation room exists.
- What's the average days-on-market for RENTAL listings here right now (not sales)? A rising rental-DOM trend means longer vacancies and softer asking-rent achievability than the comps imply.
- What's the recent tenant-quality profile in this submarket — average credit score on applications, eviction rate, late-payment / NSF rate, and stable-employment percentage? A property-management company in the area should have these aggregated.
- How much new for-sale + rental construction is in the pipeline within 1–3 miles? Heavy new supply typically softens prices + rents 12–24 months out; constrained supply supports both.
Investment metrics
- 1% rule
- 1.24% ✓
- Cap rate
- 9.76%
- Cash-on-cash
- 12.39%
- DSCR
- 1.55
- GRM
- 6.7
CMA / ARV
No comps found within radius.
Projected returns pro-forma
-3.0% appreciation · 0.43% rent growth · sell at horizon
- IRR
- -5.3%
- Equity multiple
- 0.81×
- Total profit
- $-32,315
- Equity at exit
- $89,313
- IRR
- 0.7%
- Equity multiple
- 1.04×
- Total profit
- $7,372
- Equity at exit
- $51,791
Cash invested: $167,720 (down + closing). Projections, not guarantees.
Landlord ↔ Tenant lean methodology
- Overall (STATE)
- 87 Strongly Landlord-Friendly
- State Florida
- 87 Strongly Landlord-Friendly · R+3
- County
- — inherits STATE
- City
- — inherits STATE
ZIP-level market 33020
- Rents YoY
- 0.4%
- Active inventory
- 589
- Price-to-rent
- 6.7×
Monthly cashflow live
- Estimated rent
- $7,432 high interval (Pro) →
- Mortgage (P&I)
- −$3,141
- Tax est. 1.5%
- −$749 /mo · $8,985/yr
- Insurance
- −$250
- Flood insurance flood zone
- −$427 /mo · $5,118/yr
- HOA
- −$0
- Vacancy / Maint / Mgmt
- −$1,561
- Net cashflow
- $1,305
Break-even live
UW: 25.0% down · 7.5% · 30yr · 1.5% tax · 5.0% vac · 8.0% maint · 8.0% mgmt
Financing live
Cash to close
- Down payment
- $149,750
- Closing costs
- $17,970
- Reserves months
- —
- Total cash needed
- —
Loan-product check · same deal, 3 products live
Conventional
25% down · 7.5% · 30yr
- Down + closing
- —
- Monthly P&I
- —
- Monthly cashflow
- —
- DSCR
- —
- Eligible?
- —
Personal DTI + credit; lowest rate.
DSCR
20% down · 8.5% · 30yr
- Down + closing
- —
- Monthly P&I
- —
- Monthly cashflow
- —
- DSCR
- —
- Eligible?
- —
No personal income docs; deal must DSCR.
Hard money
10% down · 12.0% · 12mo
- Down + closing
- —
- Monthly P&I
- —
- Monthly cashflow
- —
- DSCR
- —
- Eligible?
- —
Short-term bridge; refi at stabilization.
Rent comps 6 comps
| Address | Beds | Baths | Sqft | Rent | $/sqft | DOM | Units | Dist |
|---|---|---|---|---|---|---|---|---|
| 1162 Hayes St Hollywood, FL | 5.0 | 3.0 | 1318 | $7,500 | $5.69 | 24d | 1 | 0.75mi |
| 1228 Johnson St Hollywood, FL | 5.0 | 3.0 | 1880 | $8,500 | $4.52 | 14d | 1 | 0.76mi |
| 39 SE 7th St Dania, FL | 5.0 | 3.0 | 1654 | $12,000 | $7.26 | 24d | 1 | 0.99mi |
| 218 SE 4th St Dania, FL | 5.0 | 3.0 | 2000 | $6,750 | $3.38 | 8d | 1 | 1.19mi |
| 1223 Jackson St Unit 1223 Hollywood, FL | 5.0 | 3.0 | 2020 | $12,000 | $5.94 | 8d | 1 | 1.33mi |
| 1640 Jefferson St Hollywood, FL | 5.0 | 2.0 | 1750 | $8,995 | $5.14 | 24d | 1 | 1.46mi |
Listing history 30 events
-
2026-06-18days on market $599,000 Active 227 DOM
-
2026-06-17days on market $599,000 Active 226 DOM
-
2026-06-16days on market $599,000 Active 225 DOM
-
2026-06-15days on market $599,000 Active 224 DOM
-
2026-06-13days on market $599,000 Active 222 DOM
-
2026-06-09days on market $599,000 Active 218 DOM
-
2026-06-07days on market $599,000 Active 216 DOM
-
2026-06-04days on market $599,000 Active 213 DOM
-
2026-06-03days on market $599,000 Active 212 DOM
-
2026-06-02days on market $599,000 Active 211 DOM
-
2026-06-01days on market $599,000 Active 210 DOM
-
2026-05-31days on market $599,000 Active 209 DOM
-
2025-10-31$599,000 Active
-
2024-12-26status Active
-
2024-09-26status Active
-
2024-09-26historical
-
2024-09-26historical
-
2024-09-26historical
-
2024-06-25$695,000 Active
-
2024-06-25historical
-
2024-02-21$695,000 Active
-
2023-07-03historical
-
2022-07-04$750,000 Active
-
2018-06-23status Pending
-
2018-06-20historical
-
2018-05-01status Active
-
2018-04-15status Backup Contract
-
2018-04-08price $375,000
-
2018-01-09price $385,000
-
2018-01-06$410,000 Active
ⓘ Source: listings_history table (triggers on properties + properties_extension) + one-shot
backfill from property_details.listing_events for pre-trigger history.
Climate risk First Street
- Flood 7/10 Severe FEMA zone AE · 87% chance over 30 yrs
- Wildfire 1/10 Low
- Heat 10/10 Extreme 7 d/yr ≥104°F today · 27 d/yr by 30 yrs out
- Wind 10/10 Extreme 99% chance of damaging wind over 30 yrs
- Air quality 2/10 Low 1 unhealthy d/yr today · 2 by 30 yrs out
Nearby sold comps map
Loading sold comps map…
Walkable amenities ~0.75 mi
Loading nearby amenities…
Taxation est. · year 1
- Rental income
- $89,180
- − Mortgage interest
- −$33,553
- − Property taxes
- −$8,985
- − Insurance
- −$8,114
- − Repairs & maintenance
- −$7,134
- − Management
- −$7,134
- − Depreciation
- −$17,425
- Taxable income
- $6,834
- Est. tax owed @ 24.0%
- −$1,640
- After-tax cash flow
- $14,019/yr
For passive investors: Depreciation is non-cash, so a rental often shows a tax loss while cash-flowing — sheltering income. Rental losses are passive: they offset passive income freely, and up to $25,000/yr can offset ordinary (W-2) income if you actively participate and your MAGI is under $100k (phasing out to $0 by $150k); unused losses carry forward. On sale, claimed depreciation is recaptured at up to 25%, and gains may owe capital-gains tax (a 1031 exchange can defer both). Figures are a year-1 estimate at your 24.0% rate — not tax advice; consult a CPA.
Schools (NCES district)
- District
- Broward
- NCES district ID
- 1200180
- Math proficiency
- 42% ▼ -18.00%
- Reading proficiency
- 53% ▼ -5.00%
- Median HH income
- $52,139
- Composite
- 40.88/100
- National rank
- #3621
- State rank
- #46 of 73 in FL
Livability — Hollywood
- Score
- 76/100
- State rank
- #232
- US rank
- #3548
Category grades
Schools grade is shown separately in the Schools card above.
Census & demographics
- Census place
- Hollywood, FL
- County
- Broward County · 1,963,430 people
- City population
- 109,079
- Metro
- Miami-Fort Lauderdale-Pompano Beach, FL
- Population (ZIP)
- 46,322
- Household income
- $56,473
- Rent vs Own
- Severe rent burden
- 3948.0
Population outlook (Broward County) Hauer SSP2
- Today (2025)
- 2,207,033 people
- By 2030
- 2,360,704 · +7.0%
- By 2040
- 2,661,208 · +20.6%
- By 2050
- 2,946,698 · +33.5%
- By 2075
- 3,602,273 · +63.2%
- By 2100
- 3,970,984 · +79.9%
Race, ethnicity, and origin ACS 2023
- Neighborhood character
- Diverse neighborhood (Simpson 0.68)
- Race & ethnicity
- Hispanic / Latino 43% Two or more races 31% White 28% Black 24% Asian 1%
- Hispanic origin (detail)
- Mexican 1% Puerto Rican 4% Cuban 9% Dominican 3% Salvadoran 3%
- Common ancestry
- Hispanic 5% Lithuanian 2% Scotch-Irish 1%
- Foreign-born
- 41% · Canada, Jamaica, Dominican Republic
- Languages at home
- 48% English-only · Spanish 38% French/Haitian/Cajun 6% Russian/Polish/Slavic 2%
Political lean MEDSL · Broward
- 2024 margin
- D (+17.0) · D 58.0% · R 41.0%
- 2008→2024 swing
- -17.8pp toward R · 2008: 34.7pp · 2024: 17.0pp
- All cycles
- 2024: D+17.0 2020: D+29.8 2016: D+35.0 2012: D+34.9 2008: D+34.7
Not yet ingested
- Civics
- —
Market trends
- HPI YoY
- ▼ -406.34%
- Current HPI
- 524.7664
- Rent YoY
- ▲ 0.43%
- Metro
- Miami-Fort Lauderdale-Pompano Beach, FL
- State GDP YoY
- ▲ 3.28%
- F500 in state
- 36
Industry mix (Fortune 500 HQ in FL)
| Industry | F500 HQs | Revenue |
|---|---|---|
| Industrial Technology | 2 | $29B |
|
||
| Insurance | 2 | $17B |
|
||
| Retail | 1 | $60B |
|
||
| Technology Distribution | 1 | $58B |
|
||
| Homebuilding | 1 | $35B |
|
||
| Technology Manufacturing | 1 | $35B |
|
||
Price history
+46.1% since first listed18 events — show timeline
- 2025-10-31 Listed $599,000 MARMLS
- 2024-12-26 Relisted — MARMLS
- 2024-09-26 Relisted — MARMLS
- 2024-09-26 Listing Removed — MARMLS
- 2024-09-26 Listing Removed — MARMLS
- 2024-09-26 Listing Removed — MARMLS
- 2024-06-25 Listing Removed — MARMLS
- 2024-06-25 Listed $695,000 MARMLS
- 2024-02-21 Listed $695,000 MARMLS
- 2023-07-03 Listing Removed — MARMLS
- 2022-07-04 Listed $750,000 MARMLS
- 2018-06-23 Pending — MARMLS
- 2018-06-20 Listing Removed — MARMLS
- 2018-05-01 Relisted — MARMLS
- 2018-04-15 Pending — MARMLS
- 2018-04-08 Price Changed $375,000 MARMLS
- 2018-01-09 Price Changed $385,000 MARMLS
- 2018-01-06 Listed $410,000 MARMLS
Cash-flow waterfall
monthlySold comps — $/sqft
last 12 mo · ≤1 miLoading sold comps…