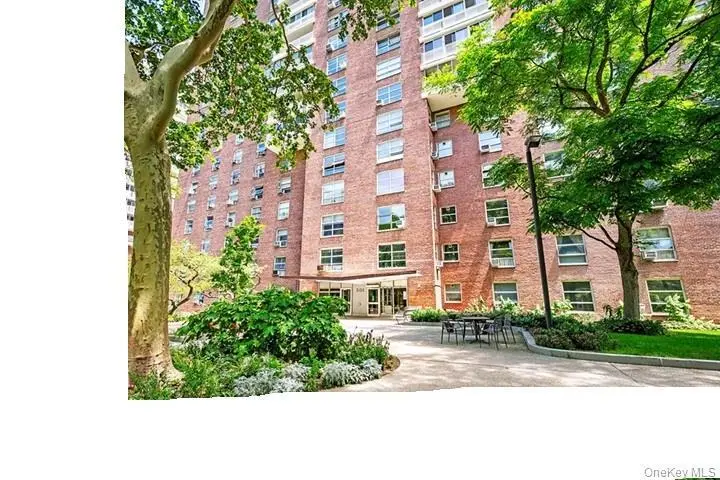
501 W 123rd St Unit 7H · New York, NY
Flood risk 1/10 · Minimal
- FEMA flood zone
- X (unshaded)
- Chance of flooding over 30 yrs
- 0.0%
- Est. flood insurance / yr
- $507 – $1,088
Fire risk 1/10 · Minimal
- Est. fire insurance / yr
- $691 – $1,283
Heat risk 6/10 · Moderate
- Hot days now (above 99°F)
- 7 days/yr
- Hot days in 30 yrs
- 15 days/yr
Wind risk 6/10 · Moderate
- Chance of severe wind over 30 yrs
- 27.0%
Air-quality risk 4/10 · Minor
- Unhealthy air days now
- 5 days/yr
- Unhealthy air days in 30 yrs
- 6 days/yr
Risk factors via First Street. Map © Google.
Why this score? — see what drove the F grade
The composite is a weighted blend of 9 inputs, each scored 0–100. Each bar is that input's sub-score; the figure is the points it added to the 100-point composite (weight × sub-score).
- ARV discount +7.5/15.0
- Schools +5.0/10.0
- Appreciation +4.4/10.0
- Livability +3.8/5.0
- Condition / age +3.8/5.0
- Rent growth +3.2/5.0
- 1% rule +2.7/10.0
- Cash flow +0.6/30.0
- DSCR +0.0/10.0
$495,000
🖨 Deal sheet (PDF) 📄 Offer letter ✓ Due diligence
Listing remarks
A sunlit 1BR apt with private patio with a great park view and much amenities. Superb building management. Generous size of bedroom and living room with a eat-in kitchen. Many closets. Laundry, gym, playroom, day care facilities in the building. Close to all. Sold as-is.
Key facts
- Built 1956
- Listed 30 days
Property features AI
Finance
- HOA & community: Fitness center in building; Nearby park
Exterior
- Parking: On-street parking
- Utilities: Con-Edison electric; Public sewer; Cable connected; Electricity connected; Natural gas connected; Sewer connected; Public trash collection; Water connected
- Home design: Stock cooperative; One level (entry level 1); Located on 6th floor or higher
- Construction: Brick construction
- Exterior features: Brick construction; Not waterfront
Interior
- Kitchen: Cooktop; Dishwasher; Refrigerator; Eat-in kitchen; Open kitchen; Breakfast bar; Walk-through kitchen
- Bedrooms: First-floor bedroom
- Flooring: Hardwood floors
- Bathrooms: One full bathroom
- Heating & cooling: Baseboard heating; Wall/window AC unit(s)
- Interior features: First-floor bedroom; Breakfast bar; Eat-in kitchen; Elevator access; Primary bathroom; Open kitchen; Walk-through kitchen; Library/den; Covered terrace/porch; Pets allowed
- Laundry & utility: Laundry in basement
Neighborhood map
What this means for you Summary
Snapshot
- This is a 1-bed/1.0-bath condo listed at $495k. Condition is rated good.
Deal economics
- At list price, monthly cash flow is $-2k ($-26k/yr) — negative.
- To cash-flow at today's rent, offer at most $437k (11.7% below list).
- To meet the 1% rule (rent ≥ 1% of price), the offer needs to be $383k (22.7% below list).
- Recommended offer: $383k (22.7% below list) — sets the bar for 1% rule.
- Cap rate 1.1% vs local median 2.6% in New York — below-typical yield; the buyer is paying a premium for something (appreciation thesis, condition, location) that the cap rate doesn't capture.
Location & tenants
- Location reads 75/100 on livability (#268 in NY, #4,188 nationally) — a middle-class / working-renter tenant base. Strengths: amenities A+, commute A+, health & safety A; Watch: crime F, cost of living F.
- Market conditions: Rents rising (+2.7%/yr); 177 active listings in the ZIP; 23 comparable units currently listed for rent nearby; rentals leasing fast (median 3d on market — plan ~1-2 weeks tenant-placement turnaround); 4,467 units permitted in New York County in 2024 (4,463 in 5+ unit buildings).
- At $3,825/mo this rent would consume 77% of the median local household income ($60k/yr) (locally 5635% of renters already pay >50% of income on rent) — very limited rent-growth headroom before tenants either downsize or default.
Forward outlook
- Local home prices are declining (-1.3%/yr); year-one equity from $3k of loan paydown is wiped out by about $6k of value loss. Plan a longer hold.
- New York County population projected at +21% by 2050 — long-run rental-demand tailwind backs the buy-and-hold thesis.
Negotiation context
- It's been on market 31 days — a 3% lower offer ($480k) is reasonable based on typical stale-listing flexibility.
Risks & watch-outs
- Watch-outs: HOA is 45% of rent; built in 1956 — expect roof / HVAC / electrical / plumbing capex.
- Climate carrying-cost: major wind risk, 27% chance of damaging wind over 30y; extreme-heat days projected 7→15/yr by 2055 (HVAC capex compounding) — expect insurance premiums to compound above CPI over the hold.
Questions for the listing agent
- What do current leases actually rent for vs. the listed asking? Can we see a recent rent roll and the last 12 months of T-12 income?
- It's been on market 31 days. Have you received any prior offers? Is the seller open to a 23% concession, seller financing, or rate buy-down credit?
- Built in 1956 — when were the roof, HVAC, electrical panel, plumbing, and water heater last replaced?
- What does the HOA fee cover, when was the last increase, and are there any pending special assessments or reserve-fund shortfalls?
- Any open or pending special assessments — roof, HVAC, plumbing, elevator, façade? What's the per-unit balance and payoff schedule, and is the seller paying it off at close or rolling it to the buyer?
- Is there a deadline driving the sale (1031 exchange, divorce, estate, relocation)? That informs how much negotiation room exists.
- Schools are B-rated — typically a magnet for longer-tenancy family renters. What's the average tenant stay here, and is there a school-zone premium baked into asking?
- Crime grade is F in this area — have there been break-ins, vandalism, or insurance claims at this property in the last 3 years? What carrier currently insures it and at what premium?
- The area grade is low — what's the realistic commute time and amenity access for the typical tenant pool here? Any planned neighborhood developments (good or bad) we should know about?
- What's the average days-on-market for RENTAL listings here right now (not sales)? A rising rental-DOM trend means longer vacancies and softer asking-rent achievability than the comps imply.
- What's the recent tenant-quality profile in this submarket — average credit score on applications, eviction rate, late-payment / NSF rate, and stable-employment percentage? A property-management company in the area should have these aggregated.
- How much new apartment / multifamily construction is in the pipeline within 1–3 miles? Heavy new supply (>2% of stock underway) typically softens rents 12–24 months out; light construction supports rent growth.
Investment metrics
- 1% rule
- 0.77% ✗
- Cap rate
- 1.11%
- Cash-on-cash
- -18.52%
- DSCR
- 0.18
- GRM
- 10.8
CMA / ARV
No comps found within radius.
Projected returns pro-forma
-1.26% appreciation · 2.71% rent growth · sell at horizon
- IRR
- -32.6%
- Equity multiple
- -0.29×
- Total profit
- $-179,267
- Equity at exit
- $113,343
- IRR
- -28.0%
- Equity multiple
- -1.14×
- Total profit
- $-297,052
- Equity at exit
- $113,859
Cash invested: $138,600 (down + closing). Projections, not guarantees.
Landlord ↔ Tenant lean methodology
- Overall (CITY)
- 0 Strongly Tenant-Friendly
- State New York
- 15 Strongly Tenant-Friendly · D+10
- County
- — inherits STATE
- City New York
- 0 Strongly Tenant-Friendly · D+34
ZIP-level market 10027
- Home prices YoY
- -0.3%
- Rents YoY
- 2.7%
- Active inventory
- 177
- Price-to-rent
- 10.8×
Monthly cashflow live
- Estimated rent
- $3,825 medium interval (Pro) →
- Mortgage (P&I)
- −$2,596
- Tax est. 1.5%
- −$619 /mo · $7,425/yr
- Insurance
- −$206
- HOA est. from 1 same-building comp
- −$1,740
- Vacancy / Maint / Mgmt
- −$803
- Net cashflow
- $-2,139
Break-even live
Sensitivity live
| Price | -10% $-1,797 | -5% $-1,968 | +0% $-2,139 | +5% $-2,310 | +10% $-2,481 |
|---|---|---|---|---|---|
| Rent | -10% $-2,441 | -5% $-2,290 | +0% $-2,139 | +5% $-1,988 | +10% $-1,837 |
| Rate | -1.0pp $-1,890 | -0.5pp $-2,013 | base $-2,139 | +0.5pp $-2,267 | +1.0pp $-2,398 |
UW: 25.0% down · 7.5% · 30yr · 1.5% tax · 5.0% vac · 8.0% maint · 8.0% mgmt
Financing live
Cash to close
- Down payment
- $123,750
- Closing costs
- $14,850
- Reserves months
- —
- Total cash needed
- —
Loan-product check · same deal, 3 products live
Conventional
25% down · 7.5% · 30yr
- Down + closing
- —
- Monthly P&I
- —
- Monthly cashflow
- —
- DSCR
- —
- Eligible?
- —
Personal DTI + credit; lowest rate.
DSCR
20% down · 8.5% · 30yr
- Down + closing
- —
- Monthly P&I
- —
- Monthly cashflow
- —
- DSCR
- —
- Eligible?
- —
No personal income docs; deal must DSCR.
Hard money
10% down · 12.0% · 12mo
- Down + closing
- —
- Monthly P&I
- —
- Monthly cashflow
- —
- DSCR
- —
- Eligible?
- —
Short-term bridge; refi at stabilization.
Rent comps 23 comps
| Address | Beds | Baths | Sqft | Rent | $/sqft | DOM | Units | Dist |
|---|---|---|---|---|---|---|---|---|
| 543 W 122nd St New York, NY | 2.0 | 1.0–2.0 | 1057 | $7,948 | $7.52 | 3d | 7 | 0.10mi |
| 230 W 126th St Unit 20C New York, NY | 2.0 | 1.0 | 860 | $4,555 | $5.30 | 25d | 1 | 0.47mi |
| 30 Morningside Dr #2096 New York, NY | 1.0–2.0 | 1.0–2.0 | 780 | $5,550 | $7.11 | 0d | 2 | 0.54mi |
| 1 Morningside Dr New York, NY | 3.0 | 1.0–2.0 | 1655 | $6,307 | $3.81 | 0d | 1 | 0.69mi |
| 132 W 134th St New York, NY | 2.0 | 1.0 | 750 | $4,500 | $6.00 | 25d | 1 | 0.78mi |
| 308 W 107th St Unit 1239985P New York, NY | 1.0 | 1.0 | 559 | $5,497 | $9.83 | 0d | 1 | 0.87mi |
| 915 W End Ave #1020 New York, NY | 1.0–3.0 | 1.0–2.0 | 851 | $6,070 | $7.13 | 0d | 2 | 0.97mi |
| 202 W 102nd St Unit 1053014P New York, NY | 2.0 | 2.0 | 538 | $10,000 | $18.59 | 23d | 1 | 1.11mi |
| 420 Central Park W Unit 6K New York, NY | 2.0 | 2.0 | 1060 | $8,000 | $7.55 | 23d | 1 | 1.14mi |
| 814 Amsterdam Ave #1019 New York, NY | 1.0–2.0 | 1.0–2.0 | 800 | $4,800 | $6.00 | 25d | 2 | 1.20mi |
| 100 River Mews Ln Edgewater, NJ | 3.0 | 1.0–2.0 | 988 | $3,670 | $3.71 | 0d | 1 | 1.23mi |
| 77 E 110th St Unit 1322508P New York, NY | 2.0 | 1.5 | 990 | $6,360 | $6.42 | 25d | 1 | 1.27mi |
| 788 Columbus Ave #1323 New York, NY | 1.0–3.0 | 1.0–1.5 | 900 | $3,660 | $4.07 | 25d | 2 | 1.28mi |
| 100 Tower Dr Edgewater, NJ | 1.0–3.0 | 1.0–2.5 | 1290 | $3,582 | $2.78 | 0d | 10 | 1.28mi |
| 808 Columbus Ave New York, NY | 2.0 | 1.0–2.0 | 773 | $6,906 | $8.93 | 0d | 30 | 1.28mi |
| 309 W 97th St Unit 5N New York, NY | 2.0 | 2.0 | 900 | $5,495 | $6.11 | 25d | 1 | 1.35mi |
| 160 W 97th St #1101 New York, NY | 2.0 | 1.0 | 850 | $6,050 | $7.12 | 15d | 1 | 1.36mi |
| 50 W 97th St #1739 New York, NY | 2.0 | 1.0 | 800 | $6,560 | $8.20 | 7d | 1 | 1.39mi |
| 2413 3rd Ave Bronx, NY | 1.0–3.0 | 1.0–2.0 | 857 | $2,953 | $3.44 | 0d | 21 | 1.41mi |
| 105 Lighthouse Ter Edgewater, NJ | 1.0–2.0 | 1.5–2.5 | 1000 | $2,939 | $2.94 | 0d | 7 | 1.44mi |
| 5 Lincoln Ave Bronx, NY | 1.0–3.0 | 1.0–2.5 | 1011 | $2,856 | $2.82 | 0d | 183 | 1.47mi |
| 255 W 94th St #686 New York, NY | 1.0–2.0 | 1.0–2.0 | 750 | $6,210 | $8.28 | 0d | 2 | 1.48mi |
| 70 W 95th St New York, NY | 1.0–4.0 | 1.0–2.0 | 1095 | $9,999 | $9.13 | 18d | 1 | 1.49mi |
HOA detail condo
- Monthly dues
- $0 · $0/yr
- Likely covers
- gym
- Assessments
- None detected in remarks — confirm with the listing agent.
Listing history 16 events
-
2026-06-21days on market $495,000 Active 31 DOM
-
2026-06-18days on market $495,000 Active 28 DOM
-
2026-06-17days on market $495,000 Active 27 DOM
-
2026-06-16days on market $495,000 Active 26 DOM
-
2026-06-15days on market $495,000 Active 25 DOM
-
2026-06-13days on market $495,000 Active 23 DOM
-
2026-06-10days on market $495,000 Active 19 DOM
-
2026-06-08days on market $495,000 Active 18 DOM
-
2026-06-08days on market $495,000 Active 17 DOM
-
2026-06-04days on market $495,000 Active 14 DOM
-
2026-06-03days on market $495,000 Active 13 DOM
-
2026-06-02days on market $495,000 Active 12 DOM
-
2026-06-01days on market $495,000 Active 11 DOM
-
2026-05-31days on market $495,000 Active 10 DOM
-
2026-05-22$495,000 Active
-
2026-05-10historical $495,000
ⓘ Source: listings_history table (triggers on properties + properties_extension) + one-shot
backfill from property_details.listing_events for pre-trigger history.
Climate risk First Street
- Flood 1/10 Low FEMA zone X (unshaded) · 0% chance over 30 yrs
- Wildfire 1/10 Low
- Heat 6/10 Major 7 d/yr ≥99°F today · 15 d/yr by 30 yrs out
- Wind 6/10 Major 27% chance of damaging wind over 30 yrs
- Air quality 4/10 Moderate 5 unhealthy d/yr today · 6 by 30 yrs out
Nearby sold comps map
Loading sold comps map…
Walkable amenities ~0.75 mi
Loading nearby amenities…
Taxation est. · year 1
- Rental income
- $45,901
- − Mortgage interest
- −$27,728
- − Property taxes
- −$7,425
- − Insurance
- −$2,475
- − Repairs & maintenance
- −$3,672
- − Management
- −$3,672
- − HOA
- −$20,880
- − Depreciation
- −$14,400
- Taxable loss
- −$34,351
- Est. tax savings @ 24.0%
- +$8,244
- After-tax cash flow
- $-17,424/yr
For passive investors: Depreciation is non-cash, so a rental often shows a tax loss while cash-flowing — sheltering income. Rental losses are passive: they offset passive income freely, and up to $25,000/yr can offset ordinary (W-2) income if you actively participate and your MAGI is under $100k (phasing out to $0 by $150k); unused losses carry forward. On sale, claimed depreciation is recaptured at up to 25%, and gains may owe capital-gains tax (a 1031 exchange can defer both). Figures are a year-1 estimate at your 24.0% rate — not tax advice; consult a CPA.
Condition & rehab AI · 8 photos
A sunlit 1BR apartment with a private patio and great park view, in a well-maintained building with amenities. Minor updates to kitchen and bathroom would enhance its resale value.
Repairs flagged
- Minor kitchen backsplash — dated appearance
- Minor bathroom fixtures — dated appearance
Value-add opportunities
- Resale update kitchen backsplash — modernizes kitchen
- Resale update bathroom fixtures — modernizes bathroom
- Both paint interior walls — enhances interior aesthetics
Renovation cost estimate screening
| Repair item | Severity | Est. cost |
|---|---|---|
| kitchen backsplash · dated appearance | Minor | $500–3,000 |
| bathroom fixtures · dated appearance | Minor | $500–3,000 |
| Total estimated repair cost · 2 items | $1,000–6,000 |
Value-add ROI direction
- Resale update kitchen backsplash — modernizes kitchen ↑
- Resale update bathroom fixtures — modernizes bathroom ↑
- Both paint interior walls — enhances interior aesthetics ↑
ⓘ Cost ranges are severity-bucket heuristics (US national rule-of-thumb). Get contractor quotes + a written scope before underwriting a rehab budget.
Schools (NCES district)
No district data.
Livability — New York
- Score
- 75/100
- State rank
- #268
- US rank
- #4188
Category grades
Schools grade is shown separately in the Schools card above.
Census & demographics
- Census place
- New York, NY
- County
- New York County · 1,599,927 people
- City population
- 7,731,280
- Metro
- New York-Newark-Jersey City, NY-NJ-PA
- Population (ZIP)
- 63,885
- Household income
- $59,587
- Rent vs Own
- Severe rent burden
- 5635.0
Population outlook (New York County) Hauer SSP2
- Today (2025)
- 1,825,725 people
- By 2030
- 1,904,611 · +4.3%
- By 2040
- 2,052,719 · +12.4%
- By 2050
- 2,206,601 · +20.9%
- By 2075
- 2,509,427 · +37.4%
- By 2100
- 2,702,933 · +48.0%
Race, ethnicity, and origin ACS 2023
- Neighborhood character
- Highly diverse neighborhood (Simpson 0.75)
- Race & ethnicity
- Black 33% White 27% Hispanic / Latino 24% Asian 10% Two or more races 9%
- Hispanic origin (detail)
- Mexican 3% Puerto Rican 5% Dominican 10%
- Common ancestry
- Lithuanian 1% Scotch-Irish 1% Romanian 1%
- Foreign-born
- 26% · Canada, China, South Korea
- Languages at home
- 61% English-only · Spanish 18% French/Haitian/Cajun 5% Chinese 4%
Political lean MEDSL · New York
- 2024 margin
- Solid D (+64.8) · D 82.4% · R 17.6%
- 2008→2024 swing
- -7.4pp toward R · 2008: 72.2pp · 2024: 64.8pp
- All cycles
- 2024: D+64.8 2020: D+74.5 2016: D+77.2 2012: D+69.6 2008: D+72.2
Not yet ingested
- Civics
- —
Market trends
- HPI YoY
- ▼ -1.26%
- Current HPI
- 414.8385
- Rent YoY
- ▲ 2.71%
- Metro
- New York-Newark-Jersey City, NY-NJ-PA
- State GDP YoY
- ▲ 2.60%
- F500 in state
- 92
Industry mix (Fortune 500 HQ in NY)
| Industry | F500 HQs | Revenue |
|---|---|---|
| Financial Services | 10 | $950B |
|
||
| Consumer Goods | 9 | $162B |
|
||
| Insurance | 4 | $225B |
|
||
| Telecommunications | 2 | $144B |
|
||
| Pharmaceuticals | 2 | $112B |
|
||
| Media / Entertainment | 2 | $69B |
|
||
Price history
+0.0% since first listed2 events — show timeline
- 2026-05-22 Listed $495,000 OneKey® MLS as Distributed by MLS Grid
- 2026-05-10 Coming Soon $495,000 OneKey® MLS as Distributed by MLS Grid
Cash-flow waterfall
monthlySold comps — $/sqft
last 12 mo · ≤1 miLoading sold comps…