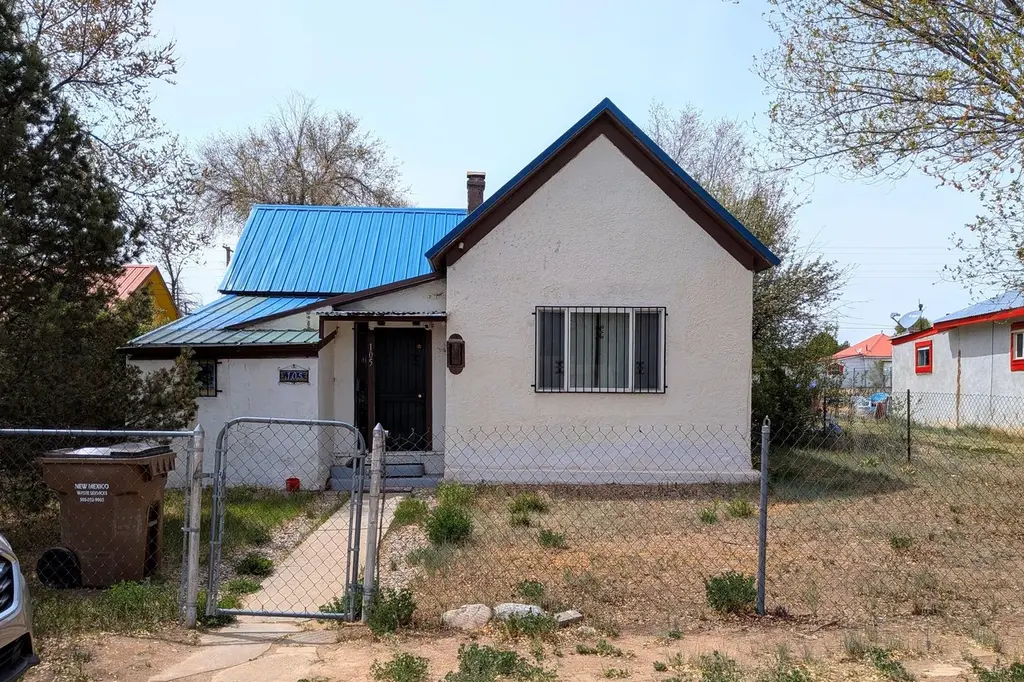
105 S Roosevelt Ave · Mountainair, NM
Flood risk 1/10 · Minimal
- FEMA flood zone
- —
- Chance of flooding over 30 yrs
- 0.0%
- Est. flood insurance / yr
- —
Fire risk 6/10 · Moderate
- Est. fire insurance / yr
- $706 – $1,312
Heat risk 3/10 · Minor
- Hot days now (above 91°F)
- 4 days/yr
- Hot days in 30 yrs
- 12 days/yr
Wind risk 1/10 · Minimal
- Chance of severe wind over 30 yrs
- —
Air-quality risk 1/10 · Minimal
- Unhealthy air days now
- 0 days/yr
- Unhealthy air days in 30 yrs
- 0 days/yr
Risk factors via First Street. Map © Google.
Why this score? — see what drove the C- grade
The composite is a weighted blend of 9 inputs, each scored 0–100. Each bar is that input's sub-score; the figure is the points it added to the 100-point composite (weight × sub-score).
- ARV discount +15.0/15.0
- Cash flow +13.0/30.0
- Appreciation +6.9/10.0
- DSCR +3.9/10.0
- Livability +2.8/5.0
- Rent growth +2.5/5.0
- Condition / age +2.5/5.0
- 1% rule +2.4/10.0
- Schools +2.1/10.0
$125,000
🖨 Deal sheet 📄 Offer letter ✓ Due diligence
Listing remarks MLS
Come see this charming 1940's bungalow with vintage charm and a range of modern upgrades. This quaint home boasts 2 bedroomsand 1 bathroom. Situated on a spacious lot, this property offers ample outdoor space complete with a shed and convenient back yard access. The proximity to Main St. allows for so many possibilities such as an art studio, vacation rental etc. In the last 5 years the interior has been thoughtfully updated with new electricalwiring, plumbing, gas lines and radiant heating, ensuring comfort and efficiency year round. Whether you're seeking a starter home or a tranquil retreat, this home offers the perfect blend of historic charm and modern convenience. Don't miss the opportunity to make this delightful property your own.
Key facts
- Shed
- Modern upgrades
- Vintage charm
Tags
Neighborhood map
What this means for you Summary
Snapshot
- This is a 2-bed/1.0-bath other listed at $125k.
Deal economics
- At list price, monthly cash flow is $-7 ($-86/yr) — negative.
- To cash-flow at today's rent, offer at most $124k (1.0% below list).
- To meet the 1% rule (rent ≥ 1% of price), the offer needs to be $92k (26.4% below list).
- Recommended offer: $92k (26.4% below list) — sets the bar for 1% rule.
Location & tenants
- Location reads 56/100 on livability (#188 in NM) — a working-class tenant base; expect higher turnover. Strengths: cost of living A+, housing A; Watch: amenities C-, schools F, crime F.
- Mountainair Public Schools (rural): math 25% / reading 25% proficiency, ranked #25 of 29 in NM (top 86%) — low school quality limits family demand, transient renter base, plan for 1-2y turnover; 77% free/reduced lunch — lower-income household profile, screen leases tightly.
- Market conditions: 52 active listings in the ZIP.
Forward outlook
- In year one you build about $6k of equity ($864 loan paydown + $5k appreciation (3.9% local appreciation)).
- Torrance County population projected at -29% by 2050 — secular population decline; favor cash flow + early exit over multi-decade hold.
- At projected returns (3.9% appreciation + 3.0% rent growth), your $35k cash investment doubles in ~6 years — after that, you're playing with house money.
- By year 6, paydown + projected appreciation supports a ~$30k cash-out refi (75% LTV) — recoverable capital for the next deal without selling this one.
Negotiation context
- It's been on market 72 days — a 6% lower offer ($118k) is reasonable based on typical stale-listing flexibility.
- 3 sale attempts since 8y ago with the ask held roughly flat each time — persistent listings suggest the price (not the market) is what's stuck; bring a comps-based counter.
Risks & watch-outs
- Watch-outs: built in 1940 — expect roof / HVAC / electrical / plumbing capex.
- Climate carrying-cost: major wildfire risk — expect insurance premiums to compound above CPI over the hold.
Questions for the listing agent
- What do current leases actually rent for vs. the listed asking? Can we see a recent rent roll and the last 12 months of T-12 income?
- It's been on market 72 days. Have you received any prior offers? Is the seller open to a 26% concession, seller financing, or rate buy-down credit?
- Built in 1940 — when were the roof, HVAC, electrical panel, plumbing, and water heater last replaced?
- Why hasn't it sold? Are there any deal-killer items the seller is aware of (foundation, flood, title, zoning, code violations)?
- Is there a deadline driving the sale (1031 exchange, divorce, estate, relocation)? That informs how much negotiation room exists.
- Schools are F-rated, which usually means shorter tenancies and higher turnover. Who's the typical renter profile here, and what's been the actual vacancy rate?
- Crime grade is F in this area — have there been break-ins, vandalism, or insurance claims at this property in the last 3 years? What carrier currently insures it and at what premium?
- What's the average days-on-market for RENTAL listings here right now (not sales)? A rising rental-DOM trend means longer vacancies and softer asking-rent achievability than the comps imply.
- What's the recent tenant-quality profile in this submarket — average credit score on applications, eviction rate, late-payment / NSF rate, and stable-employment percentage? A property-management company in the area should have these aggregated.
- How much new for-sale + rental construction is in the pipeline within 1–3 miles? Heavy new supply typically softens prices + rents 12–24 months out; constrained supply supports both.
Investment metrics
- 1% rule
- 0.74% ✗
- Cap rate
- 6.22%
- Cash-on-cash
- -0.24%
- DSCR
- 0.99
- GRM
- 11.3
CMA / ARV
- ARV (median comp)
- $161,808
- List price
- $125,000
- Delta
- -22.75%
- Verdict
- UNDERPRICED
- Comps
- 1 within 2.0 mi
Projected returns pro-forma
3.89% appreciation · 3.0% rent growth · sell at horizon
- IRR
- 9.7%
- Equity multiple
- 1.59×
- Total profit
- $20,516
- Equity at exit
- $62,565
- IRR
- 11.6%
- Equity multiple
- 2.90×
- Total profit
- $66,484
- Equity at exit
- $101,688
Cash invested: $35,000 (down + closing). Projections, not guarantees.
Landlord ↔ Tenant lean methodology
- Overall (STATE)
- 55 Moderately Landlord-Leaning
- State New Mexico
- 55 Moderately Landlord-Leaning · D+3
- County
- — inherits STATE
- City
- — inherits STATE
ZIP-level market 87036
- Home prices YoY
- 3.8%
- Active inventory
- 52
- Price-to-rent
- 11.3×
Monthly cashflow live
- Estimated rent
- $920 medium interval (Pro) →
- Mortgage (P&I)
- −$656
- Tax from tax record
- −$27 /mo · $320/yr
- Insurance
- −$52
- HOA
- −$0
- Vacancy / Maint / Mgmt
- −$193
- Net cashflow
- $-7
Break-even live
UW: 25.0% down · 7.5% · 30yr · 1.5% tax · 5.0% vac · 8.0% maint · 8.0% mgmt
Financing live
Cash to close
- Down payment
- $31,250
- Closing costs
- $3,750
- Reserves months
- —
- Total cash needed
- —
Loan-product check · same deal, 3 products live
Conventional
25% down · 7.5% · 30yr
- Down + closing
- —
- Monthly P&I
- —
- Monthly cashflow
- —
- DSCR
- —
- Eligible?
- —
Personal DTI + credit; lowest rate.
DSCR
20% down · 8.5% · 30yr
- Down + closing
- —
- Monthly P&I
- —
- Monthly cashflow
- —
- DSCR
- —
- Eligible?
- —
No personal income docs; deal must DSCR.
Hard money
10% down · 12.0% · 12mo
- Down + closing
- —
- Monthly P&I
- —
- Monthly cashflow
- —
- DSCR
- —
- Eligible?
- —
Short-term bridge; refi at stabilization.
Listing history 23 events
-
2026-06-18days on market $125,000 Active 72 DOM
-
2026-06-17days on market $125,000 Active 71 DOM
-
2026-06-16days on market $125,000 Active 70 DOM
-
2026-06-15days on market $125,000 Active 69 DOM
-
2026-06-13days on market $125,000 Active 67 DOM
-
2026-06-10days on market $125,000 Active 64 DOM
-
2026-06-09days on market $125,000 Active 63 DOM
-
2026-06-08days on market $125,000 Active 62 DOM
-
2026-06-07days on market $125,000 Active 61 DOM
-
2026-06-05days on market $125,000 Active 58 DOM
-
2026-06-03days on market $125,000 Active 57 DOM
-
2026-06-02days on market $125,000 Active 56 DOM
-
2026-06-01days on market $125,000 Active 55 DOM
-
2026-05-31days on market $125,000 Active 54 DOM
-
2026-03-29$125,000 Active 748-char remark
Show marketing remark (748 chars)
Come see this charming 1940's bungalow with vintage charm and a range of modern upgrades. This quaint home boasts 2 bedroomsand 1 bathroom. Situated on a spacious lot, this property offers ample outdoor space complete with a shed and convenient back yard access. The proximity to Main St. allows for so many possibilities such as an art studio, vacation rental etc. In the last 5 years the interior has been thoughtfully updated with new electricalwiring, plumbing, gas lines and radiant heating, ensuring comfort and efficiency year round. Whether you're seeking a starter home or a tranquil retreat, this home offers the perfect blend of historic charm and modern convenience. Don't miss the opportunity to make this delightful property your own.
-
2025-03-24soldstatus
-
2025-03-24soldstatus
-
2025-02-10status Pending
-
2025-01-05$125,000 Active
-
2018-09-06historical
-
2018-09-05soldstatus
-
2018-08-25status Pending
-
2018-08-25$27,000 Active
ⓘ Source: listings_history table (triggers on properties + properties_extension) + one-shot
backfill from property_details.listing_events for pre-trigger history.
Tax reassessment forecast NM · Resets to sale price
- Current annual tax
- $320 · $27/mo
- Projected year-2 tax
- $1,000 · $83/mo
- Expected delta
- +$680/yr (+$57/mo · 212.2%)
ⓘ Screening estimate from a state-policy table — verify with the county assessor before closing.
Climate risk First Street
- Flood 1/10 Low 0% chance over 30 yrs
- Wildfire 6/10 Major
- Heat 3/10 Moderate 4 d/yr ≥91°F today · 12 d/yr by 30 yrs out
- Wind 1/10 Low
- Air quality 1/10 Low 0 unhealthy d/yr today · 0 by 30 yrs out
Nearby sold comps map
Loading sold comps map…
Walkable amenities ~0.75 mi
Loading nearby amenities…
Taxation est. · year 1
- Rental income
- $11,045
- − Mortgage interest
- −$7,002
- − Property taxes
- −$320
- − Insurance
- −$625
- − Repairs & maintenance
- −$884
- − Management
- −$884
- − Depreciation
- −$3,636
- Taxable loss
- −$2,306
- Est. tax savings @ 24.0%
- +$553
- After-tax cash flow
- $468/yr
For passive investors: Depreciation is non-cash, so a rental often shows a tax loss while cash-flowing — sheltering income. Rental losses are passive: they offset passive income freely, and up to $25,000/yr can offset ordinary (W-2) income if you actively participate and your MAGI is under $100k (phasing out to $0 by $150k); unused losses carry forward. On sale, claimed depreciation is recaptured at up to 25%, and gains may owe capital-gains tax (a 1031 exchange can defer both). Figures are a year-1 estimate at your 24.0% rate — not tax advice; consult a CPA.
Schools (NCES district)
- District
- Mountainair Public Schools
- NCES district ID
- 3501950
- Math proficiency
- 25% ▲ 15.00%
- Reading proficiency
- 25% ▼ -10.00%
- Median HH income
- $37,198
- Composite
- 20.84/100
- National rank
- #8501
- State rank
- #25 of 29 in NM
Livability — Mountainair
- Score
- 56/100
- State rank
- #188
- US rank
- #22919
Category grades
Schools grade is shown separately in the Schools card above.
Census & demographics
- Census place
- Mountainair, NM
- Population (ZIP)
- 2,052
Population outlook (Torrance County) Hauer SSP2
- Today (2025)
- 13,807 people
- By 2030
- 12,946 · -6.2%
- By 2040
- 11,214 · -18.8%
- By 2050
- 9,802 · -29.0%
- By 2075
- 7,634 · -44.7%
- By 2100
- 5,637 · -59.2%
Race, ethnicity, and origin ACS 2023
- Neighborhood character
- Diverse neighborhood (Simpson 0.61)
- Race & ethnicity
- White 47% Hispanic / Latino 41% Two or more races 13% Black 6%
- Hispanic origin (detail)
- Mexican 7%
- Common ancestry
- Lithuanian 3% Slovak 2% Romanian 1%
- Foreign-born
- 4% · Canada
- Languages at home
- 82% English-only · Spanish 18%
Political lean MEDSL · Torrance
- 2024 margin
- Solid R (+38.1) · D 29.9% · R 68.0% · Other 2.2%
- 2008→2024 swing
- -28.8pp toward R · 2008: -9.3pp · 2024: -38.1pp
- All cycles
- 2024: R+38.1 2020: R+33.4 2016: R+30.8 2012: R+17.4 2008: R+9.3
Not yet ingested
- Civics
- —
Market trends
- HPI YoY
- ▲ 3.89%
- Current HPI
- 105.5739
- Rent YoY
- —
- Metro
- —
- State GDP YoY
- —
- F500 in state
- 0
Price history
+363.0% since first listed9 events — show timeline
- 2026-03-29 Listed $125,000 Southwest MLS
- 2025-03-24 Sold (Public Records) — Public Records
- 2025-03-24 Sold (Public Records) — Public Records
- 2025-02-10 Pending — Southwest MLS
- 2025-01-05 Listed $125,000 Southwest MLS
- 2018-09-06 Delisted — Southwest MLS
- 2018-09-05 Sold (Public Records) — Public Records
- 2018-08-25 Pending — Southwest MLS
- 2018-08-25 Listed $27,000 Southwest MLS
Property tax history
+1.6%/yrLatest (2025): $320 · +6.9% YoY. Source: county tax records.
Cash-flow waterfall
monthlySold comps — $/sqft
last 12 mo · ≤1 miLoading sold comps…