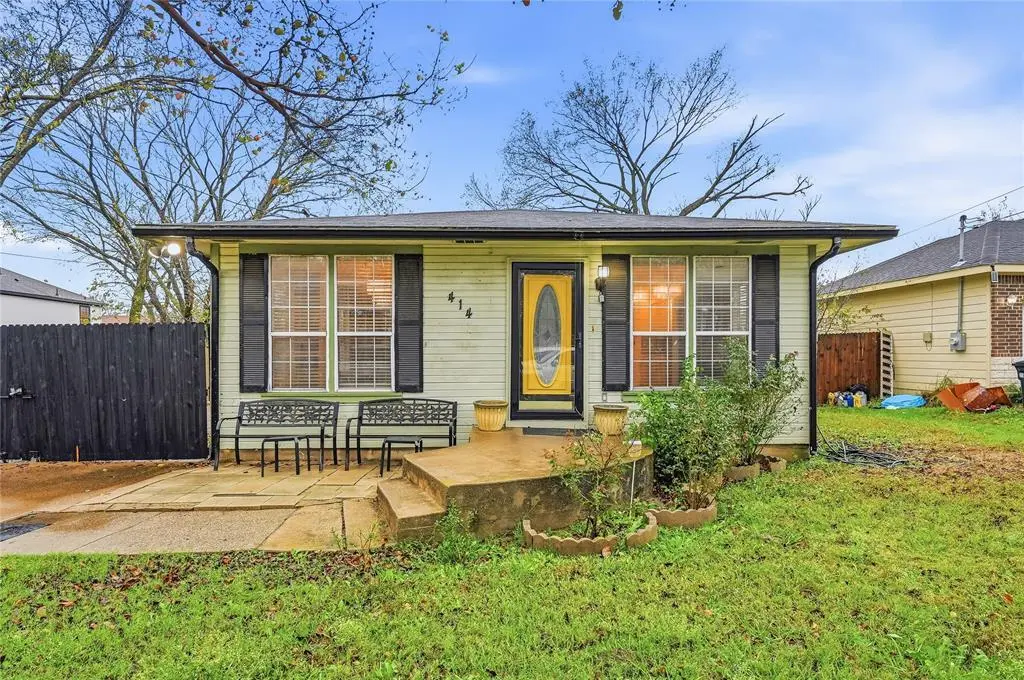
414 Thomas St · Terrell, TX
Flood risk 1/10 · Minimal
- FEMA flood zone
- X (unshaded)
- Chance of flooding over 30 yrs
- 0.0%
- Est. flood insurance / yr
- $507 – $1,088
Fire risk 6/10 · Moderate
- Est. fire insurance / yr
- $1,222 – $2,270
Heat risk 7/10 · Major
- Hot days now (above 109°F)
- 7 days/yr
- Hot days in 30 yrs
- 24 days/yr
Wind risk 6/10 · Moderate
- Chance of severe wind over 30 yrs
- 27.0%
Air-quality risk 2/10 · Minimal
- Unhealthy air days now
- 1 days/yr
- Unhealthy air days in 30 yrs
- 1 days/yr
Risk factors via First Street. Map © Google.
Why this score? — see what drove the B grade
The composite is a weighted blend of 9 inputs, each scored 0–100. Each bar is that input's sub-score; the figure is the points it added to the 100-point composite (weight × sub-score).
- Cash flow +27.9/30.0
- ARV discount +15.0/15.0
- DSCR +9.9/10.0
- 1% rule +7.7/10.0
- Livability +3.4/5.0
- Rent growth +2.5/5.0
- Condition / age +2.5/5.0
- Schools +2.4/10.0
- Appreciation +0.0/10.0
$151,999
🖨 Deal sheet 📄 Offer letter ✓ Due diligence
Listing remarks MLS
Welcome to this charming 3-bedroom, 2-bath home nestled on an interior lot in the established Spray 4th & 5th community of Terrell. Offering 1,600 sq ft of living space, this single-story residence features multiple living areas including a den, great room, providing plenty of room for relaxation and entertaining. The primary bedroom offers an ensuite bath with granite countertops, a garden tub, separate shower, and a spacious walk-in closet. Additional highlights include granite counters throughout, built-in cabinetry, ceiling fans, and a functional galley kitchen layout. Featuring a gated driveway, this property offers convenience and potential for customization. Home is being sold AS IS and will require some TLC. Fence needs repairs and no appliances are included. Located near local amenities, schools, and major routes, this home presents a great opportunity for investors or buyers looking to add personal touches and value. Schedule a showing today!
Key facts
- Walk-in closet
- Ensuite bath
- Separate shower
Tags
Neighborhood map
What this means for you Summary
Snapshot
- This is a 3-bed/1.0-bath single-family listed at $152k.
Deal economics
- At list price, monthly cash flow is $467 ($6k/yr) — positive.
- The deal already cash-flows at list — no discount required.
- Meets the 1% rule at list price ($2k rent vs $152k).
- Recommended offer: $134k (12.0% below list) — sets the bar for market timing.
- Cap rate 10.0% vs local median 3.8% in Terrell — top-decile yield for the area; either an underpriced asset or a hidden risk that comps aren't pricing in. Stress-test before assuming the spread holds.
Location & tenants
- Location reads 67/100 on livability (#520 in TX) — a middle-class / working-renter tenant base. Strengths: cost of living A+, housing A+; Watch: amenities C-, employment D, schools F.
- Terrell ISD (town): math 25% / reading 30% proficiency, ranked #677 of 826 in TX (top 82%) — low school quality limits family demand, transient renter base, plan for 1-2y turnover; 68% free/reduced lunch — lower-income household profile, screen leases tightly.
- Market conditions: 372 active listings in the ZIP; 8 comparable units currently listed for rent nearby; rentals lingering (median 44d on market — plan ~5-8 weeks vacancy on turnover, expect pricing pressure); 50% of comp listings sitting > 30 days — soft ceiling on asking rent; 1,747 units permitted in Kaufman County in 2024 (180 in 5+ unit buildings).
- This rent runs 32% of the median local income ($72k/yr) — at the standard rent-burdened threshold; future hikes will face affordability resistance.
Forward outlook
- Local home prices are declining (-3.0%/yr); year-one equity from $1k of loan paydown is wiped out by about $5k of value loss. Plan a longer hold.
- Kaufman County population projected at +43% by 2050 — long-run rental-demand tailwind backs the buy-and-hold thesis.
- At projected returns (-3.0% appreciation + 3.0% rent growth), your $43k cash investment doubles in ~9 years — after that, you're playing with house money.
Negotiation context
- It's been on market 199 days — a 12% lower offer ($134k) is reasonable based on typical stale-listing flexibility.
- 2 sale attempts with the ask held roughly flat each time — persistent listings suggest the price (not the market) is what's stuck; bring a comps-based counter.
Risks & watch-outs
- Climate carrying-cost: major wind risk, 27% chance of damaging wind over 30y; major wildfire risk; extreme-heat days projected 7→24/yr by 2055 (HVAC capex compounding) — expect insurance premiums to compound above CPI over the hold.
Questions for the listing agent
- It's been on market 199 days. Have you received any prior offers? Is the seller open to a 12% concession, seller financing, or rate buy-down credit?
- Built in 1965 — when were the roof, HVAC, electrical panel, plumbing, and water heater last replaced?
- Why hasn't it sold? Are there any deal-killer items the seller is aware of (foundation, flood, title, zoning, code violations)?
- Is there a deadline driving the sale (1031 exchange, divorce, estate, relocation)? That informs how much negotiation room exists.
- Schools are F-rated, which usually means shorter tenancies and higher turnover. Who's the typical renter profile here, and what's been the actual vacancy rate?
- What's the average days-on-market for RENTAL listings here right now (not sales)? A rising rental-DOM trend means longer vacancies and softer asking-rent achievability than the comps imply.
- What's the recent tenant-quality profile in this submarket — average credit score on applications, eviction rate, late-payment / NSF rate, and stable-employment percentage? A property-management company in the area should have these aggregated.
- How much new for-sale + rental construction is in the pipeline within 1–3 miles? Heavy new supply typically softens prices + rents 12–24 months out; constrained supply supports both.
Investment metrics
- 1% rule
- 1.27% ✓
- Cap rate
- 9.98%
- Cash-on-cash
- 13.18%
- DSCR
- 1.59
- GRM
- 6.6
CMA / ARV
- ARV (median comp)
- $259,104
- List price
- $151,999
- Delta
- -41.34%
- Verdict
- UNDERPRICED
- Comps
- 20 within 1.0 mi
Show comp detail 7 sales within ~0.75 mi
| Address | Dist | Beds/Ba | Sqft | Sold | Price | $/sf | Match |
|---|---|---|---|---|---|---|---|
| 503 Runnells St | 0.16mi | 3/2.0 | 1,210 (-7%) | 17mo | $234,900 | $194 | 62 |
| 407 Thomas St | 0.05mi | 4/2.0 (+1) | 1,447 (+11%) | 20mo | $280,000 | $194 | 53 |
| 805 S Catherine St | 0.68mi | 3/2.0 | 1,270 (-2%) | 12mo | $200,000 | $157 | 51 |
| 708 E Brin St | 0.68mi | 3/2.0 | 1,200 (-8%) | 10mo | $249,900 | $208 | 44 |
| 606 E Brin St | 0.71mi | 3/1.5 | 1,440 (+11%) | 5mo | $189,000 | $131 | 43 |
| 1007 S Catherine St | 0.75mi | 3/1.0 | 1,201 (-8%) | 19mo | $198,990 | $166 | 36 |
| 508 E Brin St | 0.74mi | 2/2.0 (-1) | 1,236 (-5%) | 19mo | $249,000 | $201 | 32 |
Match score weights: distance 35% · size 25% · config 20% · recency 20%. Top-matched comps best support the ARV.
Projected returns pro-forma
-3.0% appreciation · 3.0% rent growth · sell at horizon
- IRR
- 3.2%
- Equity multiple
- 1.12×
- Total profit
- $5,165
- Equity at exit
- $22,664
- IRR
- 12.7%
- Equity multiple
- 2.01×
- Total profit
- $42,955
- Equity at exit
- $13,142
Cash invested: $42,560 (down + closing). Projections, not guarantees.
Landlord ↔ Tenant lean methodology
- Overall (STATE)
- 87 Strongly Landlord-Friendly
- State Texas
- 87 Strongly Landlord-Friendly · R+5
- County
- — inherits STATE
- City
- — inherits STATE
ZIP-level market 75160
- Home prices YoY
- -13.2%
- Active inventory
- 372
- Price-to-rent
- 6.6×
Monthly cashflow live
- Estimated rent
- $1,929 high interval (Pro) →
- Mortgage (P&I)
- −$797
- Tax from tax record
- −$196 /mo · $2,355/yr
- Insurance
- −$63
- HOA
- −$0
- Vacancy / Maint / Mgmt
- −$405
- Net cashflow
- $467
Break-even live
UW: 25.0% down · 7.5% · 30yr · 1.5% tax · 5.0% vac · 8.0% maint · 8.0% mgmt
Financing live
Cash to close
- Down payment
- $38,000
- Closing costs
- $4,560
- Reserves months
- —
- Total cash needed
- —
Loan-product check · same deal, 3 products live
Conventional
25% down · 7.5% · 30yr
- Down + closing
- —
- Monthly P&I
- —
- Monthly cashflow
- —
- DSCR
- —
- Eligible?
- —
Personal DTI + credit; lowest rate.
DSCR
20% down · 8.5% · 30yr
- Down + closing
- —
- Monthly P&I
- —
- Monthly cashflow
- —
- DSCR
- —
- Eligible?
- —
No personal income docs; deal must DSCR.
Hard money
10% down · 12.0% · 12mo
- Down + closing
- —
- Monthly P&I
- —
- Monthly cashflow
- —
- DSCR
- —
- Eligible?
- —
Short-term bridge; refi at stabilization.
Rent comps 8 comps
| Address | Beds | Baths | Sqft | Rent | $/sqft | DOM | Units | Dist |
|---|---|---|---|---|---|---|---|---|
| 507 Campbell St Terrell, TX | 3.0 | 2.0 | 1268 | $1,950 | $1.54 | 44d | 1 | 0.13mi |
| 303 N Delphine St Terrell, TX | 3.0 | 2.0 | 1526 | $1,950 | $1.28 | 43d | 1 | 0.76mi |
| 203 E Brin St Terrell, TX | 2.0 | 2.0 | 1472 | $1,500 | $1.02 | 17d | 1 | 0.90mi |
| 1300 S Adelaide St Terrell, TX | 1.0–4.0 | 1.0–2.0 | 785 | $1,413 | $1.80 | 1d | 9 | 0.93mi |
| 1210 S Frances St Terrell, TX | 3.0 | 2.0 | 1204 | $1,700 | $1.41 | 43d | 1 | 0.94mi |
| 111 Kennedy Dr Terrell, TX | 3.0 | 2.0 | 1348 | $1,750 | $1.30 | 21d | 1 | 1.35mi |
| 111 Kennedy Dr Terrell, TX | 3.0 | 2.0 | 1348 | $1,750 | $1.30 | 43d | 1 | 1.35mi |
| 920 N Virginia St Terrell, TX | 2.0 | 1.0 | 924 | $1,650 | $1.79 | 16d | 1 | 1.42mi |
Listing history 23 events
-
2026-06-18days on market $151,999 Active 199 DOM
-
2026-06-17days on market $151,999 Active 198 DOM
-
2026-06-16days on market $151,999 Active 197 DOM
-
2026-06-15days on market $151,999 Active 196 DOM
-
2026-06-13days on market $151,999 Active 194 DOM
-
2026-06-13days on market $151,999 Active 193 DOM
-
2026-06-09days on market $151,999 Active 190 DOM
-
2026-06-08days on market $151,999 Active 189 DOM
-
2026-06-07days on market $151,999 Active 188 DOM
-
2026-06-04days on market $151,999 Active 185 DOM
-
2026-06-03days on market $151,999 Active 184 DOM
-
2026-06-02days on market $151,999 Active 183 DOM
-
2026-06-01days on market $151,999 Active 182 DOM
-
2026-05-31days on market $151,999 Active 181 DOM
-
2025-12-01$151,999 Active 970-char remark
Show marketing remark (970 chars)
Welcome to this charming 3-bedroom, 2-bath home nestled on an interior lot in the established Spray 4th & 5th community of Terrell. Offering 1,600 sq ft of living space, this single-story residence features multiple living areas including a den, great room, providing plenty of room for relaxation and entertaining. The primary bedroom offers an ensuite bath with granite countertops, a garden tub, separate shower, and a spacious walk-in closet. Additional highlights include granite counters throughout, built-in cabinetry, ceiling fans, and a functional galley kitchen layout. Featuring a gated driveway, this property offers convenience and potential for customization. Home is being sold AS IS and will require some TLC. Fence needs repairs and no appliances are included. Located near local amenities, schools, and major routes, this home presents a great opportunity for investors or buyers looking to add personal touches and value. Schedule a showing today!
-
2025-10-17historical
-
2025-10-13price $153,000
-
2025-10-07price $154,000
-
2025-10-02price $155,000
-
2025-09-30price $160,000
-
2025-09-21price $165,000
-
2025-08-31$173,000 Active
-
1999-04-23soldstatus
ⓘ Source: listings_history table (triggers on properties + properties_extension) + one-shot
backfill from property_details.listing_events for pre-trigger history.
Tax reassessment forecast TX · Resets to sale price
- Current annual tax
- $2,355 · $196/mo
- Projected year-2 tax
- $2,782 · $232/mo
- Expected delta
- +$426/yr (+$36/mo · 18.1%)
ⓘ Screening estimate from a state-policy table — verify with the county assessor before closing.
Climate risk First Street
- Flood 1/10 Low FEMA zone X (unshaded) · 0% chance over 30 yrs
- Wildfire 6/10 Major
- Heat 7/10 Severe 7 d/yr ≥109°F today · 24 d/yr by 30 yrs out
- Wind 6/10 Major 27% chance of damaging wind over 30 yrs
- Air quality 2/10 Low 1 unhealthy d/yr today · 1 by 30 yrs out
Nearby sold comps map
Loading sold comps map…
Walkable amenities ~0.75 mi
Loading nearby amenities…
Taxation est. · year 1
- Rental income
- $23,150
- − Mortgage interest
- −$8,514
- − Property taxes
- −$2,355
- − Insurance
- −$760
- − Repairs & maintenance
- −$1,852
- − Management
- −$1,852
- − Depreciation
- −$4,422
- Taxable income
- $3,394
- Est. tax owed @ 24.0%
- −$815
- After-tax cash flow
- $4,793/yr
For passive investors: Depreciation is non-cash, so a rental often shows a tax loss while cash-flowing — sheltering income. Rental losses are passive: they offset passive income freely, and up to $25,000/yr can offset ordinary (W-2) income if you actively participate and your MAGI is under $100k (phasing out to $0 by $150k); unused losses carry forward. On sale, claimed depreciation is recaptured at up to 25%, and gains may owe capital-gains tax (a 1031 exchange can defer both). Figures are a year-1 estimate at your 24.0% rate — not tax advice; consult a CPA.
Schools (NCES district)
- District
- Terrell ISD
- NCES district ID
- 4842450
- Math proficiency
- 25% ▼ -14.00%
- Reading proficiency
- 30% ▼ -5.00%
- Median HH income
- $44,265
- Composite
- 23.57/100
- National rank
- #7855
- State rank
- #677 of 826 in TX
Livability — Terrell
- Score
- 67/100
- State rank
- #520
- US rank
- #10213
Category grades
Schools grade is shown separately in the Schools card above.
Census & demographics
- Census place
- Terrell, TX
- County
- Kaufman County · 122,338 people
- City population
- 28,206
- Metro
- Dallas-Fort Worth-Arlington, TX
- Population (ZIP)
- 28,206
- Household income
- $71,801
- Rent vs Own
- Severe rent burden
- 845.0
Population outlook (Kaufman County) Hauer SSP2
- Today (2025)
- 138,716 people
- By 2030
- 150,815 · +8.7%
- By 2040
- 174,877 · +26.1%
- By 2050
- 198,020 · +42.8%
- By 2075
- 251,908 · +81.6%
- By 2100
- 285,325 · +105.7%
Race, ethnicity, and origin ACS 2023
- Neighborhood character
- Diverse neighborhood (Simpson 0.64)
- Race & ethnicity
- White 46% Hispanic / Latino 33% Two or more races 19% Black 18%
- Hispanic origin (detail)
- Mexican 30%
- Common ancestry
- Lithuanian 2% Slovak 1% Portuguese 1%
- Foreign-born
- 11% · Canada
- Languages at home
- 75% English-only · Spanish 24% Russian/Polish/Slavic 1%
Political lean MEDSL · Kaufman
- 2024 margin
- Strong R (+27.9) · D 35.6% · R 63.5%
- 2008→2024 swing
- +7.9pp toward D · 2008: -35.8pp · 2024: -27.9pp
- All cycles
- 2024: R+27.9 2020: R+33.9 2016: R+47.0 2012: R+44.4 2008: R+35.8
Not yet ingested
- Civics
- —
Market trends
- HPI YoY
- ▼ -42.39%
- Current HPI
- 278.507
- Rent YoY
- —
- Metro
- Dallas-Fort Worth-Arlington, TX
- State GDP YoY
- ▲ 3.95%
- F500 in state
- 110
Industry mix (Fortune 500 HQ in TX)
| Industry | F500 HQs | Revenue |
|---|---|---|
| Energy | 16 | $1,198B |
|
||
| Technology | 5 | $198B |
|
||
| Engineering / Construction | 4 | $72B |
|
||
| Energy Services | 3 | $60B |
|
||
| Utilities | 3 | $41B |
|
||
| Healthcare | 2 | $330B |
|
||
Price history
-12.1% since first listed9 events — show timeline
- 2025-12-01 Listed $151,999 NTREIS
- 2025-10-17 Listing Removed — NTREIS
- 2025-10-13 Price Changed $153,000 NTREIS
- 2025-10-07 Price Changed $154,000 NTREIS
- 2025-10-02 Price Changed $155,000 NTREIS
- 2025-09-30 Price Changed $160,000 NTREIS
- 2025-09-21 Price Changed $165,000 NTREIS
- 2025-08-31 Listed $173,000 NTREIS
- 1999-04-23 Sold (Public Records) — Public Records
Property tax history
+3.6%/yrLatest (2025): $2,355 · +13.5% YoY. Source: county tax records.
Cash-flow waterfall
monthlySold comps — $/sqft
last 12 mo · ≤1 miLoading sold comps…