 Duplex
9408/9410 E Wassall St · Wichita, KS
Flood risk No data
- FEMA flood zone
- —
- Chance of flooding over 30 yrs
- —
- Est. flood insurance / yr
- —
Fire risk No data
- Est. fire insurance / yr
- —
Heat risk No data
- Hot days now (above threshold)
- —
- Hot days in 30 yrs
- —
Wind risk No data
- Chance of severe wind over 30 yrs
- —
Air-quality risk No data
- Unhealthy air days now
- —
- Unhealthy air days in 30 yrs
- —
Risk factors via First Street. Map © Google.
Why this score? — see what drove the D+ grade
The composite is a weighted blend of 9 inputs, each scored 0–100. Each bar is that input's sub-score; the figure is the points it added to the 100-point composite (weight × sub-score).
- Cash flow +10.9/30.0
- Appreciation +10.0/10.0
- ARV discount +7.5/15.0
- Condition / age +4.8/5.0
- 1% rule +3.7/10.0
- Livability +3.6/5.0
- DSCR +3.1/10.0
- Schools +2.9/10.0
- Rent growth +2.5/5.0
$379,900
🖨 Deal sheet 📄 Offer letter ✓ Due diligence
Multi-family units
County records classify this as Multi-Family (2-4 Unit). Listing-text estimate: 2 units. confirmed
Key facts
- 9,037 sq ft lot
- 8 parking spots
- Built 2026
Property features AI
Finance
- Other: Located in Sedgwick County; Directions: From Pawnee go south on Webb Rd to Wassall St. West on Wassall St. to home.
- Financial info: Property is a 2-unit multifamily (duplex)
- HOA & community: Association present with an $1,800 annual fee and a $150 initiation fee; Association pays grounds care
Exterior
- Parking: Attached parking with capacity for 8 vehicles total
- Utilities: Natural gas available; Public water; Sewer available
- Home design: Duplex
- Exterior features: Composition roof
Interior
- Kitchen: Includes dishwasher, microwave, range, refrigerator, and disposal
- Bedrooms: 2-unit property (duplex) — bedroom details per unit not provided
- Heating & cooling: Natural gas heating with forced-air system; Electric cooling
- Interior features: Dishwasher, Disposal, Microwave, Range, Refrigerator
Neighborhood map
What this means for you Summary
Snapshot
- This is a 2 × 4-bed/2-bath units multifamily listed at $380k. Condition is rated excellent.
Deal economics
- At list price, monthly cash flow is $-170 ($-2k/yr) — negative. Per door: $-85/mo.
- To cash-flow at today's rent, offer at most $355k (6.5% below list).
- To meet the 1% rule (rent ≥ 1% of price), the offer needs to be $330k (13.2% below list).
- Recommended offer: $330k (13.2% below list) — sets the bar for 1% rule.
Location & tenants
- Location reads 72/100 on livability (#100 in KS) — a middle-class / working-renter tenant base. Strengths: amenities A+, cost of living A+, housing A+; Watch: employment D+, crime F, commute F.
- Derby (suburban): math 29% / reading 36% proficiency, ranked #66 of 169 in KS (top 39%) — families likely to look elsewhere, expect single-tenant / working-renter base with shorter leases.
- Zoned schools: Derby Hills Elem (math 32% / reading 37%, grade F, #388 of 684 statewide, top 61%, 384 students, 43% FRL); Derby North Middle School (math 29% / reading 29%, grade F, #85 of 219 statewide, top 40%, 828 students, 48% FRL); Derby High School (math 17% / reading 21%, grade F, #230 of 327 statewide, top 71%, 2,172 students, 43% FRL).
- Market conditions: 44 active listings in the ZIP; 1 comparable units currently listed for rent nearby; 2,613 units permitted in Sedgwick County in 2024 (258 in 5+ unit buildings).
Forward outlook
- In year one you build about $41k of equity ($3k loan paydown + $38k appreciation (10.0% local appreciation)).
- Sedgwick County population projected at +5% by 2050 — modest demand growth; plan on rents tracking national, not racing it.
- By year 2, paydown + projected appreciation supports a ~$65k cash-out refi (75% LTV) — recoverable capital for the next deal without selling this one.
Negotiation context
- Only 7 days on market — expect competitive offers; lowballing is unlikely to land.
Questions for the listing agent
- What do current leases actually rent for vs. the listed asking? Can we see a recent rent roll and the last 12 months of T-12 income?
- Can we see the unit-by-unit rent roll, current vacancy, and any below-market leases? What's the average tenancy length?
- What capital expenditures (roof, boiler, parking lot, exteriors) have been made in the last 5 years, and what's planned in the next 2?
- What does the HOA fee cover, when was the last increase, and are there any pending special assessments or reserve-fund shortfalls?
- Is there a deadline driving the sale (1031 exchange, divorce, estate, relocation)? That informs how much negotiation room exists.
- Schools are F-rated, which usually means shorter tenancies and higher turnover. Who's the typical renter profile here, and what's been the actual vacancy rate?
- Crime grade is F in this area — have there been break-ins, vandalism, or insurance claims at this property in the last 3 years? What carrier currently insures it and at what premium?
- The area grade is low — what's the realistic commute time and amenity access for the typical tenant pool here? Any planned neighborhood developments (good or bad) we should know about?
- What's the average days-on-market for RENTAL listings here right now (not sales)? A rising rental-DOM trend means longer vacancies and softer asking-rent achievability than the comps imply.
- What's the recent tenant-quality profile in this submarket — average credit score on applications, eviction rate, late-payment / NSF rate, and stable-employment percentage? A property-management company in the area should have these aggregated.
- How much new apartment / multifamily construction is in the pipeline within 1–3 miles? Heavy new supply (>2% of stock underway) typically softens rents 12–24 months out; light construction supports rent growth.
Investment metrics
- 1% rule
- 0.87% ✗
- Cap rate
- 5.76%
- Cash-on-cash
- -1.92%
- DSCR
- 0.91
- GRM
- 9.6
CMA / ARV
No comps found within radius.
Projected returns pro-forma
10.0% appreciation · 3.0% rent growth · sell at horizon
- IRR
- 22.9%
- Equity multiple
- 2.84×
- Total profit
- $196,219
- Equity at exit
- $342,244
- IRR
- 20.5%
- Equity multiple
- 6.51×
- Total profit
- $586,629
- Equity at exit
- $738,062
Cash invested: $106,372 (down + closing). Projections, not guarantees.
Landlord ↔ Tenant lean methodology
- Overall (STATE)
- 83 Strongly Landlord-Friendly
- State Kansas
- 83 Strongly Landlord-Friendly · R+10
- County
- — inherits STATE
- City
- — inherits STATE
ZIP-level market 67210
- Home prices YoY
- 30.3%
- Active inventory
- 44
- Price-to-rent
- 19.2×
Monthly cashflow live
- Estimated rent
- $3,298 high interval (Pro) →
- Mortgage (P&I)
- −$1,992
- Tax est. 1.5%
- −$475 /mo · $5,698/yr
- Insurance
- −$158
- HOA
- −$150
- Vacancy / Maint / Mgmt
- −$693
- Net cashflow
- $-170
Break-even live
2-unit breakdown (identical units grouped — click to expand)
| Units | Beds | Baths | Est. rent |
|---|---|---|---|
| 2× units | 4 | 2 | $3,298 |
| #1 | 4 | 2 | $1,649 |
| #2 | 4 | 2 | $1,649 |
| Total (2 units) | $3,298 | ||
UW: 25.0% down · 7.5% · 30yr · 1.5% tax · 5.0% vac · 8.0% maint · 8.0% mgmt
Financing live
Cash to close
- Down payment
- $94,975
- Closing costs
- $11,397
- Reserves months
- —
- Total cash needed
- —
Loan-product check · same deal, 3 products live
Conventional
25% down · 7.5% · 30yr
- Down + closing
- —
- Monthly P&I
- —
- Monthly cashflow
- —
- DSCR
- —
- Eligible?
- —
Personal DTI + credit; lowest rate.
DSCR
20% down · 8.5% · 30yr
- Down + closing
- —
- Monthly P&I
- —
- Monthly cashflow
- —
- DSCR
- —
- Eligible?
- —
No personal income docs; deal must DSCR.
Hard money
10% down · 12.0% · 12mo
- Down + closing
- —
- Monthly P&I
- —
- Monthly cashflow
- —
- DSCR
- —
- Eligible?
- —
Short-term bridge; refi at stabilization.
Rent comps 1 comps
| Address | Beds | Baths | Sqft | Rent | $/sqft | DOM | Units | Dist |
|---|---|---|---|---|---|---|---|---|
| 9922 E Kinkaid Cir Wichita, KS | 3.0 | 2.0 | 1642 | $1,575 | $0.96 | 23d | 1 | 0.67mi |
HOA detail
- Monthly dues
- $150 · $1,800/yr
Listing history 2 events
-
2026-05-12status Pending
-
2026-05-05$379,900 Active
ⓘ Source: listings_history table (triggers on properties + properties_extension) + one-shot
backfill from property_details.listing_events for pre-trigger history.
Nearby sold comps map
Loading sold comps map…
Walkable amenities ~0.75 mi
Loading nearby amenities…
Taxation est. · year 1
- Rental income
- $39,576
- − Mortgage interest
- −$21,280
- − Property taxes
- −$5,698
- − Insurance
- −$1,900
- − Repairs & maintenance
- −$3,166
- − Management
- −$3,166
- − HOA
- −$1,800
- − Depreciation
- −$11,052
- Taxable loss
- −$8,486
- Est. tax savings @ 24.0%
- +$2,037
- After-tax cash flow
- $-3/yr
For passive investors: Depreciation is non-cash, so a rental often shows a tax loss while cash-flowing — sheltering income. Rental losses are passive: they offset passive income freely, and up to $25,000/yr can offset ordinary (W-2) income if you actively participate and your MAGI is under $100k (phasing out to $0 by $150k); unused losses carry forward. On sale, claimed depreciation is recaptured at up to 25%, and gains may owe capital-gains tax (a 1031 exchange can defer both). Figures are a year-1 estimate at your 24.0% rate — not tax advice; consult a CPA.
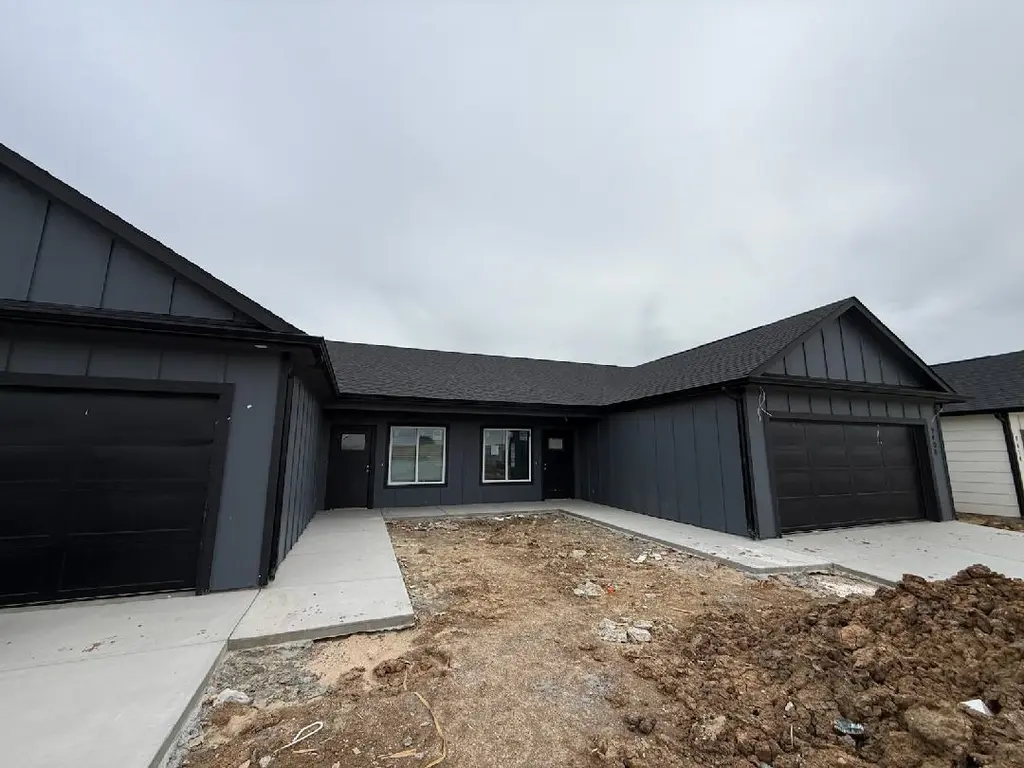
Condition & rehab AI · 3 photos
This multi-family property is in excellent condition with no visible repairs needed. Minor updates to exterior paint and landscaping would significantly increase its resale and rental value.
Value-add opportunities
- Both Paint exterior and landscaping — Enhances curb appeal and first impression
- Both Install new front door — Improves security and aesthetic
- Both Add outdoor lighting — Enhances safety and curb appeal
Renovation cost estimate screening
Value-add ROI direction
- Both Paint exterior and landscaping — Enhances curb appeal and first impression ↑
- Both Install new front door — Improves security and aesthetic ↑
- Both Add outdoor lighting — Enhances safety and curb appeal ↑
ⓘ Cost ranges are severity-bucket heuristics (US national rule-of-thumb). Get contractor quotes + a written scope before underwriting a rehab budget.
Schools (NCES district)
- District
- Derby
- NCES district ID
- 2005460
- Math proficiency
- 29% ▼ -3.00%
- Reading proficiency
- 36% ▲ 1.00%
- Median HH income
- $60,460
- Composite
- 29.25/100
- National rank
- #6564
- State rank
- #66 of 169 in KS
Livability — Wichita
- Score
- 72/100
- State rank
- #100
- US rank
- #5730
Category grades
Schools grade is shown separately in the Schools card above.
Census & demographics
- City population
- 365,168
- Population (ZIP)
- 9,178
Population outlook (Sedgwick County) Hauer SSP2
- Today (2025)
- 537,014 people
- By 2030
- 546,984 · +1.9%
- By 2040
- 559,141 · +4.1%
- By 2050
- 562,027 · +4.7%
- By 2075
- 557,255 · +3.8%
- By 2100
- 513,383 · -4.4%
Race, ethnicity, and origin ACS 2023
- Neighborhood character
- Highly diverse neighborhood (Simpson 0.74)
- Race & ethnicity
- White 43% Hispanic / Latino 19% Asian 16% Two or more races 16% Black 12%
- Hispanic origin (detail)
- Mexican 17%
- Common ancestry
- Italian 2% Serbian 1% Portuguese 1%
- Foreign-born
- 18% · Vietnam, Canada, China
- Languages at home
- 76% English-only · Spanish 12% Vietnamese 6% Other Asian/Pacific 3%
Political lean MEDSL · Sedgwick
- 2024 margin
- R (+13.8) · D 42.3% · R 56.1% · Other 1.6%
- 2008→2024 swing
- -1.1pp toward R · 2008: -12.7pp · 2024: -13.8pp
- All cycles
- 2024: R+13.8 2020: R+12.6 2016: R+19.1 2012: R+19.7 2008: R+12.7
Not yet ingested
- Civics
- —
Market trends
- HPI YoY
- ▲ 77.21%
- Current HPI
- 331.68
- Rent YoY
- —
- Metro
- —
- State GDP YoY
- —
- F500 in state
- 0
Price history
2 events — show timeline
- 2026-05-12 Pending — SCKMLS as Distributed by MLS Grid
- 2026-05-05 Listed $379,900 SCKMLS as Distributed by MLS Grid
Cash-flow waterfall
monthlySold comps — $/sqft
last 12 mo · ≤1 miLoading sold comps…