 🏷️ Likely Rental
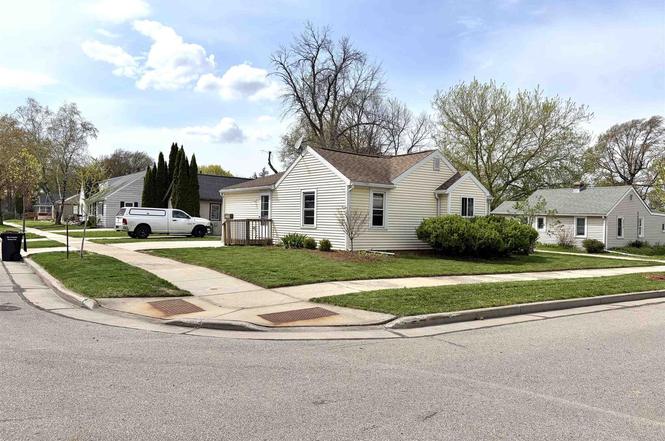
326 E Wilson Ave · Appleton, WI
Flood risk 1/10 · Minimal
- FEMA flood zone
- X (unshaded)
- Chance of flooding over 30 yrs
- 0.0%
- Est. flood insurance / yr
- $473 – $860
Fire risk 1/10 · Minimal
- Est. fire insurance / yr
- $636 – $1,182
Heat risk 2/10 · Minimal
- Hot days now (above 97°F)
- 7 days/yr
- Hot days in 30 yrs
- 12 days/yr
Wind risk 2/10 · Minimal
- Chance of severe wind over 30 yrs
- —
Air-quality risk 2/10 · Minimal
- Unhealthy air days now
- 1 days/yr
- Unhealthy air days in 30 yrs
- 2 days/yr
Risk factors via First Street. Map © Google.
Why this score? — see what drove the C- grade
The composite is a weighted blend of 9 inputs, each scored 0–100. Each bar is that input's sub-score; the figure is the points it added to the 100-point composite (weight × sub-score).
- Cash flow +17.5/30.0
- ARV discount +15.0/15.0
- DSCR +5.5/10.0
- Livability +4.1/5.0
- 1% rule +3.4/10.0
- Schools +3.0/10.0
- Rent growth +2.5/5.0
- Condition / age +2.5/5.0
- Appreciation +0.0/10.0
$149,900
🖨 Deal sheet (PDF) 📄 Offer letter ✓ Due diligence
Listing remarks MLS
Great rental opportunity!! 2 bed 1.5 bath home is tenant occupied and comes with plenty of updates. Rented for $1,399 per month. Tenants pay all utilities. Heat is electric. Seller is WI Licensed Realtor. Showings can be scheduled from 4pm-7pm only Mon-Fri. No weekend showings. Please allow 24 hour notice for showing requests. Solid property! Property being sold in As-Is Condition.
Key facts
- 3,484 sq ft lot
- Built 1940
- Listed 43 days
Property features AI
Finance
- Other: Lot under 1/2 acre (approx. 0.08 acre); Zoned residential
Exterior
- Utilities: Municipal water; Municipal sewer; Electric service
- Home design: Single-family, 1-story home; Construction completed
- Construction: Finished above-grade living area about 1,132; Finished below-grade area none; Assessor/public record used for year built
- Exterior features: Vinyl exterior; Storage shed
Interior
- Kitchen: Dishwasher; Range/Oven; Refrigerator
- Bedrooms: Master bedroom (Main) about 14 x 9; Second bedroom (Main) about 10 x 9
- Bathrooms: One full bath; One half bath
- Heating & cooling: Electric heat
- Interior features: Partial block basement
Neighborhood map
What this means for you Summary
Snapshot
- This is a 2-bed/1.5-bath single-family listed at $150k.
Deal economics
- At list price, monthly cash flow is $114 ($1k/yr) — positive.
- The deal already cash-flows at list — no discount required.
- To meet the 1% rule (rent ≥ 1% of price), the offer needs to be $126k (15.6% below list).
- Recommended offer: $126k (15.6% below list) — sets the bar for 1% rule.
- Cap rate 7.2% vs local median 3.8% in Appleton — top-decile yield for the area; either an underpriced asset or a hidden risk that comps aren't pricing in. Stress-test before assuming the spread holds.
Location & tenants
- Location reads 82/100 on livability (#44 in WI, #1,073 nationally) — a professional / high-income tenant draw. Strengths: commute A+, cost of living A+, housing A+; Watch: amenities C-.
- Appleton Area School District (urban): math 33% / reading 36% proficiency, ranked #224 of 342 in WI (top 66%) — families likely to look elsewhere, expect single-tenant / working-renter base with shorter leases.
- Market conditions: 71 active listings in the ZIP; 16 comparable units currently listed for rent nearby; rentals at typical pace (median 22d on market — plan ~3-4 weeks tenant-placement turnaround); solid renter incomes; 191 units permitted in Calumet County in 2024 (0 in 5+ unit buildings).
- This rent is only 17% of the median local income ($87k/yr) — well below the 30% rent-burden line; pricing power to push rent on renewal without tenant pushback.
Forward outlook
- Local home prices are declining (-3.0%/yr); year-one equity from $1k of loan paydown is wiped out by about $4k of value loss. Plan a longer hold.
- Calumet County population projected to shrink 5% by 2050 — rents likely to lag national; underwrite the cash flow, not the appreciation.
Negotiation context
- It's been on market 43 days — a 3% lower offer ($145k) is reasonable based on typical stale-listing flexibility.
- 2 sale attempts with the ask held roughly flat each time — persistent listings suggest the price (not the market) is what's stuck; bring a comps-based counter.
Risks & watch-outs
- Watch-outs: built in 1940 — expect roof / HVAC / electrical / plumbing capex.
Questions for the listing agent
- It's been on market 43 days. Have you received any prior offers? Is the seller open to a 16% concession, seller financing, or rate buy-down credit?
- Built in 1940 — when were the roof, HVAC, electrical panel, plumbing, and water heater last replaced?
- Is there a deadline driving the sale (1031 exchange, divorce, estate, relocation)? That informs how much negotiation room exists.
- What's the average days-on-market for RENTAL listings here right now (not sales)? A rising rental-DOM trend means longer vacancies and softer asking-rent achievability than the comps imply.
- What's the recent tenant-quality profile in this submarket — average credit score on applications, eviction rate, late-payment / NSF rate, and stable-employment percentage? A property-management company in the area should have these aggregated.
- How much new for-sale + rental construction is in the pipeline within 1–3 miles? Heavy new supply typically softens prices + rents 12–24 months out; constrained supply supports both.
Investment metrics
- 1% rule
- 0.84% ✗
- Cap rate
- 7.21%
- Cash-on-cash
- 3.27%
- DSCR
- 1.15
- GRM
- 9.9
CMA / ARV
- ARV (median comp)
- $235,607
- List price
- $149,900
- Delta
- -36.38%
- Verdict
- UNDERPRICED
- Comps
- 20 within 1.0 mi
Show comp detail 12 sales within ~0.75 mi
| Address | Dist | Beds/Ba | Sqft | Sold | Price | $/sf | Match |
|---|---|---|---|---|---|---|---|
| 326 E Wilson Ave | 0.00mi | 2/1.5 | 1,132 (0%) | 0mo | $155,000 | $137 | 100 |
| 2401 S Jackson St | 0.08mi | 2/1.5 | 1,224 (+8%) | 5mo | $210,000 | $172 | 79 |
| 324 E Hoover Ave | 0.15mi | 3/1.0 (+1) | 1,120 (-1%) | 8mo | $230,000 | $205 | 78 |
| 313 E Coolidge Ave | 0.15mi | 3/1.0 (+1) | 1,186 (+5%) | 2mo | $242,000 | $204 | 77 |
| 727 E Calumet St | 0.36mi | 3/1.0 (+1) | 1,100 (-3%) | 1mo | $255,000 | $232 | 71 |
| 407 E Calumet St | 0.20mi | 3/1.0 (+1) | 1,056 (-7%) | 4mo | $217,500 | $206 | 69 |
| 1306 S Lawe St | 0.69mi | 2/2.0 | 1,152 (+2%) | 2mo | $255,000 | $221 | 61 |
| 2100 S Madison St | 0.15mi | 3/1.5 (+1) | 1,290 (+14%) | 8mo | $280,000 | $217 | 58 |
| 16 Ramlen Ct | 0.32mi | 3/1.5 (+1) | 1,270 (+12%) | 4mo | $227,500 | $179 | 56 |
| 1625 S Carpenter St | 0.55mi | 2/1.0 | 1,234 (+9%) | 8mo | $220,000 | $178 | 50 |
| 35 Foster Ct | 0.43mi | 3/1.0 (+1) | 1,236 (+9%) | 9mo | $240,000 | $194 | 50 |
| 2327 S Meadowview Ln | 0.71mi | 3/1.0 (+1) | 1,260 (+11%) | 9mo | $220,000 | $175 | 34 |
Match score weights: distance 35% · size 25% · config 20% · recency 20%. Top-matched comps best support the ARV.
Projected returns pro-forma
-3.0% appreciation · 3.0% rent growth · sell at horizon
- IRR
- -11.2%
- Equity multiple
- 0.59×
- Total profit
- $-17,089
- Equity at exit
- $22,351
- IRR
- -2.0%
- Equity multiple
- 0.86×
- Total profit
- $-5,813
- Equity at exit
- $12,961
Cash invested: $41,972 (down + closing). Projections, not guarantees.
Landlord ↔ Tenant lean methodology
- Overall (STATE)
- 73 Landlord-Friendly
- State Wisconsin
- 73 Landlord-Friendly · R+2
- County
- — inherits STATE
- City
- — inherits STATE
ZIP-level market 54915
- Active inventory
- 71
- Price-to-rent
- 9.9×
Monthly cashflow live
- Estimated rent
- $1,265 high interval (Pro) →
- Mortgage (P&I)
- −$786
- Tax from tax record
- −$37 /mo · $438/yr
- Insurance
- −$62
- HOA
- −$0
- Vacancy / Maint / Mgmt
- −$266
- Net cashflow
- $114
Break-even live
Sensitivity live
| Price | -10% $199 | -5% $157 | +0% $114 | +5% $72 | +10% $29 |
|---|---|---|---|---|---|
| Rent | -10% $14 | -5% $64 | +0% $114 | +5% $164 | +10% $214 |
| Rate | -1.0pp $190 | -0.5pp $152 | base $114 | +0.5pp $75 | +1.0pp $36 |
UW: 25.0% down · 7.5% · 30yr · 1.5% tax · 5.0% vac · 8.0% maint · 8.0% mgmt
Financing live
Cash to close
- Down payment
- $37,475
- Closing costs
- $4,497
- Reserves months
- —
- Total cash needed
- —
Loan-product check · same deal, 3 products live
Conventional
25% down · 7.5% · 30yr
- Down + closing
- —
- Monthly P&I
- —
- Monthly cashflow
- —
- DSCR
- —
- Eligible?
- —
Personal DTI + credit; lowest rate.
DSCR
20% down · 8.5% · 30yr
- Down + closing
- —
- Monthly P&I
- —
- Monthly cashflow
- —
- DSCR
- —
- Eligible?
- —
No personal income docs; deal must DSCR.
Hard money
10% down · 12.0% · 12mo
- Down + closing
- —
- Monthly P&I
- —
- Monthly cashflow
- —
- DSCR
- —
- Eligible?
- —
Short-term bridge; refi at stabilization.
Rent comps 16 comps
| Address | Beds | Baths | Sqft | Rent | $/sqft | DOM | Units | Dist |
|---|---|---|---|---|---|---|---|---|
| 205 W Calumet St Appleton, WI | 2.0 | 1.0 | 830 | $1,099 | $1.32 | 14d | 4 | 0.36mi |
| 2405 Honey Lou Ct Unit 2405 05 Appleton, WI | 1.0 | 1.0 | 750 | $899 | $1.20 | 14d | 1 | 0.50mi |
| 2500 Wilson Ct Unit 1 Appleton, WI | 2.0 | 1.5 | 1100 | $1,025 | $0.93 | 21d | 1 | 0.55mi |
| 300 Schindler Pl Menasha, WI | 2.0–3.0 | 1.0–2.0 | 995 | $1,195 | $1.20 | 14d | 3 | 0.58mi |
| 1212 E Sylvan Ave Unit 1212 Appleton, WI | 2.0 | 1.0 | 864 | $1,200 | $1.39 | 14d | 1 | 0.76mi |
| 432 W Seymour St Unit 1061612P Appleton, WI | 1.0 | 1.0 | 796 | $2,349 | $2.95 | 44d | 1 | 0.77mi |
| 1284 Midway Rd Menasha, WI | 2.0–4.0 | 1.0–2.0 | 800 | $1,250 | $1.56 | 21d | 1 | 1.26mi |
| 839 E John St Unit lower Appleton, WI | 3.0 | 1.0 | 1200 | $1,400 | $1.17 | 21d | 1 | 1.35mi |
| 1500 Palisades Dr Unit 1061611P Appleton, WI | 3.0 | 2.0 | 1496 | $6,793 | $4.54 | 14d | 1 | 1.40mi |
| 1300 Lucerne Dr Unit 1340-06 Menasha, WI | 2.0 | 2.0 | 1100 | $1,239 | $1.13 | 21d | 1 | 1.41mi |
| 1300 Lucerne Dr Unit 1350-07 Menasha, WI | 1.0 | 1.0 | 990 | $1,019 | $1.03 | 21d | 1 | 1.41mi |
| 1300 Lucerne Dr Menasha, WI | 1.0 | 1.0 | 990 | $1,019 | $1.03 | 21d | 1 | 1.44mi |
| 105 W College Ave Appleton, WI | 1.0–2.0 | 1.0–2.0 | 843 | $1,975 | $2.34 | 14d | 15 | 1.45mi |
| 320 E College Ave Unit 204 Appleton, WI | 2.0 | 2.0 | 1298 | $2,500 | $1.93 | 21d | 1 | 1.46mi |
| 320 E College Ave Unit 208 Appleton, WI | 2.0 | 2.0 | 1443 | $2,400 | $1.66 | 44d | 1 | 1.46mi |
| 118 N Durkee St Appleton, WI | 1.0–2.0 | 1.0–2.0 | 849 | $1,850 | $2.18 | 14d | 3 | 1.50mi |
Listing history 22 events
-
2026-06-16status $149,900 Pending 43 DOM
-
2026-06-16days on market $149,900 Active w/ Contract 43 DOM
-
2026-06-15days on market $149,900 Active w/ Contract 42 DOM
-
2026-06-14days on market $149,900 Active w/ Contract 40 DOM
-
2026-06-13days on market $149,900 Active w/ Contract 39 DOM
-
2026-06-10days on market $149,900 Active w/ Contract 37 DOM
-
2026-06-09days on market $149,900 Active w/ Contract 36 DOM
-
2026-06-08days on market $149,900 Active w/ Contract 35 DOM
-
2026-06-07days on market $149,900 Active w/ Contract 34 DOM
-
2026-06-05days on market $149,900 Active w/ Contract 31 DOM
-
2026-06-03days on market $149,900 Active w/ Contract 30 DOM
-
2026-06-02days on market $149,900 Active w/ Contract 29 DOM
-
2026-06-01days on market $149,900 Active w/ Contract 28 DOM
-
2026-05-31days on market $149,900 Active w/ Contract 27 DOM
-
2026-05-30days on market $149,900 Active w/ Contract 26 DOM
-
2026-05-07historical Active w/ Contract 425-char remark
-
2026-05-04$149,900 Active 425-char remark
-
2026-03-18historical 384-char remark
Show marketing remark (384 chars)
Great rental opportunity!! 2 bed 1.5 bath home is tenant occupied and comes with plenty of updates. Rented for $1,399 per month. Tenants pay all utilities. Heat is electric. Seller is WI Licensed Realtor. Showings can be scheduled from 4pm-7pm only Mon-Fri. No weekend showings. Please allow 24 hour notice for showing requests. Solid property! Property being sold in As-Is Condition.
-
2026-01-12$150,000 Active 384-char remark
Show marketing remark (384 chars)
Great rental opportunity!! 2 bed 1.5 bath home is tenant occupied and comes with plenty of updates. Rented for $1,399 per month. Tenants pay all utilities. Heat is electric. Seller is WI Licensed Realtor. Showings can be scheduled from 4pm-7pm only Mon-Fri. No weekend showings. Please allow 24 hour notice for showing requests. Solid property! Property being sold in As-Is Condition.
-
2024-05-02soldstatus $130,000
-
2017-10-13soldstatus $74,000
-
2017-04-28soldstatus $45,500
ⓘ Source: listings_history table (triggers on properties + properties_extension) + one-shot
backfill from property_details.listing_events for pre-trigger history.
Tax reassessment forecast WI · Partial reset (capped growth)
- Current annual tax
- $438 · $37/mo
- Projected year-2 tax
- $1,606 · $134/mo
- Expected delta
- +$1,167/yr (+$97/mo · 266.4%)
ⓘ Screening estimate from a state-policy table — verify with the county assessor before closing.
Climate risk First Street
- Flood 1/10 Low FEMA zone X (unshaded) · 0% chance over 30 yrs
- Wildfire 1/10 Low
- Heat 2/10 Low 7 d/yr ≥97°F today · 12 d/yr by 30 yrs out
- Wind 2/10 Low
- Air quality 2/10 Low 1 unhealthy d/yr today · 2 by 30 yrs out
Nearby sold comps map
Loading sold comps map…
Walkable amenities ~0.75 mi
Loading nearby amenities…
Taxation est. · year 1
- Rental income
- $15,179
- − Mortgage interest
- −$8,397
- − Property taxes
- −$438
- − Insurance
- −$750
- − Repairs & maintenance
- −$1,214
- − Management
- −$1,214
- − Depreciation
- −$4,361
- Taxable loss
- −$1,195
- Est. tax savings @ 24.0%
- +$287
- After-tax cash flow
- $1,657/yr
For passive investors: Depreciation is non-cash, so a rental often shows a tax loss while cash-flowing — sheltering income. Rental losses are passive: they offset passive income freely, and up to $25,000/yr can offset ordinary (W-2) income if you actively participate and your MAGI is under $100k (phasing out to $0 by $150k); unused losses carry forward. On sale, claimed depreciation is recaptured at up to 25%, and gains may owe capital-gains tax (a 1031 exchange can defer both). Figures are a year-1 estimate at your 24.0% rate — not tax advice; consult a CPA.
Schools (NCES district)
- District
- Appleton Area School District
- NCES district ID
- 5500390
- Math proficiency
- 33% ▼ -6.00%
- Reading proficiency
- 36% ▼ -1.00%
- Median HH income
- $53,892
- Composite
- 30.3/100
- National rank
- #6279
- State rank
- #224 of 342 in WI
Livability — Appleton
- Score
- 82/100
- State rank
- #44
- US rank
- #1073
Category grades
Schools grade is shown separately in the Schools card above.
Census & demographics
- Census place
- Appleton, WI
- County
- Outagamie County · 155,051 people
- City population
- 126,671
- Metro
- Appleton, WI
- Population (ZIP)
- 44,367
- Household income
- $87,426
- Rent vs Own
- Severe rent burden
- 684.0
Population outlook (Calumet County) Hauer SSP2
- Today (2025)
- 51,228 people
- By 2030
- 51,515 · +0.6%
- By 2040
- 51,080 · -0.3%
- By 2050
- 48,824 · -4.7%
- By 2075
- 42,337 · -17.4%
- By 2100
- 32,629 · -36.3%
Race, ethnicity, and origin ACS 2023
- Neighborhood character
- Predominantly White (83%)
- Race & ethnicity
- White 83% Two or more races 6% Asian 6% Hispanic / Latino 6% Black 2%
- Hispanic origin (detail)
- Mexican 4%
- Common ancestry
- Romanian 8% Iranian 5% Portuguese 4%
- Foreign-born
- 6% · Canada, Vietnam, China
- Languages at home
- 91% English-only · Other Asian/Pacific 3% Spanish 3% Other Indo-European 1%
Political lean MEDSL · Calumet
- 2024 margin
- R (+20.0) · D 39.3% · R 59.3% · Other 1.4%
- 2008→2024 swing
- -22.1pp toward R · 2008: 2.2pp · 2024: -20.0pp
- All cycles
- 2024: R+20.0 2020: R+19.6 2016: R+21.6 2012: R+11.6 2008: D+2.2
Not yet ingested
- Civics
- —
Market trends
- HPI YoY
- ▼ -219.05%
- Current HPI
- 212.4897
- Rent YoY
- —
- Metro
- Appleton, WI
- State GDP YoY
- ▲ 2.10%
- F500 in state
- 20
Industry mix (Fortune 500 HQ in WI)
| Industry | F500 HQs | Revenue |
|---|---|---|
| Industrial Machinery | 4 | $23B |
|
||
| Industrial Technology | 2 | $36B |
|
||
| Insurance | 1 | $36B |
|
||
| Professional Services | 1 | $19B |
|
||
| Utilities | 1 | $9B |
|
||
| Consumer Goods | 1 | $3B |
|
||
Price history
+240.7% since first listed9 events — show timeline
- 2026-06-16 Pending — RANW
- 2026-06-12 Sold (MLS) $155,000 RANW
- 2026-05-07 Contingent — RANW
- 2026-05-04 Listed $149,900 RANW
- 2026-03-18 Listing Removed — RANW
- 2026-01-12 Listed $150,000 RANW
- 2024-05-02 Sold (Public Records) $130,000 Public Records
- 2017-10-13 Sold (Public Records) $74,000 Public Records
- 2017-04-28 Sold (Public Records) $45,500 Public Records
Property tax history
-11.2%/yrLatest (2025): $438 · +12.1% YoY. Source: county tax records.
Cash-flow waterfall
monthlySold comps — $/sqft
last 12 mo · ≤1 miLoading sold comps…