 Duplex
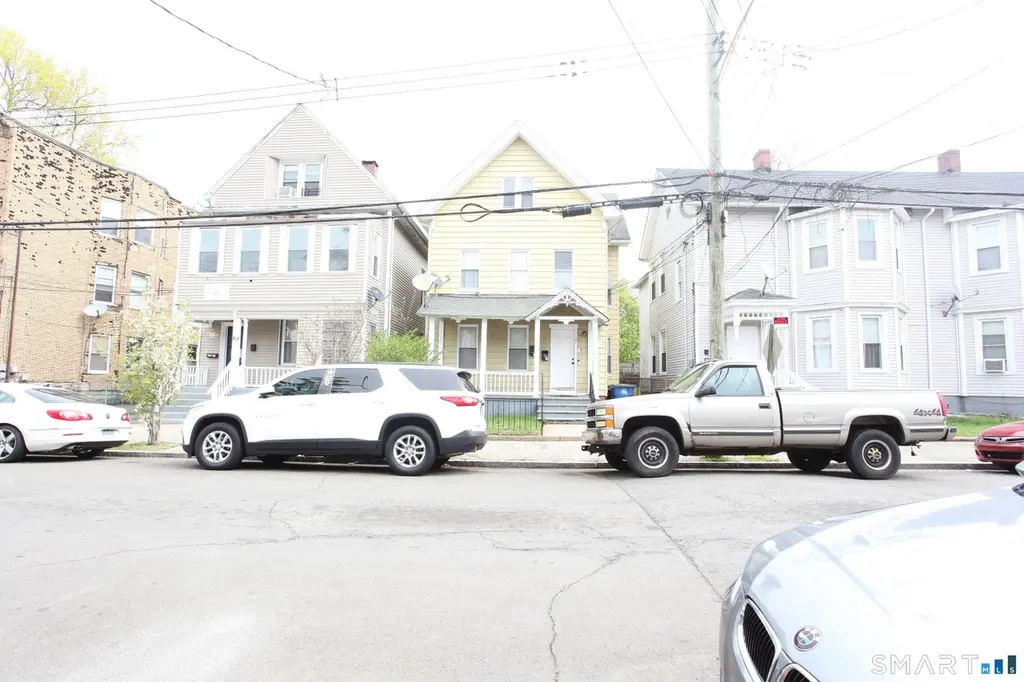
None · New Haven, CT
Flood risk 1/10 · Minimal
- FEMA flood zone
- X (unshaded)
- Chance of flooding over 30 yrs
- 0.0%
- Est. flood insurance / yr
- $473 – $860
Fire risk 1/10 · Minimal
- Est. fire insurance / yr
- $829 – $1,539
Heat risk 7/10 · Major
- Hot days now (above 99°F)
- 7 days/yr
- Hot days in 30 yrs
- 17 days/yr
Wind risk 6/10 · Moderate
- Chance of severe wind over 30 yrs
- 55.0%
Air-quality risk 5/10 · Moderate
- Unhealthy air days now
- 6 days/yr
- Unhealthy air days in 30 yrs
- 8 days/yr
Risk factors via First Street. Map © Google.
Why this score? — see what drove the D grade
The composite is a weighted blend of 9 inputs, each scored 0–100. Each bar is that input's sub-score; the figure is the points it added to the 100-point composite (weight × sub-score).
- Cash flow +14.9/30.0
- Appreciation +9.9/10.0
- DSCR +4.6/10.0
- Livability +4.0/5.0
- 1% rule +3.9/10.0
- Rent growth +3.3/5.0
- Condition / age +2.5/5.0
- Schools +1.5/10.0
- ARV discount +0.0/15.0
$499,000
🖨 Deal sheet (PDF) 📄 Offer letter ✓ Due diligence
Multi-family units
County records classify this as Multi-Family (2-4 Unit). Listing-text estimate: 2 units. confirmed
Listing remarks MLS
Investors.. Well maintained 2 family house ...both units are occupied.. laundry includes washer and dryer in basement for both units... HOme was renovated in 2019. add this one to your portfolio.
Key facts
- Renovated
- Well maintained
- 3,484 sq ft lot
Tags
Property features AI
Finance
- Other: Property listed as multi-family for sale
- Financial info: No investor financials or income/expense details provided
- HOA & community: No HOA or community details provided
Exterior
- Parking: No parking details provided
- Security: No security details provided
- Utilities: Public water connected; Public sewer connected
- Home design: Multi-family 2-family property
- Construction: Frame construction; Masonry foundation; Asphalt shingle roof
- Exterior features: Level lot; Vinyl siding
Interior
- Kitchen: No kitchen appliance details provided
- Bedrooms: 6 total bedrooms
- Flooring: No flooring details provided
- Bathrooms: 2 full bathrooms
- Heating & cooling: Hot air heating; Natural gas heat fuel; 40-gallon hot water tank
- Interior features: Finished walk-up attic; Full basement
- Laundry & utility: Laundry located in basement; Washer and dryer included for all units
Neighborhood map
What this means for you Summary
Snapshot
- This is a 2 × 3-bed/1.0-bath units multifamily listed at $499k.
Deal economics
- At list price, monthly cash flow is $151 ($2k/yr) — positive. Per door: $75/mo.
- The deal already cash-flows at list — no discount required.
- To meet the 1% rule (rent ≥ 1% of price), the offer needs to be $446k (10.6% below list).
- Recommended offer: $446k (10.6% below list) — sets the bar for 1% rule.
- Cap rate 6.7% vs local median 4.8% in New Haven — top-decile yield for the area; either an underpriced asset or a hidden risk that comps aren't pricing in. Stress-test before assuming the spread holds.
Location & tenants
- Location reads 79/100 on livability (#31 in CT, #2,190 nationally) — a middle-class / working-renter tenant base. Strengths: amenities A+, commute A+, health & safety A+; Watch: schools D+, employment D, crime F.
- New Haven School District (urban): math 12% / reading 25% proficiency, ranked #147 of 153 in CT (top 96%) — low school quality limits family demand, transient renter base, plan for 1-2y turnover; 66% free/reduced lunch — lower-income household profile, screen leases tightly.
- Market conditions: Rents rising (+3.3%/yr); 46 active listings in the ZIP; 15 comparable units currently listed for rent nearby; rentals at typical pace (median 22d on market — plan ~3-4 weeks tenant-placement turnaround); 1,059 units permitted in South Central Connecticut Planning Region in 2024 (779 in 5+ unit buildings).
- At $4,459/mo this rent would consume 108% of the median local household income ($50k/yr) (locally 1321% of renters already pay >50% of income on rent) — very limited rent-growth headroom before tenants either downsize or default.
Forward outlook
- In year one you build about $52k of equity ($3k loan paydown + $49k appreciation (9.8% local appreciation)).
- At projected returns (9.8% appreciation + 3.3% rent growth), your $140k cash investment doubles in ~3 years — after that, you're playing with house money.
- By year 2, paydown + projected appreciation supports a ~$84k cash-out refi (75% LTV) — recoverable capital for the next deal without selling this one.
Negotiation context
- It's been on market 33 days — a 3% lower offer ($484k) is reasonable based on typical stale-listing flexibility.
- 6 sale attempts since 8y ago with the ask held roughly flat each time — persistent listings suggest the price (not the market) is what's stuck; bring a comps-based counter.
- Current owner paid $300k; list at $499k implies a 66% gain — meaningful room to come down on a strong offer.
Risks & watch-outs
- Watch-outs: built in 1900 — expect roof / HVAC / electrical / plumbing capex.
- Climate carrying-cost: major wind risk, 55% chance of damaging wind over 30y; extreme-heat days projected 7→17/yr by 2055 (HVAC capex compounding) — expect insurance premiums to compound above CPI over the hold.
Questions for the listing agent
- It's been on market 33 days. Have you received any prior offers? Is the seller open to a 11% concession, seller financing, or rate buy-down credit?
- Can we see the unit-by-unit rent roll, current vacancy, and any below-market leases? What's the average tenancy length?
- What capital expenditures (roof, boiler, parking lot, exteriors) have been made in the last 5 years, and what's planned in the next 2?
- Built in 1900 — when were the roof, HVAC, electrical panel, plumbing, and water heater last replaced?
- Is there a deadline driving the sale (1031 exchange, divorce, estate, relocation)? That informs how much negotiation room exists.
- Schools are D-rated, which usually means shorter tenancies and higher turnover. Who's the typical renter profile here, and what's been the actual vacancy rate?
- Crime grade is F in this area — have there been break-ins, vandalism, or insurance claims at this property in the last 3 years? What carrier currently insures it and at what premium?
- The area grade is low — what's the realistic commute time and amenity access for the typical tenant pool here? Any planned neighborhood developments (good or bad) we should know about?
- What's the average days-on-market for RENTAL listings here right now (not sales)? A rising rental-DOM trend means longer vacancies and softer asking-rent achievability than the comps imply.
- What's the recent tenant-quality profile in this submarket — average credit score on applications, eviction rate, late-payment / NSF rate, and stable-employment percentage? A property-management company in the area should have these aggregated.
- How much new apartment / multifamily construction is in the pipeline within 1–3 miles? Heavy new supply (>2% of stock underway) typically softens rents 12–24 months out; light construction supports rent growth.
Investment metrics
- 1% rule
- 0.89% ✗
- Cap rate
- 6.66%
- Cash-on-cash
- 1.29%
- DSCR
- 1.06
- GRM
- 9.3
CMA / ARV
- ARV (on-the-fly)
- $351,912
- Comps found
- 12
Show comp detail 12 sales within ~0.75 mi
| Address | Dist | Beds/Ba | Sqft | Sold | Price | $/sf | Match |
|---|---|---|---|---|---|---|---|
| 61 Stevens St | 0.00mi | 6/2.0 | 2,046 (0%) | 14mo | $300,000 | $147 | 89 |
| 56 Ann St | 0.26mi | 5/3.0 (-1) | 2,067 (+1%) | 6mo | $407,000 | $197 | 72 |
| 45 Kossuth St | 0.21mi | 6/3.0 | 2,153 (+5%) | 11mo | $425,000 | $197 | 69 |
| 33 Stevens St | 0.08mi | 7/2.0 (+1) | 2,205 (+8%) | 14mo | $320,000 | $145 | 66 |
| 45 Frank St | 0.52mi | 6/3.0 | 2,120 (+4%) | 4mo | $430,000 | $203 | 62 |
| 97 Scranton St | 0.27mi | 5/3.0 (-1) | 2,169 (+6%) | 9mo | $215,000 | $99 | 61 |
| 312 Davenport Ave | 0.24mi | 6/2.0 | 2,348 (+15%) | 6mo | $312,000 | $133 | 59 |
| 95 Frank St | 0.58mi | 6/3.0 | 2,243 (+10%) | 2mo | $385,000 | $172 | 52 |
| 171 Frank St | 0.66mi | 5/3.0 (-1) | 1,975 (-4%) | 10mo | $340,000 | $172 | 46 |
| 28 Frank St | 0.52mi | 7/2.0 (+1) | 2,282 (+12%) | 8mo | $330,000 | $145 | 45 |
| 800 George St | 0.58mi | 5/3.0 (-1) | 2,282 (+12%) | 4mo | $320,000 | $140 | 41 |
| 167 Gilbert St | 0.72mi | 6/3.0 | 2,249 (+10%) | 10mo | $480,000 | $213 | 38 |
Match score weights: distance 35% · size 25% · config 20% · recency 20%. Top-matched comps best support the ARV.
Projected returns pro-forma
9.81% appreciation · 3.3% rent growth · sell at horizon
- IRR
- 24.9%
- Equity multiple
- 2.98×
- Total profit
- $276,231
- Equity at exit
- $442,622
- IRR
- 22.1%
- Equity multiple
- 6.78×
- Total profit
- $807,019
- Equity at exit
- $947,265
Cash invested: $139,720 (down + closing). Projections, not guarantees.
Landlord ↔ Tenant lean methodology
- Overall (STATE)
- 27 Tenant-Leaning
- State Connecticut
- 27 Tenant-Leaning · D+7
- County
- — inherits STATE
- City
- — inherits STATE
ZIP-level market 06519
- Home prices YoY
- 2.7%
- Rents YoY
- 3.3%
- Active inventory
- 46
- Price-to-rent
- 18.7×
Monthly cashflow live
- Estimated rent
- $4,459 high interval (Pro) →
- Mortgage (P&I)
- −$2,617
- Tax from tax record
- −$547 /mo · $6,567/yr
- Insurance
- −$208
- HOA
- −$0
- Vacancy / Maint / Mgmt
- −$936
- Net cashflow
- $151
Break-even live
Sensitivity live
| Price | -10% $433 | -5% $292 | +0% $151 | +5% $9 | +10% $-132 |
|---|---|---|---|---|---|
| Rent | -10% $-202 | -5% $-25 | +0% $151 | +5% $327 | +10% $503 |
| Rate | -1.0pp $402 | -0.5pp $278 | base $151 | +0.5pp $21 | +1.0pp $-110 |
2-unit breakdown (identical units grouped — click to expand)
| Units | Beds | Baths | Est. rent |
|---|---|---|---|
| 2× units | 3 | 1 | $4,458 |
| #1 | 3 | 1 | $2,229 |
| #2 | 3 | 1 | $2,229 |
| Total (2 units) | $4,459 | ||
UW: 25.0% down · 7.5% · 30yr · 1.5% tax · 5.0% vac · 8.0% maint · 8.0% mgmt
Financing live
Cash to close
- Down payment
- $124,750
- Closing costs
- $14,970
- Reserves months
- —
- Total cash needed
- —
Loan-product check · same deal, 3 products live
Conventional
25% down · 7.5% · 30yr
- Down + closing
- —
- Monthly P&I
- —
- Monthly cashflow
- —
- DSCR
- —
- Eligible?
- —
Personal DTI + credit; lowest rate.
DSCR
20% down · 8.5% · 30yr
- Down + closing
- —
- Monthly P&I
- —
- Monthly cashflow
- —
- DSCR
- —
- Eligible?
- —
No personal income docs; deal must DSCR.
Hard money
10% down · 12.0% · 12mo
- Down + closing
- —
- Monthly P&I
- —
- Monthly cashflow
- —
- DSCR
- —
- Eligible?
- —
Short-term bridge; refi at stabilization.
Rent comps 15 comps
| Address | Beds | Baths | Sqft | Rent | $/sqft | DOM | Units | Dist |
|---|---|---|---|---|---|---|---|---|
| 131 Dwight St Unit 1 New Haven, CT | 6.0 | 3.0 | 3000 | $6,250 | $2.08 | 15d | 1 | 0.53mi |
| 395 Crown St New Haven, CT | 6.0 | 3.5 | 2889 | $7,195 | $2.49 | 44d | 1 | 0.56mi |
| 67 Edgewood Ave New Haven, CT | 7.0 | 2.5 | 2000 | $6,100 | $3.05 | 44d | 1 | 0.69mi |
| 229 Dwight St New Haven, CT | 6.0 | 2.0 | 2400 | $4,995 | $2.08 | 3d | 1 | 0.72mi |
| 84 Morris St Unit 2nd Fl New Haven, CT | 5.0 | 2.0 | 1410 | $1,825 | $1.29 | 3d | 1 | 0.83mi |
| 34 Cassius St Unit 36 New Haven, CT | 5.0 | 2.0 | 1872 | $2,300 | $1.23 | 44d | 1 | 0.95mi |
| 355 Norton St Unit 1 New Haven, CT | 5.0 | 2.5 | 2500 | $3,300 | $1.32 | 22d | 1 | 1.22mi |
| 1519 Ella T Grasso Blvd Unit N/A New Haven, CT | 5.0 | 2.0 | 2750 | $4,450 | $1.62 | 24d | 1 | 1.25mi |
| 50 Admiral St New Haven, CT | 5.0 | 2.0 | 2157 | $2,700 | $1.25 | 20d | 1 | 1.29mi |
| 55 Admiral St Unit 2 New Haven, CT | 5.0 | 3.0 | 2000 | $3,295 | $1.65 | 24d | 1 | 1.31mi |
| 54 Trumbull St Unit 54-1 New Haven, CT | 5.0 | 2.5 | 2250 | $6,695 | $2.98 | 15d | 1 | 1.33mi |
| 432 Norton Pkwy New Haven, CT | 5.0 | 3.0 | 2493 | $4,195 | $1.68 | 44d | 1 | 1.38mi |
| 30 Trumbull St New Haven, CT | 5.0 | 4.0 | 2668 | $5,000 | $1.87 | 4d | 1 | 1.39mi |
| 134 Mansfield St New Haven, CT | 5.0 | 2.0 | 1960 | $5,500 | $2.81 | 24d | 1 | 1.40mi |
| 41 Osborn Ave New Haven, CT | 5.0 | 1.5 | 1500 | $1,800 | $1.20 | 4d | 1 | 1.45mi |
Listing history 31 events
-
2026-06-18days on market $499,000 Active 33 DOM
-
2026-06-17days on market $499,000 Active 32 DOM
-
2026-06-16days on market $499,000 Active 31 DOM
-
2026-06-15days on market $499,000 Active 30 DOM
-
2026-06-14days on market $499,000 Active 28 DOM
-
2026-06-13days on market $499,000 Active 27 DOM
-
2026-06-10days on market $499,000 Active 25 DOM
-
2026-06-09days on market $499,000 Active 24 DOM
-
2026-06-08days on market $499,000 Active 23 DOM
-
2026-06-07days on market $499,000 Active 22 DOM
-
2026-06-05days on market $499,000 Active 19 DOM
-
2026-06-03days on market $499,000 Active 18 DOM
-
2026-06-03days on market $499,000 Active 17 DOM
-
2026-06-01days on market $499,000 Active 16 DOM
-
2026-05-31days on market $499,000 Active 15 DOM
-
2026-05-16$499,000 Active
-
2025-06-13historical $850
-
2025-05-28$850
-
2025-05-17historical $800
-
2025-05-06$800
-
2025-04-30soldstatus $300,000 Closed 195-char remark
Show marketing remark (195 chars)
Investors.. Well maintained 2 family house ...both units are occupied.. laundry includes washer and dryer in basement for both units... HOme was renovated in 2019. add this one to your portfolio.
-
2024-11-21status Under Contract 195-char remark
Show marketing remark (195 chars)
Investors.. Well maintained 2 family house ...both units are occupied.. laundry includes washer and dryer in basement for both units... HOme was renovated in 2019. add this one to your portfolio.
-
2024-09-30price $299,000 195-char remark
Show marketing remark (195 chars)
Investors.. Well maintained 2 family house ...both units are occupied.. laundry includes washer and dryer in basement for both units... HOme was renovated in 2019. add this one to your portfolio.
-
2024-09-17$279,000 Active 195-char remark
Show marketing remark (195 chars)
Investors.. Well maintained 2 family house ...both units are occupied.. laundry includes washer and dryer in basement for both units... HOme was renovated in 2019. add this one to your portfolio.
-
2024-09-12historical $279,000 195-char remark
Show marketing remark (195 chars)
Investors.. Well maintained 2 family house ...both units are occupied.. laundry includes washer and dryer in basement for both units... HOme was renovated in 2019. add this one to your portfolio.
-
2022-05-16soldstatus $270,000
-
2022-05-13soldstatus $270,000 Closed 341-char remark
Show marketing remark (341 chars)
Investors take notice! Stunning , well maintained 2 Family house for sale on 61 Stevens street in the Hill neighborhood in New Haven. Renovation has been done in 2019. All 2 units are occupied. 1st floor 2 bedrooms - 1 bath , $1,000 leased; 2d & 3d floor 4 bedrooms - 1 bath, $1,495 leased; Upsite potential rents are under market price.
-
2021-09-22price $300,000 341-char remark
Show marketing remark (341 chars)
Investors take notice! Stunning , well maintained 2 Family house for sale on 61 Stevens street in the Hill neighborhood in New Haven. Renovation has been done in 2019. All 2 units are occupied. 1st floor 2 bedrooms - 1 bath , $1,000 leased; 2d & 3d floor 4 bedrooms - 1 bath, $1,495 leased; Upsite potential rents are under market price.
-
2021-08-24$320,000 Active 341-char remark
Show marketing remark (341 chars)
Investors take notice! Stunning , well maintained 2 Family house for sale on 61 Stevens street in the Hill neighborhood in New Haven. Renovation has been done in 2019. All 2 units are occupied. 1st floor 2 bedrooms - 1 bath , $1,000 leased; 2d & 3d floor 4 bedrooms - 1 bath, $1,495 leased; Upsite potential rents are under market price.
-
2018-07-16historical
-
2018-05-15$75,000
ⓘ Source: listings_history table (triggers on properties + properties_extension) + one-shot
backfill from property_details.listing_events for pre-trigger history.
Tax reassessment forecast CT · Partial reset (capped growth)
- Current annual tax
- $6,567 · $547/mo
- Projected year-2 tax
- $8,623 · $719/mo
- Expected delta
- +$2,056/yr (+$171/mo · 31.3%)
ⓘ Screening estimate from a state-policy table — verify with the county assessor before closing.
Climate risk First Street
- Flood 1/10 Low FEMA zone X (unshaded) · 0% chance over 30 yrs
- Wildfire 1/10 Low
- Heat 7/10 Severe 7 d/yr ≥99°F today · 17 d/yr by 30 yrs out
- Wind 6/10 Major 55% chance of damaging wind over 30 yrs
- Air quality 5/10 Major 6 unhealthy d/yr today · 8 by 30 yrs out
Nearby sold comps map
Loading sold comps map…
Walkable amenities ~0.75 mi
Loading nearby amenities…
Taxation est. · year 1
- Rental income
- $53,508
- − Mortgage interest
- −$27,952
- − Property taxes
- −$6,567
- − Insurance
- −$2,495
- − Repairs & maintenance
- −$4,281
- − Management
- −$4,281
- − Depreciation
- −$14,516
- Taxable loss
- −$6,583
- Est. tax savings @ 24.0%
- +$1,580
- After-tax cash flow
- $3,388/yr
For passive investors: Depreciation is non-cash, so a rental often shows a tax loss while cash-flowing — sheltering income. Rental losses are passive: they offset passive income freely, and up to $25,000/yr can offset ordinary (W-2) income if you actively participate and your MAGI is under $100k (phasing out to $0 by $150k); unused losses carry forward. On sale, claimed depreciation is recaptured at up to 25%, and gains may owe capital-gains tax (a 1031 exchange can defer both). Figures are a year-1 estimate at your 24.0% rate — not tax advice; consult a CPA.
Schools (NCES district)
- District
- New Haven School District
- NCES district ID
- 0902790
- Math proficiency
- 12% ▼ -10.00%
- Reading proficiency
- 25% ▼ -10.00%
- Median HH income
- $38,058
- Composite
- 15.48/100
- National rank
- #9308
- State rank
- #147 of 153 in CT
Livability — New Haven
- Score
- 79/100
- State rank
- #31
- US rank
- #2190
Category grades
Schools grade is shown separately in the Schools card above.
Census & demographics
- Census place
- New Haven, CT
- County
- New Haven County · 688,236 people
- City population
- 132,813
- Metro
- New Haven-Milford, CT
- Population (ZIP)
- 15,605
- Household income
- $49,619
- Rent vs Own
- Severe rent burden
- 1321.0
Population outlook (South Central Connecticut County) Hauer SSP2
- By 2040
- 608,362
Race, ethnicity, and origin ACS 2023
- Neighborhood character
- Diverse neighborhood (Simpson 0.67)
- Race & ethnicity
- Hispanic / Latino 49% Black 26% White 15% Two or more races 13% Asian 4% Native American 1%
- Hispanic origin (detail)
- Mexican 15% Puerto Rican 25% Dominican 3%
- Common ancestry
- Romanian 1% Lithuanian 1%
- Foreign-born
- 25% · Canada, Jamaica, China
- Languages at home
- 50% English-only · Spanish 42% Other Indo-European 4% Arabic 1%
Political lean MEDSL · South Central Connecticut
- 2024 margin
- Strong D (+20.1) · D 59.0% · R 38.9% · Other 2.1%
- All cycles
- 2024: D+20.1
Not yet ingested
- Civics
- —
Market trends
- HPI YoY
- ▲ 9.81%
- Current HPI
- 377.4885
- Rent YoY
- ▲ 3.30%
- Metro
- New Haven-Milford, CT
- State GDP YoY
- ▲ 1.06%
- F500 in state
- 38
Industry mix (Fortune 500 HQ in CT)
| Industry | F500 HQs | Revenue |
|---|---|---|
| Industrial Machinery | 4 | $38B |
|
||
| Insurance | 3 | $71B |
|
||
| Financial Services | 2 | $25B |
|
||
| Transportation / Logistics | 2 | $18B |
|
||
| Healthcare | 1 | $247B |
|
||
| Telecommunications | 1 | $55B |
|
||
Price history
+565.3% since first listed16 events — show timeline
- 2026-05-16 Listed $499,000 Smart MLS
- 2025-06-13 Rental Removed $850 SMARTMLS
- 2025-05-28 Listed for Rent $850 SMARTMLS
- 2025-05-17 Rental Removed $800 SMARTMLS
- 2025-05-06 Listed for Rent $800 SMARTMLS
- 2025-04-30 Sold (MLS) $300,000 Smart MLS
- 2024-11-21 Pending — Smart MLS
- 2024-09-30 Price Changed $299,000 Smart MLS
- 2024-09-17 Listed $279,000 Smart MLS
- 2024-09-12 Coming Soon $279,000 Smart MLS
- 2022-05-16 Sold (Public Records) $270,000 Public Records
- 2022-05-13 Sold (MLS) $270,000 Smart MLS
- 2021-09-22 Price Changed $300,000 Smart MLS
- 2021-08-24 Listed $320,000 Smart MLS
- 2018-07-16 Listing Removed — Smart MLS
- 2018-05-15 Listed $75,000 Smart MLS
Property tax history
+11.2%/yrLatest (2023): $6,567 · -6.4% YoY. Source: county tax records.
Cash-flow waterfall
monthlySold comps — $/sqft
last 12 mo · ≤1 miLoading sold comps…