 🏗️ New Construction
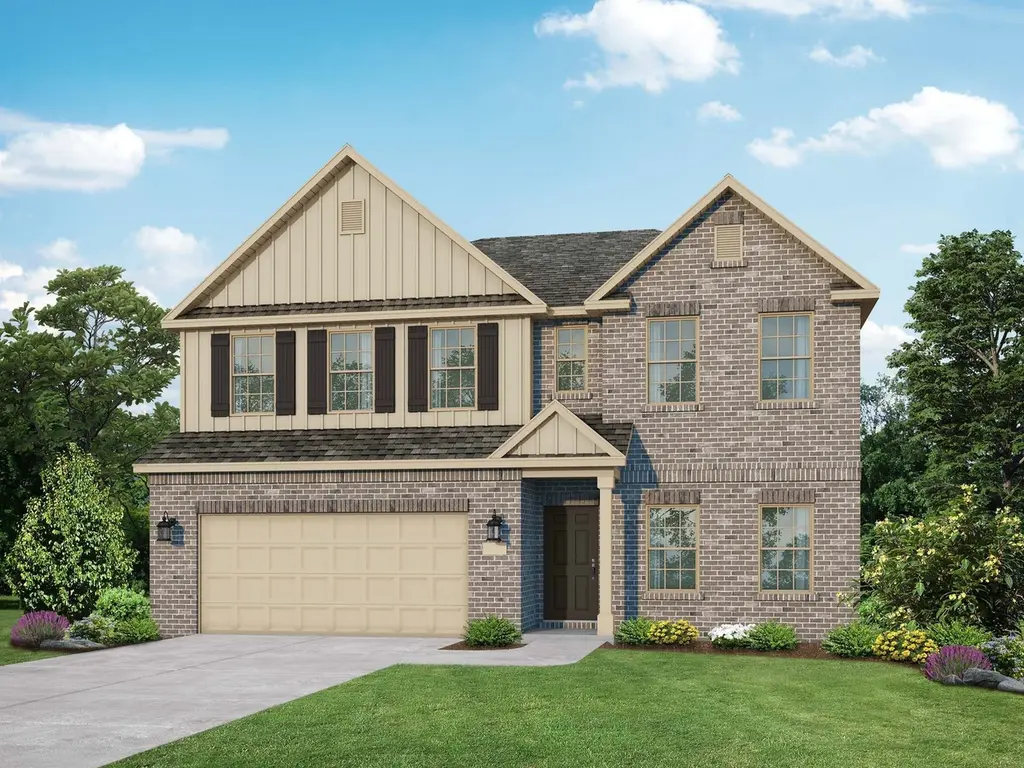
The Shelby A Plan · Huntsville, AL
Flood risk 1/10 · Minimal
- FEMA flood zone
- X (unshaded)
- Chance of flooding over 30 yrs
- 0.0%
- Est. flood insurance / yr
- $507 – $1,088
Fire risk 3/10 · Minor
- Est. fire insurance / yr
- $916 – $1,700
Heat risk 5/10 · Moderate
- Hot days now (above 105°F)
- 7 days/yr
- Hot days in 30 yrs
- 20 days/yr
Wind risk 4/10 · Minor
- Chance of severe wind over 30 yrs
- 19.0%
Air-quality risk 1/10 · Minimal
- Unhealthy air days now
- 0 days/yr
- Unhealthy air days in 30 yrs
- 0 days/yr
Risk factors via First Street. Map © Google.
Why this score? — see what drove the F grade
The composite is a weighted blend of 9 inputs, each scored 0–100. Each bar is that input's sub-score; the figure is the points it added to the 100-point composite (weight × sub-score).
- Appreciation +10.0/10.0
- ARV discount +7.5/15.0
- Livability +4.1/5.0
- Cash flow +3.8/30.0
- Schools +3.7/10.0
- Rent growth +2.5/5.0
- Condition / age +2.5/5.0
- 1% rule +0.2/10.0
- DSCR +0.0/10.0
$339,900
🖨 Deal sheet (PDF) 📄 Offer letter ✓ Due diligence
Listing remarks MLS
The Shelby welcomes you into a modern, open space, complete with a formal dining room and study. The kitchen overlooks an open-concept family room. The second floor features a spacious master bedroom with a large walk-in closet and master bath along with two additional bedrooms with ample walk-in closets of their own. Make it your own with The Shelby's flexible floor plan! Offerings vary by location, so please discuss your options with your community's agent. * Attached photos may include upgrades and non-standard features.
Key facts
- Formal dining room
- Master bath
- Large walk-in closet
Tags
Neighborhood map
What this means for you Summary
Snapshot
- This is a 3-bed/2.5-bath single-family listed at $340k.
Deal economics
- At list price, monthly cash flow is $-1k ($-14k/yr) — negative.
- To cash-flow at today's rent, offer at most $230k (32.4% below list).
- To meet the 1% rule (rent ≥ 1% of price), the offer needs to be $204k (39.9% below list).
- Recommended offer: $204k (39.9% below list) — sets the bar for 1% rule.
- Cap rate 2.8% vs local median 3.8% in Huntsville — below-typical yield; the buyer is paying a premium for something (appreciation thesis, condition, location) that the cap rate doesn't capture.
Location & tenants
- Location reads 82/100 on livability (#3 in AL, #1,082 nationally) — a professional / high-income tenant draw. Strengths: commute A+, cost of living A+, housing A+; Watch: crime F.
- Madison County (rural): math 27% / reading 56% proficiency, ranked #19 of 129 in AL (top 15%) — families likely to look elsewhere, expect single-tenant / working-renter base with shorter leases.
- Zoned schools: Madison Cross Roads Elementary School (math 14% / reading 48%, grade F, #360 of 627 statewide, top 58%, 1,035 students, 59% FRL); Sparkman Middle School (math 18% / reading 53%, grade F, #81 of 257 statewide, top 33%, 859 students, 60% FRL); Sparkman High School (math 28% / reading 37%, grade F, #58 of 305 statewide, top 19%, 1,738 students, 37% FRL) — zoned schools average 52% FRL vs 29% district-wide (23 pts higher); higher-poverty schools than district average — tighter screening recommended.
- Market conditions: 326 active listings in the ZIP; 2 comparable units currently listed for rent nearby; 4,709 units permitted in Madison County in 2024 (1,186 in 5+ unit buildings).
Forward outlook
- In year one you build about $42k of equity ($3k loan paydown + $39k appreciation (10.0% local appreciation)).
- Madison County population projected at +18% by 2050 — long-run rental-demand tailwind backs the buy-and-hold thesis.
- By year 2, paydown + projected appreciation supports a ~$68k cash-out refi (75% LTV) — recoverable capital for the next deal without selling this one.
Negotiation context
- It's been on market 464 days — a 12% lower offer ($299k) is reasonable based on typical stale-listing flexibility.
Risks & watch-outs
- Climate carrying-cost: extreme-heat days projected 7→20/yr by 2055 (HVAC capex compounding) — expect insurance premiums to compound above CPI over the hold.
Questions for the listing agent
- What do current leases actually rent for vs. the listed asking? Can we see a recent rent roll and the last 12 months of T-12 income?
- It's been on market 464 days. Have you received any prior offers? Is the seller open to a 40% concession, seller financing, or rate buy-down credit?
- What does the HOA fee cover, when was the last increase, and are there any pending special assessments or reserve-fund shortfalls?
- Why hasn't it sold? Are there any deal-killer items the seller is aware of (foundation, flood, title, zoning, code violations)?
- Is there a deadline driving the sale (1031 exchange, divorce, estate, relocation)? That informs how much negotiation room exists.
- Crime grade is F in this area — have there been break-ins, vandalism, or insurance claims at this property in the last 3 years? What carrier currently insures it and at what premium?
- The area grade is low — what's the realistic commute time and amenity access for the typical tenant pool here? Any planned neighborhood developments (good or bad) we should know about?
- What's the average days-on-market for RENTAL listings here right now (not sales)? A rising rental-DOM trend means longer vacancies and softer asking-rent achievability than the comps imply.
- What's the recent tenant-quality profile in this submarket — average credit score on applications, eviction rate, late-payment / NSF rate, and stable-employment percentage? A property-management company in the area should have these aggregated.
- How much new for-sale + rental construction is in the pipeline within 1–3 miles? Heavy new supply typically softens prices + rents 12–24 months out; constrained supply supports both.
Investment metrics
- 1% rule
- 0.52% ✗
- Cap rate
- 2.83%
- Cash-on-cash
- -12.36%
- DSCR
- 0.45
- GRM
- 16.1
CMA / ARV
- ARV (median comp)
- $394,565
- List price
- $339,900
- Delta
- -13.85%
- Verdict
- UNDERPRICED
- Comps
- 20 within 1.0 mi
Show comp detail 12 sales within ~0.75 mi
| Address | Dist | Beds/Ba | Sqft | Sold | Price | $/sf | Match |
|---|---|---|---|---|---|---|---|
| 139 Morning Dew Rd | 0.14mi | 4/2.5 (+1) | 2,548 (+4%) | 6mo | $305,000 | $120 | 77 |
| 124 Barn Trail Way | 0.15mi | 4/2.0 (+1) | 2,422 (-1%) | 10mo | $278,000 | $115 | 75 |
| 183 Beaver Brook Pl | 0.25mi | 4/2.5 (+1) | 2,572 (+5%) | 8mo | $359,000 | $140 | 69 |
| 223 Bluebonnet St | 0.43mi | 4/3.0 (+1) | 2,634 (+7%) | 5mo | $431,261 | $164 | 56 |
| 112 Cotita Dr | 0.34mi | 4/3.0 (+1) | 2,136 (-13%) | 1mo | $370,006 | $173 | 55 |
| 140 Ivy Vine Dr | 0.22mi | 4/3.0 (+1) | 2,136 (-13%) | 8mo | $320,000 | $150 | 54 |
| 143 Ivy Vine Dr | 0.23mi | 4/2.5 (+1) | 2,769 (+13%) | 11mo | $389,000 | $140 | 54 |
| 109 Magnolia Hill Ave | 0.43mi | 4/2.0 (+1) | 2,191 (-11%) | 2mo | $375,479 | $171 | 53 |
| 194 Beaver Brook Pl | 0.27mi | 4/2.5 (+1) | 2,769 (+13%) | 12mo | $369,900 | $134 | 51 |
| 147 Ivy Vine Dr | 0.26mi | 4/3.0 (+1) | 2,136 (-13%) | 12mo | $345,000 | $162 | 50 |
| 125 Ivy Vine Dr | 0.12mi | 4/3.5 (+1) | 2,769 (+13%) | 18mo | $379,900 | $137 | 49 |
| 137 Ivy Vine Dr | 0.20mi | 4/3.5 (+1) | 2,769 (+13%) | 18mo | $374,900 | $135 | 45 |
Match score weights: distance 35% · size 25% · config 20% · recency 20%. Top-matched comps best support the ARV.
Projected returns pro-forma
10.0% appreciation · 3.0% rent growth · sell at horizon
- IRR
- 15.7%
- Equity multiple
- 2.29×
- Total profit
- $142,476
- Equity at exit
- $355,455
- IRR
- 15.2%
- Equity multiple
- 5.31×
- Total profit
- $476,644
- Equity at exit
- $766,552
Cash invested: $110,478 (down + closing). Projections, not guarantees.
Landlord ↔ Tenant lean methodology
- Overall (STATE)
- 90 Strongly Landlord-Friendly
- State Alabama
- 90 Strongly Landlord-Friendly · R+15
- County
- — inherits STATE
- City
- — inherits STATE
ZIP-level market 35773
- Home prices YoY
- 28.8%
- Active inventory
- 326
- Price-to-rent
- 13.9×
Monthly cashflow live
- Estimated rent
- $2,043 medium interval (Pro) →
- Mortgage (P&I)
- −$2,069
- Tax est. 1.5%
- −$493 /mo · $5,918/yr
- Insurance
- −$164
- HOA
- −$25
- Vacancy / Maint / Mgmt
- −$429
- Net cashflow
- $-1,138
Break-even live
Sensitivity live
| Price | -10% $-865 | -5% $-1,001 | +0% $-1,138 | +5% $-1,274 | +10% $-1,410 |
|---|---|---|---|---|---|
| Rent | -10% $-1,299 | -5% $-1,218 | +0% $-1,138 | +5% $-1,057 | +10% $-976 |
| Rate | -1.0pp $-939 | -0.5pp $-1,037 | base $-1,138 | +0.5pp $-1,240 | +1.0pp $-1,344 |
UW: 25.0% down · 7.5% · 30yr · 1.5% tax · 5.0% vac · 8.0% maint · 8.0% mgmt
Financing live
Cash to close
- Down payment
- $98,641
- Closing costs
- $11,837
- Reserves months
- —
- Total cash needed
- —
Loan-product check · same deal, 3 products live
Conventional
25% down · 7.5% · 30yr
- Down + closing
- —
- Monthly P&I
- —
- Monthly cashflow
- —
- DSCR
- —
- Eligible?
- —
Personal DTI + credit; lowest rate.
DSCR
20% down · 8.5% · 30yr
- Down + closing
- —
- Monthly P&I
- —
- Monthly cashflow
- —
- DSCR
- —
- Eligible?
- —
No personal income docs; deal must DSCR.
Hard money
10% down · 12.0% · 12mo
- Down + closing
- —
- Monthly P&I
- —
- Monthly cashflow
- —
- DSCR
- —
- Eligible?
- —
Short-term bridge; refi at stabilization.
Rent comps 2 comps
| Address | Beds | Baths | Sqft | Rent | $/sqft | DOM | Units | Dist |
|---|---|---|---|---|---|---|---|---|
| 119 Beaver Brook Pl Toney, AL | 4.0 | 2.5 | 2448 | $2,000 | $0.82 | 45d | 1 | 0.21mi |
| 147 Ivy Vine Dr Toney, AL | 4.0 | 3.0 | 2136 | $2,100 | $0.98 | 25d | 1 | 0.24mi |
HOA detail
- Monthly dues
- $25 · $300/yr
Listing history 16 events
-
2026-06-22days on market $339,900 Active 464 DOM
-
2026-06-18days on market $339,900 Active 461 DOM
-
2026-06-17days on market $339,900 Active 460 DOM
-
2026-06-16days on market $339,900 Active 459 DOM
-
2026-06-15days on market $339,900 Active 458 DOM
-
2026-06-14days on market $339,900 Active 456 DOM
-
2026-06-10days on market $339,900 Active 453 DOM
-
2026-06-09days on market $339,900 Active 452 DOM
-
2026-06-08days on market $339,900 Active 451 DOM
-
2026-06-07days on market $339,900 Active 450 DOM
-
2026-06-02days on market $339,900 Active 445 DOM
-
2026-06-01days on market $339,900 Active 444 DOM
-
2026-05-31days on market $339,900 Active 443 DOM
-
2026-05-30days on market $339,900 Active 442 DOM
-
2025-03-21price $339,900 529-char remark
Show marketing remark (529 chars)
The Shelby welcomes you into a modern, open space, complete with a formal dining room and study. The kitchen overlooks an open-concept family room. The second floor features a spacious master bedroom with a large walk-in closet and master bath along with two additional bedrooms with ample walk-in closets of their own. Make it your own with The Shelby's flexible floor plan! Offerings vary by location, so please discuss your options with your community's agent. * Attached photos may include upgrades and non-standard features.
-
2025-03-14$344,900 Active 529-char remark
Show marketing remark (529 chars)
The Shelby welcomes you into a modern, open space, complete with a formal dining room and study. The kitchen overlooks an open-concept family room. The second floor features a spacious master bedroom with a large walk-in closet and master bath along with two additional bedrooms with ample walk-in closets of their own. Make it your own with The Shelby's flexible floor plan! Offerings vary by location, so please discuss your options with your community's agent. * Attached photos may include upgrades and non-standard features.
ⓘ Source: listings_history table (triggers on properties + properties_extension) + one-shot
backfill from property_details.listing_events for pre-trigger history.
Climate risk First Street
- Flood 1/10 Low FEMA zone X (unshaded) · 0% chance over 30 yrs
- Wildfire 3/10 Moderate
- Heat 5/10 Major 7 d/yr ≥105°F today · 20 d/yr by 30 yrs out
- Wind 4/10 Moderate 19% chance of damaging wind over 30 yrs
- Air quality 1/10 Low 0 unhealthy d/yr today · 0 by 30 yrs out
Nearby sold comps map
Loading sold comps map…
Walkable amenities ~0.75 mi
Loading nearby amenities…
Taxation est. · year 1
- Rental income
- $24,517
- − Mortgage interest
- −$22,102
- − Property taxes
- −$5,918
- − Insurance
- −$1,973
- − Repairs & maintenance
- −$1,961
- − Management
- −$1,961
- − HOA
- −$300
- − Depreciation
- −$11,478
- Taxable loss
- −$21,177
- Est. tax savings @ 24.0%
- +$5,082
- After-tax cash flow
- $-8,570/yr
For passive investors: Depreciation is non-cash, so a rental often shows a tax loss while cash-flowing — sheltering income. Rental losses are passive: they offset passive income freely, and up to $25,000/yr can offset ordinary (W-2) income if you actively participate and your MAGI is under $100k (phasing out to $0 by $150k); unused losses carry forward. On sale, claimed depreciation is recaptured at up to 25%, and gains may owe capital-gains tax (a 1031 exchange can defer both). Figures are a year-1 estimate at your 24.0% rate — not tax advice; consult a CPA.
Schools (NCES district)
- District
- Madison County
- NCES district ID
- 0102220
- Math proficiency
- 27% ▼ -32.00%
- Reading proficiency
- 56% ▼ -1.00%
- Median HH income
- $66,058
- Composite
- 37.15/100
- National rank
- #4483
- State rank
- #19 of 129 in AL
Livability — Huntsville
- Score
- 82/100
- State rank
- #3
- US rank
- #1082
Category grades
Schools grade is shown separately in the Schools card above.
Census & demographics
- City population
- 220,435
- Population (ZIP)
- 13,977
Population outlook (Madison County) Hauer SSP2
- Today (2025)
- 392,086 people
- By 2030
- 409,788 · +4.5%
- By 2040
- 440,557 · +12.4%
- By 2050
- 460,990 · +17.6%
- By 2075
- 502,872 · +28.3%
- By 2100
- 513,623 · +31.0%
Race, ethnicity, and origin ACS 2023
- Neighborhood character
- Predominantly White (72%)
- Race & ethnicity
- White 72% Black 17% Hispanic / Latino 7% Two or more races 3% Asian 2%
- Hispanic origin (detail)
- Mexican 5%
- Common ancestry
- Italian 3% Slovak 1% Serbian 1%
- Foreign-born
- 2% · Canada
- Languages at home
- 95% English-only · Spanish 4%
Political lean MEDSL · Madison
- 2024 margin
- Lean R (+9.0) · D 44.7% · R 53.7% · Other 1.6%
- 2008→2024 swing
- +6.0pp toward D · 2008: -14.9pp · 2024: -9.0pp
- All cycles
- 2024: R+9.0 2020: R+8.0 2016: R+16.8 2012: R+18.7 2008: R+14.9
Not yet ingested
- Civics
- —
Market trends
- HPI YoY
- ▲ 149.14%
- Current HPI
- 666.8602
- Rent YoY
- —
- Metro
- —
- State GDP YoY
- ▲ 2.94%
- F500 in state
- 4
Industry mix (Fortune 500 HQ in AL)
| Industry | F500 HQs | Revenue |
|---|---|---|
| Financial Services | 1 | $8B |
|
||
| Healthcare | 1 | $5B |
|
||
Price history
-1.4% since first listed2 events — show timeline
- 2025-03-21 Price Changed $339,900 Zillow
- 2025-03-14 Listed $344,900 Zillow
Cash-flow waterfall
monthlySold comps — $/sqft
last 12 mo · ≤1 miLoading sold comps…