 Duplex
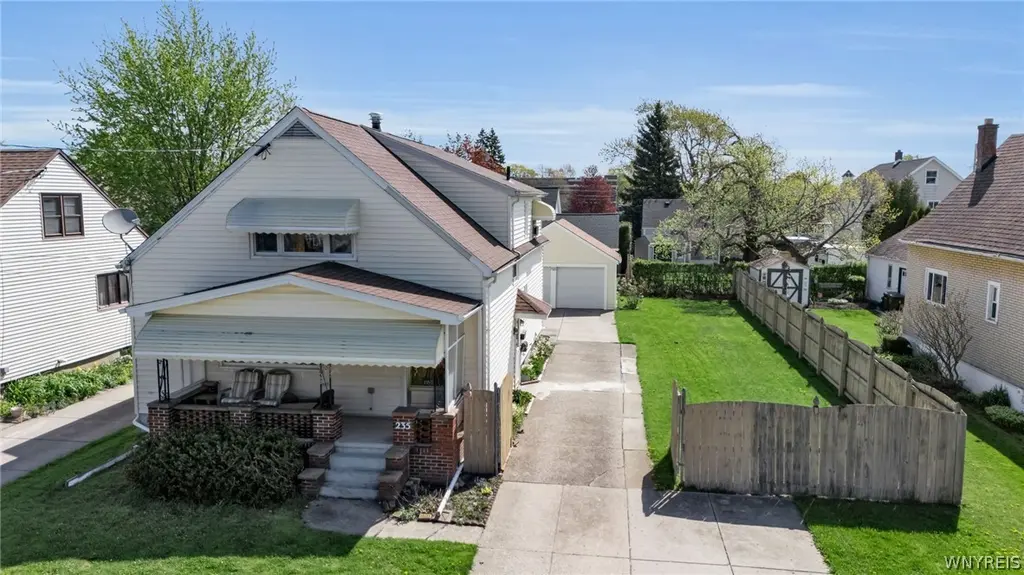
235 Atlantic Ave · Sloan, NY
Flood risk 4/10 · Minor
- FEMA flood zone
- X (unshaded)
- Chance of flooding over 30 yrs
- 0.22%
- Est. flood insurance / yr
- $473 – $860
Fire risk 1/10 · Minimal
- Est. fire insurance / yr
- $691 – $1,283
Heat risk 3/10 · Minor
- Hot days now (above 92°F)
- 7 days/yr
- Hot days in 30 yrs
- 15 days/yr
Wind risk 1/10 · Minimal
- Chance of severe wind over 30 yrs
- —
Air-quality risk 3/10 · Minor
- Unhealthy air days now
- 2 days/yr
- Unhealthy air days in 30 yrs
- 3 days/yr
Risk factors via First Street. Map © Google.
Why this score? — see what drove the C- grade
The composite is a weighted blend of 9 inputs, each scored 0–100. Each bar is that input's sub-score; the figure is the points it added to the 100-point composite (weight × sub-score).
- Cash flow +18.5/30.0
- Appreciation +10.0/10.0
- 1% rule +5.9/10.0
- DSCR +5.8/10.0
- Livability +3.8/5.0
- Schools +3.0/10.0
- Rent growth +2.5/5.0
- Condition / age +2.5/5.0
- ARV discount +0.0/15.0
$250,000
🖨 Deal sheet (PDF) 📄 Offer letter ✓ Due diligence
Multi-family units
County records classify this as Multi-Family (2-4 Unit). Listing-text estimate: 2 units. confirmed
Listing remarks
Hard-to-find owner-occupied two-family home in the village of Sloan, on a double lot with a two-car garage. Spacious lower unit with a foyer, a large living room, and an eat-in kitchen! Lower has beautiful hardwood floors with access to a covered porch. Upper unit features an original kitchen, living room, and two large bedrooms. Updates include vinyl siding 1999, forced air furnaces, 2024 Hotwater tank, electrical 2025, and mostly new Windows 2010, Bouus this basement poured walls and sump pump!
Key facts
- Covered porch
- Double lot
- Two family home
Tags
Property features AI
Finance
- Financial info: Water paid by owner / included in rent; Operating expenses include water
Exterior
- Parking: Attached garage with 2 spaces; Concrete parking; Garage door opener; Two or more parking spaces
- Utilities: Electricity connected (circuit breakers); Public water connected; Sewer connected
- Home design: Two-story multi-family building; Resale property
- Construction: Vinyl siding; Copper plumbing; Poured foundation; Existing structure
- Exterior features: Fully fenced yard; Covered porch
Interior
- Kitchen: Eat-in kitchens (in both units)
- Bedrooms: Two 2-bed units (each unit has 2 bedrooms)
- Flooring: Hardwood; Vinyl; Varies
- Bathrooms: Each unit has 1 full bathroom (2 full bathrooms total)
- Heating & cooling: Gas forced-air heating
- Interior features: Ceiling fan(s)
- Laundry & utility: Washer hookup; Gas water heater
Neighborhood map
What this means for you Summary
Snapshot
- This is a 2 × 2-bed/1.0-bath units multifamily listed at $250k.
Deal economics
- At list price, monthly cash flow is $237 ($3k/yr) — positive. Per door: $119/mo.
- The deal already cash-flows at list — no discount required.
- Meets the 1% rule at list price ($3k rent vs $250k).
- Cap rate 7.4% vs local median 5.7% in Sloan — top-decile yield for the area; either an underpriced asset or a hidden risk that comps aren't pricing in. Stress-test before assuming the spread holds.
Location & tenants
- Location reads 76/100 on livability (#215 in NY, #3,348 nationally) — a middle-class / working-renter tenant base. Strengths: cost of living A+, housing A+, health & safety A+; Watch: employment C-, schools D-, amenities F.
- Cheektowaga-Sloan Union Free School District (urban): math 33% / reading 38% proficiency, ranked #555 of 590 in NY (top 94%) — families likely to look elsewhere, expect single-tenant / working-renter base with shorter leases.
- Market conditions: 83 active listings in the ZIP; 5 comparable units currently listed for rent nearby; rentals leasing fast (median 11d on market — plan ~1-2 weeks tenant-placement turnaround); 1,244 units permitted in Erie County in 2024 (563 in 5+ unit buildings).
Forward outlook
- In year one you build about $27k of equity ($2k loan paydown + $25k appreciation (10.0% local appreciation)).
- At projected returns (10.0% appreciation + 3.0% rent growth), your $70k cash investment doubles in ~3 years — after that, you're playing with house money.
- By year 2, paydown + projected appreciation supports a ~$43k cash-out refi (75% LTV) — recoverable capital for the next deal without selling this one.
Negotiation context
- Only 4 days on market — expect competitive offers; lowballing is unlikely to land.
- Current owner paid $69k; list at $250k implies a 262% gain — meaningful room to come down on a strong offer.
Risks & watch-outs
- Watch-outs: built in 1952 — expect roof / HVAC / electrical / plumbing capex.
Questions for the listing agent
- Can we see the unit-by-unit rent roll, current vacancy, and any below-market leases? What's the average tenancy length?
- What capital expenditures (roof, boiler, parking lot, exteriors) have been made in the last 5 years, and what's planned in the next 2?
- Built in 1952 — when were the roof, HVAC, electrical panel, plumbing, and water heater last replaced?
- Is there a deadline driving the sale (1031 exchange, divorce, estate, relocation)? That informs how much negotiation room exists.
- Schools are D-rated, which usually means shorter tenancies and higher turnover. Who's the typical renter profile here, and what's been the actual vacancy rate?
- What's the average days-on-market for RENTAL listings here right now (not sales)? A rising rental-DOM trend means longer vacancies and softer asking-rent achievability than the comps imply.
- What's the recent tenant-quality profile in this submarket — average credit score on applications, eviction rate, late-payment / NSF rate, and stable-employment percentage? A property-management company in the area should have these aggregated.
- How much new apartment / multifamily construction is in the pipeline within 1–3 miles? Heavy new supply (>2% of stock underway) typically softens rents 12–24 months out; light construction supports rent growth.
Investment metrics
- 1% rule
- 1.09% ✓
- Cap rate
- 7.43%
- Cash-on-cash
- 4.07%
- DSCR
- 1.18
- GRM
- 7.7
CMA / ARV
- ARV (on-the-fly)
- $207,480
- Comps found
- 12
Show comp detail 12 sales within ~0.75 mi
| Address | Dist | Beds/Ba | Sqft | Sold | Price | $/sf | Match |
|---|---|---|---|---|---|---|---|
| 213 Boll St | 0.38mi | 5/2.0 (+1) | 2,244 (+3%) | 5mo | $275,000 | $123 | 68 |
| 8 Wagner Ave | 0.44mi | 5/3.0 (+1) | 2,149 (-2%) | 2mo | $205,000 | $95 | 66 |
| 259 Halstead Ave | 0.28mi | 5/3.0 (+1) | 2,344 (+7%) | 5mo | $266,000 | $113 | 61 |
| 236 Crocker St | 0.53mi | 5/3.0 (+1) | 2,240 (+3%) | 2mo | $212,500 | $95 | 60 |
| 427 Benzinger St | 0.44mi | 4/2.0 | 2,018 (-8%) | 14mo | $172,000 | $85 | 55 |
| 238 Schiller St | 0.30mi | 4/2.0 | 1,894 (-13%) | 12mo | $145,000 | $77 | 54 |
| 366 Davey St | 0.32mi | 4/2.5 | 1,959 (-10%) | 15mo | $110,000 | $56 | 53 |
| 187 Goethe St | 0.31mi | 4/2.0 | 1,890 (-14%) | 12mo | $77,000 | $41 | 53 |
| 350 Davey St | 0.33mi | 4/2.0 | 1,904 (-13%) | 14mo | $265,500 | $139 | 52 |
| 188 Crocker St | 0.49mi | 5/2.0 (+1) | 1,895 (-13%) | 4mo | $227,000 | $120 | 47 |
| 33 Schiller St | 0.63mi | 4/2.0 | 1,922 (-12%) | 5mo | $60,000 | $31 | 47 |
| 108 Moreland St | 0.69mi | 4/2.0 | 1,856 (-15%) | 12mo | $205,000 | $110 | 33 |
Match score weights: distance 35% · size 25% · config 20% · recency 20%. Top-matched comps best support the ARV.
Projected returns pro-forma
10.0% appreciation · 3.0% rent growth · sell at horizon
- IRR
- 27.2%
- Equity multiple
- 3.16×
- Total profit
- $151,433
- Equity at exit
- $225,220
- IRR
- 23.8%
- Equity multiple
- 7.21×
- Total profit
- $434,361
- Equity at exit
- $485,695
Cash invested: $70,000 (down + closing). Projections, not guarantees.
Landlord ↔ Tenant lean methodology
- Overall (STATE)
- 15 Strongly Tenant-Friendly
- State New York
- 15 Strongly Tenant-Friendly · D+10
- County
- — inherits STATE
- City
- — inherits STATE
ZIP-level market 14212
- Home prices YoY
- 20.4%
- Active inventory
- 83
- Price-to-rent
- 15.3×
Monthly cashflow live
- Estimated rent
- $2,721 high interval (Pro) →
- Mortgage (P&I)
- −$1,311
- Tax from tax record
- −$497 /mo · $5,964/yr
- Insurance
- −$104
- HOA
- −$0
- Vacancy / Maint / Mgmt
- −$571
- Net cashflow
- $237
Break-even live
Sensitivity live
| Price | -10% $379 | -5% $308 | +0% $237 | +5% $167 | +10% $96 |
|---|---|---|---|---|---|
| Rent | -10% $22 | -5% $130 | +0% $237 | +5% $345 | +10% $452 |
| Rate | -1.0pp $363 | -0.5pp $301 | base $237 | +0.5pp $173 | +1.0pp $107 |
2-unit breakdown (identical units grouped — click to expand)
| Units | Beds | Baths | Est. rent |
|---|---|---|---|
| 2× units | 2 | 1 | $2,722 |
| #1 | 2 | 1 | $1,361 |
| #2 | 2 | 1 | $1,361 |
| Total (2 units) | $2,721 | ||
UW: 25.0% down · 7.5% · 30yr · 1.5% tax · 5.0% vac · 8.0% maint · 8.0% mgmt
Financing live
Cash to close
- Down payment
- $62,500
- Closing costs
- $7,500
- Reserves months
- —
- Total cash needed
- —
Loan-product check · same deal, 3 products live
Conventional
25% down · 7.5% · 30yr
- Down + closing
- —
- Monthly P&I
- —
- Monthly cashflow
- —
- DSCR
- —
- Eligible?
- —
Personal DTI + credit; lowest rate.
DSCR
20% down · 8.5% · 30yr
- Down + closing
- —
- Monthly P&I
- —
- Monthly cashflow
- —
- DSCR
- —
- Eligible?
- —
No personal income docs; deal must DSCR.
Hard money
10% down · 12.0% · 12mo
- Down + closing
- —
- Monthly P&I
- —
- Monthly cashflow
- —
- DSCR
- —
- Eligible?
- —
Short-term bridge; refi at stabilization.
Rent comps 5 comps
| Address | Beds | Baths | Sqft | Rent | $/sqft | DOM | Units | Dist |
|---|---|---|---|---|---|---|---|---|
| 14 Rutland Ave Buffalo, NY | 4.0 | 1.0 | 1430 | $2,200 | $1.54 | 11d | 1 | 0.58mi |
| 979 Walden Ave Buffalo, NY | 4.0 | 3.0 | 1793 | $2,000 | $1.12 | 2d | 1 | 0.81mi |
| 1202 Walden Ave Unit 3 Buffalo, NY | 3.0 | 1.0 | 1500 | $1,400 | $0.93 | 17d | 1 | 0.91mi |
| 96 Academy Rd Buffalo, NY | 3.0 | 1.0 | 2247 | $1,400 | $0.62 | 24d | 1 | 1.05mi |
| 65 Domedion Ave Buffalo, NY | 3.0 | 1.0 | 1632 | $1,500 | $0.92 | 2d | 1 | 1.43mi |
Listing history 3 events
-
2026-05-12status Pending
-
2026-05-08$250,000 Active
-
1999-06-17soldstatus $69,000
ⓘ Source: listings_history table (triggers on properties + properties_extension) + one-shot
backfill from property_details.listing_events for pre-trigger history.
Tax reassessment forecast NY · Partial reset (capped growth)
- Current annual tax
- $5,964 · $497/mo
- Projected year-2 tax
- $5,964 · $497/mo
- Expected delta
- $0/yr ($0/mo · 0.0%)
ⓘ Screening estimate from a state-policy table — verify with the county assessor before closing.
Climate risk First Street
- Flood 4/10 Moderate FEMA zone X (unshaded) · 22% chance over 30 yrs
- Wildfire 1/10 Low
- Heat 3/10 Moderate 7 d/yr ≥92°F today · 15 d/yr by 30 yrs out
- Wind 1/10 Low
- Air quality 3/10 Moderate 2 unhealthy d/yr today · 3 by 30 yrs out
Nearby sold comps map
Loading sold comps map…
Walkable amenities ~0.75 mi
Loading nearby amenities…
Taxation est. · year 1
- Rental income
- $32,652
- − Mortgage interest
- −$14,004
- − Property taxes
- −$5,964
- − Insurance
- −$1,250
- − Repairs & maintenance
- −$2,612
- − Management
- −$2,612
- − Depreciation
- −$7,273
- Taxable loss
- −$1,062
- Est. tax savings @ 24.0%
- +$255
- After-tax cash flow
- $3,104/yr
For passive investors: Depreciation is non-cash, so a rental often shows a tax loss while cash-flowing — sheltering income. Rental losses are passive: they offset passive income freely, and up to $25,000/yr can offset ordinary (W-2) income if you actively participate and your MAGI is under $100k (phasing out to $0 by $150k); unused losses carry forward. On sale, claimed depreciation is recaptured at up to 25%, and gains may owe capital-gains tax (a 1031 exchange can defer both). Figures are a year-1 estimate at your 24.0% rate — not tax advice; consult a CPA.
Schools (NCES district)
- District
- Cheektowaga-Sloan Union Free School District
- NCES district ID
- 3627000
- Math proficiency
- 33% ▼ -16.00%
- Reading proficiency
- 38% ▼ -6.00%
- Median HH income
- $45,810
- Composite
- 30.35/100
- National rank
- #6263
- State rank
- #555 of 590 in NY
Livability — Sloan
- Score
- 76/100
- State rank
- #215
- US rank
- #3348
Category grades
Schools grade is shown separately in the Schools card above.
Census & demographics
- Census place
- Sloan, NY
- Population (ZIP)
- 13,603
Population outlook (Erie County) Hauer SSP2
- Today (2025)
- 933,037 people
- By 2030
- 935,181 · +0.2%
- By 2040
- 928,531 · -0.5%
- By 2050
- 905,725 · -2.9%
- By 2075
- 834,037 · -10.6%
- By 2100
- 708,033 · -24.1%
Race, ethnicity, and origin ACS 2023
- Neighborhood character
- Highly diverse neighborhood (Simpson 0.75)
- Race & ethnicity
- White 32% Black 27% Asian 25% Hispanic / Latino 9% Two or more races 8%
- Hispanic origin (detail)
- Puerto Rican 8%
- Common ancestry
- Romanian 12% Serbian 1% Lithuanian 1%
- Foreign-born
- 20% · Philippines, Canada, China
- Languages at home
- 68% English-only · Other Indo-European 18% Spanish 4% Other Asian/Pacific 2%
Political lean MEDSL · Erie
- 2024 margin
- Lean D (+9.7) · D 54.8% · R 45.2%
- 2008→2024 swing
- -7.9pp toward R · 2008: 17.5pp · 2024: 9.7pp
- All cycles
- 2024: D+9.7 2020: D+14.7 2016: D+4.8 2012: D+15.6 2008: D+17.5
Not yet ingested
- Civics
- —
Market trends
- HPI YoY
- ▲ 79.80%
- Current HPI
- 471.6399
- Rent YoY
- —
- Metro
- —
- State GDP YoY
- ▲ 2.60%
- F500 in state
- 92
Industry mix (Fortune 500 HQ in NY)
| Industry | F500 HQs | Revenue |
|---|---|---|
| Financial Services | 10 | $950B |
|
||
| Consumer Goods | 9 | $162B |
|
||
| Insurance | 4 | $225B |
|
||
| Telecommunications | 2 | $144B |
|
||
| Pharmaceuticals | 2 | $112B |
|
||
| Media / Entertainment | 2 | $69B |
|
||
Price history
+262.3% since first listed3 events — show timeline
- 2026-05-12 Pending — WNYREIS
- 2026-05-08 Listed $250,000 WNYREIS
- 1999-06-17 Sold (Public Records) $69,000 Public Records
Property tax history
+6.5%/yrLatest (2025): $5,964 · +0.9% YoY. Source: county tax records.
Cash-flow waterfall
monthlySold comps — $/sqft
last 12 mo · ≤1 miLoading sold comps…