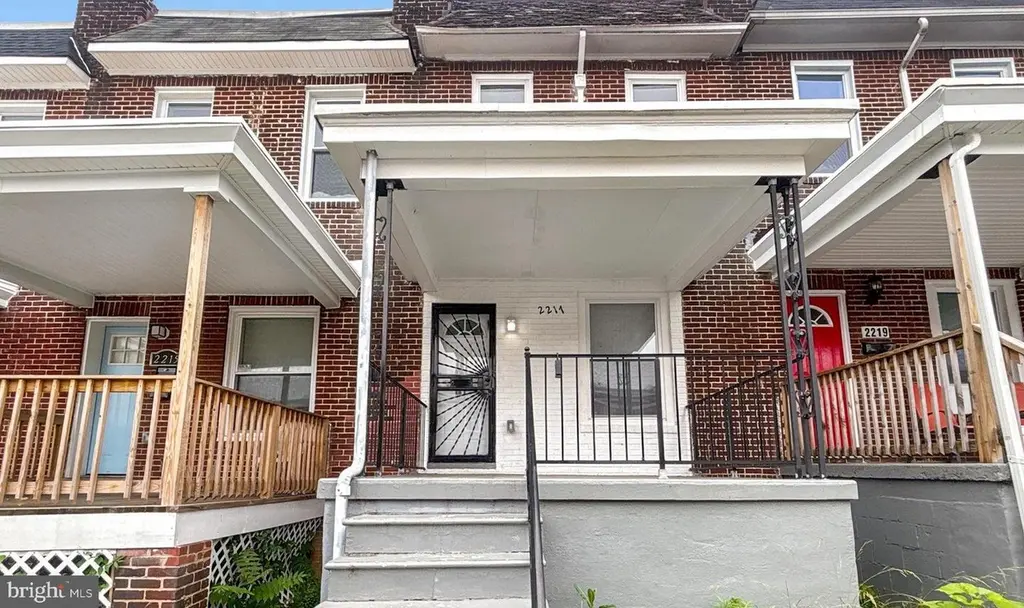
2217 Riggs Ave · Baltimore, MD
Flood risk 1/10 · Minimal
- FEMA flood zone
- X (unshaded)
- Chance of flooding over 30 yrs
- 0.0%
- Est. flood insurance / yr
- $473 – $860
Fire risk 1/10 · Minimal
- Est. fire insurance / yr
- $755 – $1,403
Heat risk 7/10 · Major
- Hot days now (above 103°F)
- 7 days/yr
- Hot days in 30 yrs
- 15 days/yr
Wind risk 6/10 · Moderate
- Chance of severe wind over 30 yrs
- 27.0%
Air-quality risk 3/10 · Minor
- Unhealthy air days now
- 3 days/yr
- Unhealthy air days in 30 yrs
- 4 days/yr
Risk factors via First Street. Map © Google.
Why this score? — see what drove the C- grade
The composite is a weighted blend of 9 inputs, each scored 0–100. Each bar is that input's sub-score; the figure is the points it added to the 100-point composite (weight × sub-score).
- Cash flow +20.3/30.0
- ARV discount +7.5/15.0
- DSCR +6.5/10.0
- 1% rule +4.6/10.0
- Rent growth +4.0/5.0
- Livability +3.8/5.0
- Condition / age +2.5/5.0
- Schools +1.0/10.0
- Appreciation +0.0/10.0
$155,000
🖨 Deal sheet 📄 Offer letter ✓ Due diligence
Listing remarks MLS
Welcome to 2217 Riggs Avenue, a beautifully updated brick townhome in the Bridgeview–Greenlawn neighborhood of Baltimore. This 2-bedroom, 1.5-bath home offers 980 square feet of above-grade living space, featuring modern finishes and classic charm. The main level boasts an open-concept living and dining area with updated flooring, recessed lighting, and a conveniently located half bathroom. The renovated kitchen is equipped with granite countertops, stainless steel appliances, and contemporary cabinetry—perfect for everyday living and entertaining. Upstairs, you'll find two spacious bedrooms and a full bathroom with tasteful updates. The lower level provides clean, unfinished space ideal for storage, laundry, or future expansion. Located near Franklintown Park, public transportation, and local amenities, this move-in-ready home is ideal for first-time buyers or investors looking for quality and value in a growing area. Schedule your showing today and make this Baltimore gem yours.
Key facts
- Renovated kitchen
- Granite countertops
- Built 1920
Tags
Neighborhood map
What this means for you Summary
Snapshot
- This is a 2-bed/1.0-bath townhouse listed at $155k.
Deal economics
- At list price, monthly cash flow is $199 ($2k/yr) — positive.
- The deal already cash-flows at list — no discount required.
- To meet the 1% rule (rent ≥ 1% of price), the offer needs to be $148k (4.3% below list).
- Recommended offer: $141k (9.0% below list) — sets the bar for market timing.
- Cap rate 7.8% vs local median 6.0% in Baltimore — top-decile yield for the area; either an underpriced asset or a hidden risk that comps aren't pricing in. Stress-test before assuming the spread holds.
Location & tenants
- Location reads 76/100 on livability (#90 in MD, #3,396 nationally) — a middle-class / working-renter tenant base. Strengths: amenities A+, commute A+, housing A+; Watch: schools D, crime F.
- Baltimore City Public Schools (urban): math 7% / reading 16% proficiency, ranked #24 of 24 in MD (top 100%) — low school quality limits family demand, transient renter base, plan for 1-2y turnover; 79% free/reduced lunch — lower-income household profile, screen leases tightly.
- Market conditions: Rents rising fast (+6.1%/yr); 252 active listings in the ZIP; 40 comparable units currently listed for rent nearby; rentals lingering (median 44d on market — plan ~5-8 weeks vacancy on turnover, expect pricing pressure); 52% of comp listings sitting > 30 days — soft ceiling on asking rent; lower-income renter base — watch delinquency; 1,273 units permitted in Baltimore city in 2024 (1,104 in 5+ unit buildings).
- This rent runs 42% of the median local income ($42k/yr) — at the standard rent-burdened threshold; future hikes will face affordability resistance.
Forward outlook
- Local home prices are declining (-3.0%/yr); year-one equity from $1k of loan paydown is wiped out by about $5k of value loss. Plan a longer hold.
- Baltimore County population projected to shrink 4% by 2050 — rents likely to lag national; underwrite the cash flow, not the appreciation.
Negotiation context
- It's been on market 94 days — a 9% lower offer ($141k) is reasonable based on typical stale-listing flexibility.
- 4 sale attempts since 2y ago with the ask held roughly flat each time — persistent listings suggest the price (not the market) is what's stuck; bring a comps-based counter.
- Current owner paid $55k; list at $155k implies a 182% gain — meaningful room to come down on a strong offer.
Risks & watch-outs
- Watch-outs: built in 1920 — expect roof / HVAC / electrical / plumbing capex.
- Climate carrying-cost: major wind risk, 27% chance of damaging wind over 30y; extreme-heat days projected 7→15/yr by 2055 (HVAC capex compounding) — expect insurance premiums to compound above CPI over the hold.
Questions for the listing agent
- It's been on market 94 days. Have you received any prior offers? Is the seller open to a 9% concession, seller financing, or rate buy-down credit?
- Built in 1920 — when were the roof, HVAC, electrical panel, plumbing, and water heater last replaced?
- Why hasn't it sold? Are there any deal-killer items the seller is aware of (foundation, flood, title, zoning, code violations)?
- Is there a deadline driving the sale (1031 exchange, divorce, estate, relocation)? That informs how much negotiation room exists.
- Schools are D-rated, which usually means shorter tenancies and higher turnover. Who's the typical renter profile here, and what's been the actual vacancy rate?
- Crime grade is F in this area — have there been break-ins, vandalism, or insurance claims at this property in the last 3 years? What carrier currently insures it and at what premium?
- What's the average days-on-market for RENTAL listings here right now (not sales)? A rising rental-DOM trend means longer vacancies and softer asking-rent achievability than the comps imply.
- What's the recent tenant-quality profile in this submarket — average credit score on applications, eviction rate, late-payment / NSF rate, and stable-employment percentage? A property-management company in the area should have these aggregated.
- How much new for-sale + rental construction is in the pipeline within 1–3 miles? Heavy new supply typically softens prices + rents 12–24 months out; constrained supply supports both.
Investment metrics
- 1% rule
- 0.96% ✗
- Cap rate
- 7.84%
- Cash-on-cash
- 5.51%
- DSCR
- 1.25
- GRM
- 8.7
CMA / ARV
- ARV (median comp)
- $102,322
- List price
- $155,000
- Delta
- 51.48%
- Verdict
- OVERPRICED
- Comps
- 20 within 1.0 mi
Show comp detail 12 sales within ~0.75 mi
| Address | Dist | Beds/Ba | Sqft | Sold | Price | $/sf | Match |
|---|---|---|---|---|---|---|---|
| 2507 Riggs Ave | 0.25mi | 2/1.0 | 896 (-9%) | 4mo | $45,100 | $50 | 71 |
| 910 N Dukeland St | 0.57mi | 2/1.0 | 960 (-2%) | 4mo | $31,000 | $32 | 66 |
| 2511 Riggs Ave | 0.26mi | 3/1.0 (+1) | 896 (-9%) | 7mo | $116,500 | $130 | 63 |
| 2534 W Franklin St | 0.55mi | 3/1.0 (+1) | 928 (-5%) | 5mo | $24,000 | $26 | 56 |
| 1541 N Pulaski St | 0.41mi | 3/1.0 (+1) | 1,100 (+12%) | 3mo | $115,000 | $105 | 53 |
| 1635 N Warwick Ave N | 0.51mi | 3/1.5 (+1) | 1,064 (+9%) | 5mo | $70,000 | $66 | 51 |
| 2863 W Lanvale St | 0.69mi | 2/1.0 | 864 (-12%) | 3mo | $56,000 | $65 | 46 |
| 1552 N Fulton Ave | 0.52mi | 3/1.0 (+1) | 1,113 (+14%) | 4mo | $125,000 | $112 | 45 |
| 1705 N Payson St | 0.54mi | 3/1.5 (+1) | 1,100 (+12%) | 5mo | $38,000 | $35 | 44 |
| 2727 Baker St | 0.61mi | 3/1.0 (+1) | 1,116 (+14%) | 3mo | $125,000 | $112 | 41 |
| 1214 N Woodyear St | 0.71mi | 3/2.0 (+1) | 1,080 (+10%) | 5mo | $68,500 | $63 | 36 |
| 1201 N Calhoun St | 0.69mi | 3/2.5 (+1) | 1,080 (+10%) | 5mo | $102,000 | $94 | 36 |
Match score weights: distance 35% · size 25% · config 20% · recency 20%. Top-matched comps best support the ARV.
Projected returns pro-forma
-3.0% appreciation · 6.1% rent growth · sell at horizon
- IRR
- -4.6%
- Equity multiple
- 0.82×
- Total profit
- $-7,688
- Equity at exit
- $23,111
- IRR
- 8.1%
- Equity multiple
- 1.70×
- Total profit
- $30,357
- Equity at exit
- $13,402
Cash invested: $43,400 (down + closing). Projections, not guarantees.
Landlord ↔ Tenant lean methodology
- Overall (CITY)
- 12 Strongly Tenant-Friendly
- State Maryland
- 27 Tenant-Leaning · D+14
- County
- — inherits STATE
- City Baltimore
- 12 Strongly Tenant-Friendly · D+58
ZIP-level market 21216
- Rents YoY
- 6.1%
- Active inventory
- 252
- Price-to-rent
- 8.7×
Monthly cashflow live
- Estimated rent
- $1,483 high interval (Pro) →
- Mortgage (P&I)
- −$813
- Tax from tax record
- −$95 /mo · $1,137/yr
- Insurance
- −$65
- HOA
- −$0
- Vacancy / Maint / Mgmt
- −$311
- Net cashflow
- $199
Break-even live
UW: 25.0% down · 7.5% · 30yr · 1.5% tax · 5.0% vac · 8.0% maint · 8.0% mgmt
Financing live
Cash to close
- Down payment
- $38,750
- Closing costs
- $4,650
- Reserves months
- —
- Total cash needed
- —
Loan-product check · same deal, 3 products live
Conventional
25% down · 7.5% · 30yr
- Down + closing
- —
- Monthly P&I
- —
- Monthly cashflow
- —
- DSCR
- —
- Eligible?
- —
Personal DTI + credit; lowest rate.
DSCR
20% down · 8.5% · 30yr
- Down + closing
- —
- Monthly P&I
- —
- Monthly cashflow
- —
- DSCR
- —
- Eligible?
- —
No personal income docs; deal must DSCR.
Hard money
10% down · 12.0% · 12mo
- Down + closing
- —
- Monthly P&I
- —
- Monthly cashflow
- —
- DSCR
- —
- Eligible?
- —
Short-term bridge; refi at stabilization.
Rent comps 40 comps
| Address | Beds | Baths | Sqft | Rent | $/sqft | DOM | Units | Dist |
|---|---|---|---|---|---|---|---|---|
| 2301 Riggs Ave Baltimore, MD | 3.0 | 2.0 | 1072 | $1,600 | $1.49 | 23d | 1 | 0.07mi |
| 1617 Moreland Ave Baltimore, MD | 2.0 | 1.0 | 900 | $1,450 | $1.61 | 23d | 1 | 0.43mi |
| 1722 N Monroe St Baltimore, MD | 3.0 | 1.5 | 1000 | $1,350 | $1.35 | 23d | 1 | 0.57mi |
| 1729 N Fulton Ave Baltimore, MD | 3.0 | 2.0 | 1081 | $1,795 | $1.66 | 43d | 1 | 0.64mi |
| 1930 N Payson St Baltimore, MD | 2.0 | 2.0 | 980 | $1,500 | $1.53 | 23d | 1 | 0.68mi |
| 1534 N Stricker St Baltimore, MD | 2.0 | 1.5 | 900 | $1,475 | $1.64 | 14d | 1 | 0.69mi |
| 1614 N Calhoun St Baltimore, MD | 2.0 | 1.0 | 950 | $1,300 | $1.37 | 43d | 1 | 0.69mi |
| 1645 N Calhoun St Apt 202 Baltimore, MD | 2.0 | 1.0 | 650 | $1,199 | $1.84 | 43d | 1 | 0.71mi |
| 1339 W Lafayette Ave #1 Baltimore, MD | 2.0 | 2.0 | 700 | $1,600 | $2.29 | 12d | 1 | 0.72mi |
| 2636 W North Ave Baltimore, MD | 2.0–3.0 | 1.0–2.0 | 975 | $1,300 | $1.33 | 4d | 1 | 0.73mi |
| 1744 W North Ave Unit 3R Baltimore, MD | 1.0 | 1.0 | 650 | $900 | $1.38 | 43d | 1 | 0.73mi |
| 1624 Westwood Ave Baltimore, MD | 3.0 | 2.0 | 1000 | $1,900 | $1.90 | 43d | 1 | 0.73mi |
| 1562 N Woodyear St Baltimore, MD | 2.0 | 1.5 | 788 | $1,325 | $1.68 | 23d | 1 | 0.74mi |
| 1346 N Carey St Baltimore, MD | 2.0 | 1.5 | 1100 | $1,500 | $1.36 | 43d | 1 | 0.78mi |
| 1315 Harlem Ave Unit B Baltimore, MD | 2.0 | 1.0 | 900 | $1,425 | $1.58 | 23d | 1 | 0.78mi |
| 1315 Harlem Ave Unit C Baltimore, MD | 2.0 | 1.0 | 900 | $1,425 | $1.58 | 43d | 1 | 0.78mi |
| 62 N Gorman Ave Baltimore, MD | 3.0 | 2.0 | 1100 | $2,500 | $2.27 | 17d | 1 | 0.82mi |
| 2614 Pennsylvania Ave Baltimore, MD | 1.0–3.0 | 1.0–2.0 | 982 | $876 | $0.89 | 4d | 4 | 0.85mi |
| 1042 Ellicott Dr Baltimore, MD | 2.0 | 1.0 | 900 | $1,450 | $1.61 | 43d | 1 | 0.86mi |
| 2636 Pennsylvania Ave Baltimore, MD | 1.0–2.0 | 1.0 | 846 | $956 | $1.13 | 23d | 4 | 0.87mi |
| 910 N Arlington Ave Unit 1 Baltimore, MD | 1.0 | 1.0 | 551 | $999 | $1.81 | 17d | 1 | 0.91mi |
| 1918 W Baltimore St Baltimore, MD | 2.0–3.0 | 1.0–2.0 | 857 | $1,375 | $1.60 | 43d | 1 | 0.92mi |
| 3003 W North Ave Baltimore, MD | 1.0–2.0 | 1.0 | 841 | $935 | $1.11 | 2d | 3 | 0.96mi |
| 1515 Retreat St Baltimore, MD | 3.0 | 2.0 | 1098 | $1,800 | $1.64 | 23d | 1 | 0.96mi |
| 3127 Baker St Baltimore, MD | 3.0 | 1.0 | 1000 | $1,300 | $1.30 | 43d | 1 | 0.97mi |
| 1507 Retreat St Unit 1 Baltimore, MD | 3.0 | 3.0 | 1098 | $2,500 | $2.28 | 43d | 1 | 0.98mi |
| 1719 Pennsylvania Ave Baltimore, MD | 1.0 | 1.0 | 540 | $1,200 | $2.22 | 17d | 1 | 0.99mi |
| 2516 Hollins St Baltimore, MD | 3.0 | 2.0 | 1100 | $1,700 | $1.55 | 43d | 1 | 1.00mi |
| 2028 Druid Hill Ave Unit 2 Baltimore, MD | 1.0 | 1.0 | 657 | $1,199 | $1.82 | 43d | 1 | 1.02mi |
| 2143 Druid Hill Ave Unit 2 Baltimore, MD | 2.0 | 1.0 | 915 | $1,400 | $1.53 | 43d | 1 | 1.03mi |
| 2826 Windsor Ave Unit A5 Baltimore, MD | 1.0 | 1.0 | 600 | $999 | $1.67 | 23d | 1 | 1.04mi |
| 2433 Druid Hill Ave Baltimore, MD | 2.0 | 2.5 | 1092 | $1,999 | $1.83 | 43d | 1 | 1.05mi |
| 1601 Frederick Ave Unit 3 Baltimore, MD | 2.0 | 1.0 | 1050 | $1,050 | $1.00 | 4d | 1 | 1.05mi |
| 2449 Druid Hill Ave Baltimore, MD | 2.0 | 1.0 | 1100 | $1,800 | $1.64 | 43d | 1 | 1.05mi |
| 28 N Norris St Baltimore, MD | 1.0 | 2.0 | 700 | $1,450 | $2.07 | 43d | 1 | 1.05mi |
| 2301 Whittier Ave Unit 1 Baltimore, MD | 2.0 | 1.0 | 1104 | $1,400 | $1.27 | 43d | 1 | 1.08mi |
| 2301 Whittier Ave Unit 3 Baltimore, MD | 2.0 | 2.0 | 1104 | $1,650 | $1.49 | 43d | 1 | 1.08mi |
| 2301 Whittier Ave Unit 2 Baltimore, MD | 2.0 | 2.0 | 1104 | $1,400 | $1.27 | 43d | 1 | 1.08mi |
| 1847 Druid Hill Ave Unit B Baltimore, MD | 1.0 | 1.0 | 600 | $1,250 | $2.08 | 43d | 1 | 1.09mi |
| 2037 McCulloh St Unit 3 Baltimore, MD | 2.0 | 2.0 | 937 | $1,650 | $1.76 | 17d | 1 | 1.09mi |
Listing history 26 events
-
2026-06-18days on market $155,000 Active 94 DOM
-
2026-06-17days on market $155,000 Active 93 DOM
-
2026-06-16days on market $155,000 Active 92 DOM
-
2026-06-15days on market $155,000 Active 91 DOM
-
2026-06-13days on market $155,000 Active 89 DOM
-
2026-06-09days on market $155,000 Active 85 DOM
-
2026-06-08days on market $155,000 Active 84 DOM
-
2026-06-07days on market $155,000 Active 83 DOM
-
2026-06-04days on market $155,000 Active 80 DOM
-
2026-06-03days on market $155,000 Active 79 DOM
-
2026-06-02days on market $155,000 Active 78 DOM
-
2026-06-01days on market $155,000 Active 77 DOM
-
2026-05-31days on market $155,000 Active 76 DOM
-
2026-03-16$155,000 Active 1007-char remark
Show marketing remark (1007 chars)
Welcome to 2217 Riggs Avenue, a beautifully updated brick townhome in the Bridgeview–Greenlawn neighborhood of Baltimore. This 2-bedroom, 1.5-bath home offers 980 square feet of above-grade living space, featuring modern finishes and classic charm. The main level boasts an open-concept living and dining area with updated flooring, recessed lighting, and a conveniently located half bathroom. The renovated kitchen is equipped with granite countertops, stainless steel appliances, and contemporary cabinetry—perfect for everyday living and entertaining. Upstairs, you'll find two spacious bedrooms and a full bathroom with tasteful updates. The lower level provides clean, unfinished space ideal for storage, laundry, or future expansion. Located near Franklintown Park, public transportation, and local amenities, this move-in-ready home is ideal for first-time buyers or investors looking for quality and value in a growing area. Schedule your showing today and make this Baltimore gem yours.
-
2026-01-30historical
-
2025-11-02status Active
-
2025-10-31historical
-
2025-10-27price $155,000
-
2025-09-10price $160,000
-
2025-07-16price $170,000
-
2025-06-23$180,000 Active
-
2024-04-02historical
-
2024-02-25price $199,990
-
2024-01-11$210,000 Active
-
2024-01-07historical
-
2023-08-15soldstatus $55,000
ⓘ Source: listings_history table (triggers on properties + properties_extension) + one-shot
backfill from property_details.listing_events for pre-trigger history.
Tax reassessment forecast MD · Partial reset (capped growth)
- Current annual tax
- $1,137 · $95/mo
- Projected year-2 tax
- $1,413 · $118/mo
- Expected delta
- +$276/yr (+$23/mo · 24.3%)
ⓘ Screening estimate from a state-policy table — verify with the county assessor before closing.
Climate risk First Street
- Flood 1/10 Low FEMA zone X (unshaded) · 0% chance over 30 yrs
- Wildfire 1/10 Low
- Heat 7/10 Severe 7 d/yr ≥103°F today · 15 d/yr by 30 yrs out
- Wind 6/10 Major 27% chance of damaging wind over 30 yrs
- Air quality 3/10 Moderate 3 unhealthy d/yr today · 4 by 30 yrs out
Nearby sold comps map
Loading sold comps map…
Walkable amenities ~0.75 mi
Loading nearby amenities…
Taxation est. · year 1
- Rental income
- $17,795
- − Mortgage interest
- −$8,682
- − Property taxes
- −$1,137
- − Insurance
- −$775
- − Repairs & maintenance
- −$1,424
- − Management
- −$1,424
- − Depreciation
- −$4,509
- Taxable loss
- −$155
- Est. tax savings @ 24.0%
- +$37
- After-tax cash flow
- $2,430/yr
For passive investors: Depreciation is non-cash, so a rental often shows a tax loss while cash-flowing — sheltering income. Rental losses are passive: they offset passive income freely, and up to $25,000/yr can offset ordinary (W-2) income if you actively participate and your MAGI is under $100k (phasing out to $0 by $150k); unused losses carry forward. On sale, claimed depreciation is recaptured at up to 25%, and gains may owe capital-gains tax (a 1031 exchange can defer both). Figures are a year-1 estimate at your 24.0% rate — not tax advice; consult a CPA.
Schools (NCES district)
- District
- Baltimore City Public Schools
- NCES district ID
- 2400090
- Math proficiency
- 7% ▼ -9.00%
- Reading proficiency
- 16% ▼ -5.00%
- Median HH income
- $42,108
- Composite
- 10.08/100
- National rank
- #9805
- State rank
- #24 of 24 in MD
Livability — Baltimore
- Score
- 76/100
- State rank
- #90
- US rank
- #3396
Category grades
Schools grade is shown separately in the Schools card above.
Census & demographics
- Census place
- Baltimore, MD
- County
- Baltimore City · 558,601 people
- City population
- 588,727
- Metro
- Baltimore-Columbia-Towson, MD
- Population (ZIP)
- 29,426
- Household income
- $42,031
- Rent vs Own
- Severe rent burden
- 2264.0
Population outlook (Baltimore County) Hauer SSP2
- Today (2025)
- 624,249 people
- By 2030
- 621,541 · -0.4%
- By 2040
- 609,756 · -2.3%
- By 2050
- 597,249 · -4.3%
- By 2075
- 552,236 · -11.5%
- By 2100
- 513,934 · -17.7%
Race, ethnicity, and origin ACS 2023
- Neighborhood character
- Predominantly Black (91%)
- Race & ethnicity
- Black 91% Hispanic / Latino 4% Two or more races 3% White 2%
- Foreign-born
- 3% · Canada
- Languages at home
- 96% English-only · Spanish 3% French/Haitian/Cajun 1%
Political lean MEDSL · Baltimore
- 2024 margin
- Solid D (+73.0) · D 85.2% · R 12.2% · Other 2.6%
- 2008→2024 swing
- -2.5pp toward R · 2008: 75.5pp · 2024: 73.0pp
- All cycles
- 2024: D+73.0 2020: D+76.6 2016: D+74.6 2012: D+76.4 2008: D+75.5
Not yet ingested
- Civics
- —
Market trends
- HPI YoY
- ▼ -107.42%
- Current HPI
- 164.3933
- Rent YoY
- ▲ 6.10%
- Metro
- Baltimore-Columbia-Towson, MD
- State GDP YoY
- ▲ 2.97%
- F500 in state
- 12
Industry mix (Fortune 500 HQ in MD)
| Industry | F500 HQs | Revenue |
|---|---|---|
| Aerospace / Defense | 1 | $71B |
|
||
| Utilities | 1 | $25B |
|
||
| Hotels | 1 | $24B |
|
||
| Consumer Goods | 1 | $7B |
|
||
| Real Estate | 1 | $6B |
|
||
| Chemicals | 1 | $2B |
|
||
Price history
+181.8% since first listed13 events — show timeline
- 2026-03-16 Listed $155,000 BRIGHT MLS
- 2026-01-30 Listing Removed — BRIGHT MLS
- 2025-11-02 Relisted — BRIGHT MLS
- 2025-10-31 Listing Removed — BRIGHT MLS
- 2025-10-27 Price Changed $155,000 BRIGHT MLS
- 2025-09-10 Price Changed $160,000 BRIGHT MLS
- 2025-07-16 Price Changed $170,000 BRIGHT MLS
- 2025-06-23 Listed $180,000 BRIGHT MLS
- 2024-04-02 Listing Removed — BRIGHT MLS
- 2024-02-25 Price Changed $199,990 BRIGHT MLS
- 2024-01-11 Listed $210,000 BRIGHT MLS
- 2024-01-07 Coming Soon — BRIGHT MLS
- 2023-08-15 Sold (Public Records) $55,000 Public Records
Property tax history
-0.5%/yrLatest (2025): $1,137 · +3.6% YoY. Source: county tax records.
Cash-flow waterfall
monthlySold comps — $/sqft
last 12 mo · ≤1 miLoading sold comps…