 🏗️ New Construction
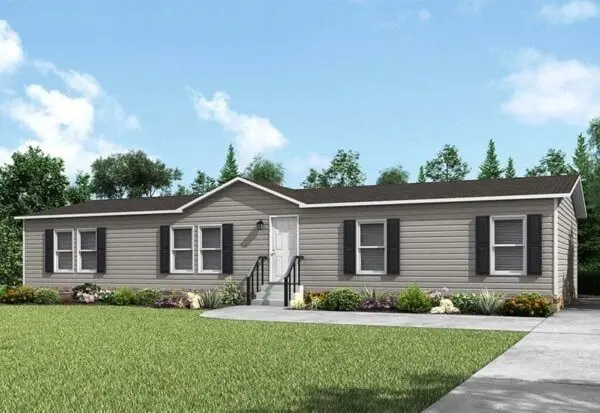
Sundowner Plan · Austin, TX
Flood risk 1/10 · Minimal
- FEMA flood zone
- X (unshaded)
- Chance of flooding over 30 yrs
- 0.0%
- Est. flood insurance / yr
- $507 – $1,088
Fire risk 5/10 · Moderate
- Est. fire insurance / yr
- $1,222 – $2,270
Heat risk 8/10 · Major
- Hot days now (above 108°F)
- 7 days/yr
- Hot days in 30 yrs
- 25 days/yr
Wind risk 8/10 · Major
- Chance of severe wind over 30 yrs
- 80.0%
Air-quality risk 2/10 · Minimal
- Unhealthy air days now
- 0 days/yr
- Unhealthy air days in 30 yrs
- 1 days/yr
Risk factors via First Street. Map © Google.
Why this score? — see what drove the C grade
The composite is a weighted blend of 9 inputs, each scored 0–100. Each bar is that input's sub-score; the figure is the points it added to the 100-point composite (weight × sub-score).
- Cash flow +24.4/30.0
- DSCR +7.9/10.0
- ARV discount +7.5/15.0
- 1% rule +6.3/10.0
- Livability +4.1/5.0
- Condition / age +4.0/5.0
- Rent growth +2.6/5.0
- Schools +2.0/10.0
- Appreciation +0.0/10.0
$116,995
🖨 Deal sheet 📄 Offer letter ✓ Due diligence
Listing remarks MLS
Discover the perfect blend of comfort and affordability with the Sundowner. This spacious home is packed with premium features designed for modern family living. You'll love the expansive dining area, large kitchen island, and a huge utility room perfect for laundry day. The massive living room is the ideal gathering spot for family and friends. With four bedrooms, there's plenty of space for everyone. Key features include: Air conditioning Breakfast bar Double sinks in bathroom Kitchen island Built with Clayton's innovative eBuilt system, the Sundowner incorporates over 25 eco-friendly features without compromising on comfort or style.
Key facts
- Large kitchen island
- Air conditioning
- Massive living room
Tags
Neighborhood map
What this means for you Summary
Snapshot
- This is a 4-bed/2.0-bath manufactured listed at $117k. Condition is rated good.
Deal economics
- At list price, monthly cash flow is $418 ($5k/yr) — positive.
- The deal already cash-flows at list — no discount required.
- Meets the 1% rule at list price ($2k rent vs $117k).
- Recommended offer: $110k (6.0% below list) — sets the bar for market timing.
- Cap rate 8.7% vs local median 1.8% in Austin — top-decile yield for the area; either an underpriced asset or a hidden risk that comps aren't pricing in. Stress-test before assuming the spread holds.
Location & tenants
- Location reads 82/100 on livability (#16 in TX, #1,208 nationally) — a professional / high-income tenant draw. Strengths: amenities A+, commute A+, employment A+; Watch: cost of living D, crime F.
- Manor ISD (rural): math 18% / reading 26% proficiency, ranked #729 of 826 in TX (top 88%) — low school quality limits family demand, transient renter base, plan for 1-2y turnover; 71% free/reduced lunch — lower-income household profile, screen leases tightly.
- Market conditions: Rents flat; 176 active listings in the ZIP; 29 comparable units currently listed for rent nearby; rentals at typical pace (median 24d on market — plan ~3-4 weeks tenant-placement turnaround); solid renter incomes; 17,121 units permitted in Travis County in 2024 (11,963 in 5+ unit buildings).
- This rent runs 36% of the median local income ($78k/yr) — at the standard rent-burdened threshold; future hikes will face affordability resistance.
Forward outlook
- Local home prices are declining (-3.0%/yr); year-one equity from $1k of loan paydown is wiped out by about $6k of value loss. Plan a longer hold.
- Travis County population projected at +60% by 2050 — long-run rental-demand tailwind backs the buy-and-hold thesis.
Negotiation context
- It's been on market 68 days — a 6% lower offer ($110k) is reasonable based on typical stale-listing flexibility.
Risks & watch-outs
- Watch-outs: property tax is 2.6% of price.
- Climate carrying-cost: severe wind risk, 80% chance of damaging wind over 30y; moderate wildfire risk; extreme-heat days projected 7→25/yr by 2055 (HVAC capex compounding) — expect insurance premiums to compound above CPI over the hold.
Questions for the listing agent
- It's been on market 68 days. Have you received any prior offers? Is the seller open to a 6% concession, seller financing, or rate buy-down credit?
- Property tax is high relative to price — has the assessment been appealed recently, and will the sale trigger a re-assessment?
- Why hasn't it sold? Are there any deal-killer items the seller is aware of (foundation, flood, title, zoning, code violations)?
- Is there a deadline driving the sale (1031 exchange, divorce, estate, relocation)? That informs how much negotiation room exists.
- Crime grade is F in this area — have there been break-ins, vandalism, or insurance claims at this property in the last 3 years? What carrier currently insures it and at what premium?
- What's the average days-on-market for RENTAL listings here right now (not sales)? A rising rental-DOM trend means longer vacancies and softer asking-rent achievability than the comps imply.
- What's the recent tenant-quality profile in this submarket — average credit score on applications, eviction rate, late-payment / NSF rate, and stable-employment percentage? A property-management company in the area should have these aggregated.
- How much new for-sale + rental construction is in the pipeline within 1–3 miles? Heavy new supply typically softens prices + rents 12–24 months out; constrained supply supports both.
Investment metrics
- 1% rule
- 1.13% ✓
- Cap rate
- 8.73%
- Cash-on-cash
- 8.72%
- DSCR
- 1.39
- GRM
- 7.4
CMA / ARV
- ARV (median comp)
- $205,435
- List price
- $116,995
- Delta
- -43.05%
- Verdict
- UNDERPRICED
- Comps
- 2 within 2.0 mi
Projected returns pro-forma
-3.0% appreciation · 0.26% rent growth · sell at horizon
- IRR
- -6.2%
- Equity multiple
- 0.78×
- Total profit
- $-12,885
- Equity at exit
- $30,631
- IRR
- -0.3%
- Equity multiple
- 0.98×
- Total profit
- $-1,058
- Equity at exit
- $17,762
Cash invested: $57,522 (down + closing). Projections, not guarantees.
Landlord ↔ Tenant lean methodology
- Overall (STATE)
- 87 Strongly Landlord-Friendly
- State Texas
- 87 Strongly Landlord-Friendly · R+5
- County
- — inherits STATE
- City
- — inherits STATE
ZIP-level market 78724
- Home prices YoY
- -13.1%
- Rents YoY
- 0.3%
- Active inventory
- 176
- Price-to-rent
- 4.2×
Monthly cashflow live
- Estimated rent
- $2,326 high interval (Pro) →
- Mortgage (P&I)
- −$1,077
- Tax est. 1.5%
- −$257 /mo · $3,082/yr
- Insurance
- −$86
- HOA
- −$0
- Vacancy / Maint / Mgmt
- −$488
- Net cashflow
- $418
Break-even live
UW: 25.0% down · 7.5% · 30yr · 1.5% tax · 5.0% vac · 8.0% maint · 8.0% mgmt
Financing live
Cash to close
- Down payment
- $51,359
- Closing costs
- $6,163
- Reserves months
- —
- Total cash needed
- —
Loan-product check · same deal, 3 products live
Conventional
25% down · 7.5% · 30yr
- Down + closing
- —
- Monthly P&I
- —
- Monthly cashflow
- —
- DSCR
- —
- Eligible?
- —
Personal DTI + credit; lowest rate.
DSCR
20% down · 8.5% · 30yr
- Down + closing
- —
- Monthly P&I
- —
- Monthly cashflow
- —
- DSCR
- —
- Eligible?
- —
No personal income docs; deal must DSCR.
Hard money
10% down · 12.0% · 12mo
- Down + closing
- —
- Monthly P&I
- —
- Monthly cashflow
- —
- DSCR
- —
- Eligible?
- —
Short-term bridge; refi at stabilization.
Rent comps 29 comps
| Address | Beds | Baths | Sqft | Rent | $/sqft | DOM | Units | Dist |
|---|---|---|---|---|---|---|---|---|
| 6109 Decker Ln Austin, TX | 3.0 | 2.0 | 1513 | $2,275 | $1.50 | 16d | 1 | 0.15mi |
| 6107 Decker Ln Austin, TX | 1.0–3.0 | 1.0–2.0 | 991 | $2,785 | $2.81 | 2d | 62 | 0.20mi |
| 8101 Loyola Ln Austin, TX | 1.0–3.0 | 1.0–3.5 | 1333 | $3,049 | $2.29 | 3d | 99 | 0.48mi |
| 8305 Garcreek Cir Unit A&C Austin, TX | 3.0 | 2.5 | 1100 | $1,399 | $1.27 | 44d | 1 | 0.55mi |
| 8401 Garcreek Cir Austin, TX | 3.0 | 2.0 | 1200 | $1,850 | $1.54 | 3d | 1 | 0.57mi |
| 9212 China Rose Dr Austin, TX | 3.0 | 2.0 | 1429 | $1,800 | $1.26 | 44d | 1 | 0.58mi |
| 9351 Decker Lake Rd Austin, TX | 1.0–4.0 | 1.0–2.0 | 1002 | $1,999 | $2.00 | 2d | 12 | 0.59mi |
| 5813 Knoll Pines Pass Austin, TX | 3.0 | 2.0 | 1516 | $1,750 | $1.15 | 4d | 1 | 0.62mi |
| 9025 Sun Shower Bnd Austin, TX | 3.0 | 2.0 | 1704 | $2,200 | $1.29 | 24d | 1 | 0.65mi |
| 5717 Levenwood Ln Austin, TX | 3.0 | 2.0 | 1510 | $1,895 | $1.25 | 18d | 1 | 0.69mi |
| 6013 Florencia Ln Austin, TX | 3.0 | 3.0 | 1957 | $3,600 | $1.84 | 12d | 1 | 0.71mi |
| 5517 Agatha Cir Austin, TX | 3.0 | 2.5 | 1627 | $2,850 | $1.75 | 4d | 1 | 0.83mi |
| 7000 Decker Ln Austin, TX | 1.0–4.0 | 1.0–2.0 | 955 | $1,809 | $1.89 | 3d | 19 | 0.83mi |
| 5928 Signal Pt Austin, TX | 4.0 | 2.0 | 1500 | $1,800 | $1.20 | 44d | 1 | 0.85mi |
| 5724 Signal Pt Austin, TX | 3.0 | 2.0 | 1320 | $1,725 | $1.31 | 44d | 1 | 0.86mi |
| 6308 Perlita Dr Austin, TX | 3.0 | 2.5 | 1438 | $1,895 | $1.32 | 44d | 1 | 0.86mi |
| 5929 Alsace Trl Austin, TX | 3.0 | 2.0 | 1320 | $1,950 | $1.48 | 24d | 1 | 0.91mi |
| 5334 Sendero Hills Pkwy Austin, TX | 3.0 | 3.0 | 2166 | $4,299 | $1.98 | 24d | 1 | 0.91mi |
| 6902 Colony Park Dr Austin, TX | 4.0 | 1.5 | 1500 | $2,250 | $1.50 | 24d | 1 | 1.27mi |
| 8340 Mimi Ln Austin, TX | 3.0 | 2.5 | 1811 | $2,700 | $1.49 | 4d | 1 | 1.29mi |
| 8304 Mimi Ln Austin, TX | 4.0 | 2.5 | 2138 | $2,425 | $1.13 | 24d | 1 | 1.30mi |
| 8025 City Top Blvd Austin, TX | 3.0 | 2.0 | 1472 | $2,300 | $1.56 | 24d | 1 | 1.34mi |
| 8220 Linnie Ln Austin, TX | 4.0 | 2.5 | 2200 | $2,700 | $1.23 | 24d | 1 | 1.36mi |
| 7717 Lowenfield Dr Austin, TX | 3.0 | 2.0 | 1516 | $2,270 | $1.50 | 24d | 1 | 1.37mi |
| 7120 Carwill Dr Austin, TX | 3.0 | 2.0 | 1500 | $2,000 | $1.33 | 15d | 1 | 1.38mi |
| 7512 Daves Landing Dr Austin, TX | 3.0 | 2.0 | 1366 | $2,200 | $1.61 | 24d | 1 | 1.43mi |
| 6809 Jaired Dr Austin, TX | 3.0 | 2.0 | 1162 | $1,900 | $1.64 | 44d | 1 | 1.43mi |
| 7925 Linnie Ln Austin, TX | 4.0 | 2.5 | 2216 | $2,395 | $1.08 | 4d | 1 | 1.44mi |
| 7320 Muffin Dr Austin, TX | 3.0 | 2.0 | 1499 | $2,045 | $1.36 | 15d | 1 | 1.49mi |
Listing history 14 events
-
2026-06-18days on market $116,995 Active 68 DOM
-
2026-06-17days on market $116,995 Active 67 DOM
-
2026-06-16days on market $116,995 Active 66 DOM
-
2026-06-15days on market $116,995 Active 65 DOM
-
2026-06-13days on market $116,995 Active 63 DOM
-
2026-06-09days on market $116,995 Active 59 DOM
-
2026-06-08days on market $116,995 Active 58 DOM
-
2026-06-07days on market $116,995 Active 57 DOM
-
2026-06-05days on market $116,995 Active 54 DOM
-
2026-06-03days on market $116,995 Active 53 DOM
-
2026-06-02days on market $116,995 Active 52 DOM
-
2026-06-01days on market $116,995 Active 51 DOM
-
2026-05-31days on market $116,995 Active 50 DOM
-
2026-04-11$116,995 Active 644-char remark
Show marketing remark (644 chars)
Discover the perfect blend of comfort and affordability with the Sundowner. This spacious home is packed with premium features designed for modern family living. You'll love the expansive dining area, large kitchen island, and a huge utility room perfect for laundry day. The massive living room is the ideal gathering spot for family and friends. With four bedrooms, there's plenty of space for everyone. Key features include: Air conditioning Breakfast bar Double sinks in bathroom Kitchen island Built with Clayton's innovative eBuilt system, the Sundowner incorporates over 25 eco-friendly features without compromising on comfort or style.
ⓘ Source: listings_history table (triggers on properties + properties_extension) + one-shot
backfill from property_details.listing_events for pre-trigger history.
Climate risk First Street
- Flood 1/10 Low FEMA zone X (unshaded) · 0% chance over 30 yrs
- Wildfire 5/10 Major
- Heat 8/10 Severe 7 d/yr ≥108°F today · 25 d/yr by 30 yrs out
- Wind 8/10 Severe 80% chance of damaging wind over 30 yrs
- Air quality 2/10 Low 0 unhealthy d/yr today · 1 by 30 yrs out
Nearby sold comps map
Loading sold comps map…
Walkable amenities ~0.75 mi
Loading nearby amenities…
Taxation est. · year 1
- Rental income
- $27,912
- − Mortgage interest
- −$11,508
- − Property taxes
- −$3,082
- − Insurance
- −$1,027
- − Repairs & maintenance
- −$2,233
- − Management
- −$2,233
- − Depreciation
- −$5,976
- Taxable income
- $1,853
- Est. tax owed @ 24.0%
- −$445
- After-tax cash flow
- $4,569/yr
For passive investors: Depreciation is non-cash, so a rental often shows a tax loss while cash-flowing — sheltering income. Rental losses are passive: they offset passive income freely, and up to $25,000/yr can offset ordinary (W-2) income if you actively participate and your MAGI is under $100k (phasing out to $0 by $150k); unused losses carry forward. On sale, claimed depreciation is recaptured at up to 25%, and gains may owe capital-gains tax (a 1031 exchange can defer both). Figures are a year-1 estimate at your 24.0% rate — not tax advice; consult a CPA.
Condition & rehab AI · 9 photos
This Sundowner plan manufactured home is in good condition with modern features and a spacious layout. It is move-in ready with minor maintenance items to address.
Value-add opportunities
- Both Paint the exterior siding — Fresh paint can enhance curb appeal and property value
- Both Replace the ceiling fan in the living room — A new ceiling fan can improve air circulation and aesthetics
- Both Install smart home devices — Smart home devices can increase convenience and property value
Renovation cost estimate screening
Value-add ROI direction
- Both Paint the exterior siding — Fresh paint can enhance curb appeal and property value ↑
- Both Replace the ceiling fan in the living room — A new ceiling fan can improve air circulation and aesthetics ↑
- Both Install smart home devices — Smart home devices can increase convenience and property value ↑
ⓘ Cost ranges are severity-bucket heuristics (US national rule-of-thumb). Get contractor quotes + a written scope before underwriting a rehab budget.
Schools (NCES district)
- District
- Manor ISD
- NCES district ID
- 4828890
- Math proficiency
- 18% ▼ -19.00%
- Reading proficiency
- 26% ▼ -10.00%
- Median HH income
- $56,255
- Composite
- 20.14/100
- National rank
- #8641
- State rank
- #729 of 826 in TX
Livability — Austin
- Score
- 82/100
- State rank
- #16
- US rank
- #1208
Category grades
Schools grade is shown separately in the Schools card above.
Census & demographics
- County
- Travis County · 1,299,254 people
- City population
- 1,066,854
- Metro
- Austin-Round Rock-Georgetown, TX
- Population (ZIP)
- 31,103
- Household income
- $77,926
- Rent vs Own
- Severe rent burden
- 873.0
Population outlook (Travis County) Hauer SSP2
- Today (2025)
- 1,545,133 people
- By 2030
- 1,729,269 · +11.9%
- By 2040
- 2,097,596 · +35.8%
- By 2050
- 2,463,890 · +59.5%
- By 2075
- 3,249,374 · +110.3%
- By 2100
- 3,801,868 · +146.1%
Race, ethnicity, and origin ACS 2023
- Neighborhood character
- Diverse neighborhood (Simpson 0.56)
- Race & ethnicity
- Hispanic / Latino 63% Two or more races 30% Black 15% White 15% Asian 3%
- Hispanic origin (detail)
- Mexican 54% Puerto Rican 2% Cuban 1%
- Common ancestry
- Slovak 2% Lithuanian 1%
- Foreign-born
- 23% · Canada, Jamaica, China
- Languages at home
- 48% English-only · Spanish 48% Other Asian/Pacific 1% Other Indo-European 1%
Political lean MEDSL · Travis
- 2024 margin
- Solid D (+39.3) · D 68.8% · R 29.4% · Other 1.8%
- 2008→2024 swing
- +9.9pp toward D · 2008: 29.4pp · 2024: 39.3pp
- All cycles
- 2024: D+39.3 2020: D+45.0 2016: D+38.9 2012: D+23.9 2008: D+29.4
Not yet ingested
- Civics
- —
Market trends
- HPI YoY
- ▼ -42.92%
- Current HPI
- 284.1007
- Rent YoY
- ▲ 0.26%
- Metro
- Austin-Round Rock-Georgetown, TX
- State GDP YoY
- ▲ 3.95%
- F500 in state
- 110
Industry mix (Fortune 500 HQ in TX)
| Industry | F500 HQs | Revenue |
|---|---|---|
| Energy | 16 | $1,198B |
|
||
| Technology | 5 | $198B |
|
||
| Engineering / Construction | 4 | $72B |
|
||
| Energy Services | 3 | $60B |
|
||
| Utilities | 3 | $41B |
|
||
| Healthcare | 2 | $330B |
|
||
Price history
1 event — show timeline
- 2026-04-11 Listed $116,995 Zillow
Cash-flow waterfall
monthlySold comps — $/sqft
last 12 mo · ≤1 miLoading sold comps…