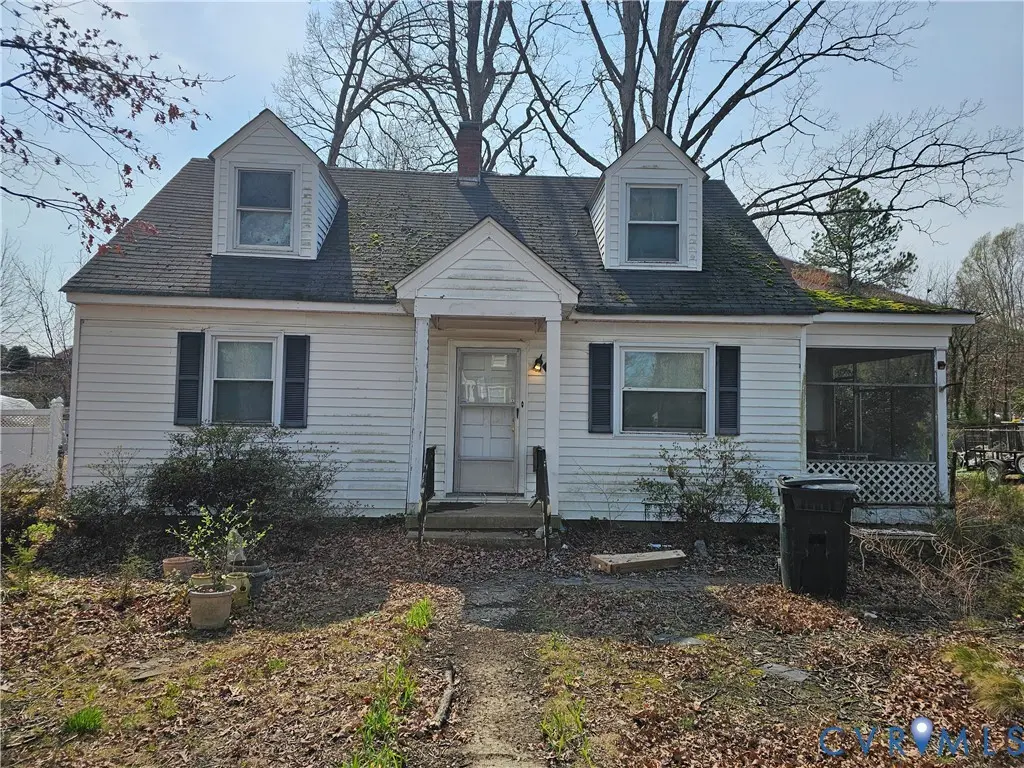
3455 Mcguire Dr · Richmond, VA
Flood risk 7/10 · Major
- FEMA flood zone
- X (unshaded)
- Chance of flooding over 30 yrs
- 0.97%
- Est. flood insurance / yr
- $507 – $1,088
Fire risk 1/10 · Minimal
- Est. fire insurance / yr
- $666 – $1,236
Heat risk 8/10 · Major
- Hot days now (above 105°F)
- 7 days/yr
- Hot days in 30 yrs
- 16 days/yr
Wind risk 6/10 · Moderate
- Chance of severe wind over 30 yrs
- 27.0%
Air-quality risk 2/10 · Minimal
- Unhealthy air days now
- 1 days/yr
- Unhealthy air days in 30 yrs
- 1 days/yr
Risk factors via First Street. Map © Google.
Why this score? — see what drove the D+ grade
The composite is a weighted blend of 9 inputs, each scored 0–100. Each bar is that input's sub-score; the figure is the points it added to the 100-point composite (weight × sub-score).
- Cash flow +13.8/30.0
- ARV discount +10.7/15.0
- DSCR +4.2/10.0
- Livability +4.2/5.0
- Rent growth +3.6/5.0
- Schools +3.3/10.0
- 1% rule +3.0/10.0
- Condition / age +2.5/5.0
- Appreciation +0.0/10.0
$225,000
🖨 Deal sheet (PDF) 📄 Offer letter ✓ Due diligence
Listing remarks MLS
Investors Special! Needs to be completely renovated. Has 3 bedrooms and an additional room on the first floor, which could be a 4th bedroom. There is a full bath downstairs and one upstairs.
Key facts
- 9,112 sq ft lot
- Parking
- Built 1950
Neighborhood map
What this means for you Summary
Snapshot
- This is a 3-bed/1.0-bath single-family listed at $225k.
Deal economics
- At list price, monthly cash flow is $-45 ($-541/yr) — negative.
- To cash-flow at today's rent, offer at most $217k (3.5% below list).
- To meet the 1% rule (rent ≥ 1% of price), the offer needs to be $180k (19.8% below list).
- Recommended offer: $180k (19.8% below list) — sets the bar for 1% rule.
- Cap rate 6.4% vs local median 3.2% in Richmond — top-decile yield for the area; either an underpriced asset or a hidden risk that comps aren't pricing in. Stress-test before assuming the spread holds.
Location & tenants
- Location reads 84/100 on livability (#33 in VA, #793 nationally) — a professional / high-income tenant draw. Strengths: amenities A+, commute A+, health & safety A+; Watch: crime D-.
- Richmond City Public School District (urban): math 32% / reading 47% proficiency, ranked #123 of 131 in VA (top 94%) — families likely to look elsewhere, expect single-tenant / working-renter base with shorter leases; 74% free/reduced lunch — lower-income household profile, screen leases tightly.
- Zoned schools: Elizabeth D. Redd Elementary (math 5% / reading 15%, grade F, #1,108 of 1,108 statewide, top 100%, 392 students, 96% FRL); Thomas C. Boushall Middle (math 12% / reading 27%, grade F, #340 of 342 statewide, top 99%, 611 students, 98% FRL); George Wythe High (math 12% / reading 37%, grade F, #319 of 319 statewide, top 100%, 1,309 students, 91% FRL) — zoned schools average 95% FRL vs 74% district-wide (21 pts higher); higher-poverty schools than district average — tighter screening recommended.
- Zoned-school proficiency averages 18% at this address vs 40% district-wide (-22 pts) — the specific schools serving this property underperform the Richmond City Public School District average; the district grade overstates school quality for this exact location.
- Market conditions: Rents rising fast (+4.5%/yr); 177 active listings in the ZIP; 23 comparable units currently listed for rent nearby; rentals at typical pace (median 26d on market — plan ~3-4 weeks tenant-placement turnaround); 48% of comp listings sitting > 30 days — soft ceiling on asking rent; 2,540 units permitted in Richmond city in 2024 (2,077 in 5+ unit buildings).
- This rent runs 43% of the median local income ($50k/yr) — at the standard rent-burdened threshold; future hikes will face affordability resistance.
Forward outlook
- Local home prices are declining (-3.0%/yr); year-one equity from $2k of loan paydown is wiped out by about $7k of value loss. Plan a longer hold.
- Richmond County population projected at +40% by 2050 — long-run rental-demand tailwind backs the buy-and-hold thesis.
Negotiation context
- It's been on market 89 days — a 6% lower offer ($212k) is reasonable based on typical stale-listing flexibility.
- Current owner paid $50k; list at $225k implies a 350% gain — meaningful room to come down on a strong offer.
Risks & watch-outs
- Watch-outs: flood insurance adds $66/mo; built in 1950 — expect roof / HVAC / electrical / plumbing capex.
- Climate carrying-cost: major flood risk; major wind risk, 27% chance of damaging wind over 30y; extreme-heat days projected 7→16/yr by 2055 (HVAC capex compounding) — expect insurance premiums to compound above CPI over the hold.
Questions for the listing agent
- What do current leases actually rent for vs. the listed asking? Can we see a recent rent roll and the last 12 months of T-12 income?
- It's been on market 89 days. Have you received any prior offers? Is the seller open to a 20% concession, seller financing, or rate buy-down credit?
- Built in 1950 — when were the roof, HVAC, electrical panel, plumbing, and water heater last replaced?
- What's the actual annual flood-insurance premium (NFIP or private), and is the property in a SFHA with mandatory coverage?
- Why hasn't it sold? Are there any deal-killer items the seller is aware of (foundation, flood, title, zoning, code violations)?
- Is there a deadline driving the sale (1031 exchange, divorce, estate, relocation)? That informs how much negotiation room exists.
- Schools are A-rated — typically a magnet for longer-tenancy family renters. What's the average tenant stay here, and is there a school-zone premium baked into asking?
- Crime grade is D in this area — have there been break-ins, vandalism, or insurance claims at this property in the last 3 years? What carrier currently insures it and at what premium?
- The area grade is low — what's the realistic commute time and amenity access for the typical tenant pool here? Any planned neighborhood developments (good or bad) we should know about?
- What's the average days-on-market for RENTAL listings here right now (not sales)? A rising rental-DOM trend means longer vacancies and softer asking-rent achievability than the comps imply.
- What's the recent tenant-quality profile in this submarket — average credit score on applications, eviction rate, late-payment / NSF rate, and stable-employment percentage? A property-management company in the area should have these aggregated.
- How much new for-sale + rental construction is in the pipeline within 1–3 miles? Heavy new supply typically softens prices + rents 12–24 months out; constrained supply supports both.
Investment metrics
- 1% rule
- 0.80% ✗
- Cap rate
- 6.41%
- Cash-on-cash
- 0.41%
- DSCR
- 1.02
- GRM
- 10.4
CMA / ARV
- ARV (median comp)
- $242,370
- List price
- $225,000
- Delta
- -7.17%
- Verdict
- FAIR
- Comps
- 20 within 1.0 mi
Show comp detail 12 sales within ~0.75 mi
| Address | Dist | Beds/Ba | Sqft | Sold | Price | $/sf | Match |
|---|---|---|---|---|---|---|---|
| 3028 Laurelbrook Dr | 0.44mi | 3/1.0 | 1,370 (+4%) | 2mo | $299,950 | $219 | 71 |
| 3112 Lost Ln | 0.38mi | 3/1.0 | 1,229 (-7%) | 6mo | $220,000 | $179 | 65 |
| 3601 Decatur St | 0.45mi | 3/1.0 | 1,428 (+8%) | 6mo | $255,000 | $179 | 61 |
| 1655 Hopkins Rd | 0.31mi | 3/1.5 | 1,160 (-12%) | 3mo | $295,000 | $254 | 60 |
| 1411 Hopkins Rd | 0.30mi | 4/2.0 (+1) | 1,196 (-10%) | 1mo | $210,000 | $176 | 60 |
| 801 Bedrock Ln | 0.59mi | 3/1.5 | 1,280 (-3%) | 8mo | $260,000 | $203 | 59 |
| 1420 Talbert Dr | 0.33mi | 3/1.0 | 1,504 (+14%) | 4mo | $264,950 | $176 | 58 |
| 3017 Hiden Rd | 0.51mi | 2/2.0 (-1) | 1,242 (-6%) | 2mo | $256,750 | $207 | 55 |
| 3313 Decatur St | 0.50mi | 3/2.5 | 1,453 (+10%) | 2mo | $360,000 | $248 | 52 |
| 1109 Evergreen Ave | 0.50mi | 4/2.0 (+1) | 1,503 (+14%) | 3mo | $185,000 | $123 | 43 |
| 207 E 37th St | 0.68mi | 3/2.0 | 1,486 (+12%) | 7mo | $330,000 | $222 | 38 |
| 3075 Stockton St | 0.64mi | 2/1.5 (-1) | 1,133 (-14%) | 4mo | $269,000 | $237 | 36 |
Match score weights: distance 35% · size 25% · config 20% · recency 20%. Top-matched comps best support the ARV.
Projected returns pro-forma
-3.0% appreciation · 4.55% rent growth · sell at horizon
- IRR
- -16.1%
- Equity multiple
- 0.42×
- Total profit
- $-36,498
- Equity at exit
- $33,548
- IRR
- -5.4%
- Equity multiple
- 0.63×
- Total profit
- $-23,479
- Equity at exit
- $19,454
Cash invested: $63,000 (down + closing). Projections, not guarantees.
Landlord ↔ Tenant lean methodology
- Overall (STATE)
- 55 Moderately Landlord-Leaning
- State Virginia
- 55 Moderately Landlord-Leaning · D+2
- County
- — inherits STATE
- City
- — inherits STATE
ZIP-level market 23224
- Rents YoY
- 4.5%
- Active inventory
- 177
- Price-to-rent
- 10.4×
Monthly cashflow live
- Estimated rent
- $1,804 high interval (Pro) →
- Mortgage (P&I)
- −$1,180
- Tax from tax record
- −$130 /mo · $1,560/yr
- Insurance
- −$94
- Flood insurance flood zone
- −$66 /mo · $798/yr
- HOA
- −$0
- Vacancy / Maint / Mgmt
- −$379
- Net cashflow
- $-45
Break-even live
Sensitivity live
| Price | -10% $82 | -5% $19 | +0% $-45 | +5% $-109 | +10% $-172 |
|---|---|---|---|---|---|
| Rent | -10% $-188 | -5% $-116 | +0% $-45 | +5% $26 | +10% $97 |
| Rate | -1.0pp $68 | -0.5pp $12 | base $-45 | +0.5pp $-103 | +1.0pp $-163 |
UW: 25.0% down · 7.5% · 30yr · 1.5% tax · 5.0% vac · 8.0% maint · 8.0% mgmt
Financing live
Cash to close
- Down payment
- $56,250
- Closing costs
- $6,750
- Reserves months
- —
- Total cash needed
- —
Loan-product check · same deal, 3 products live
Conventional
25% down · 7.5% · 30yr
- Down + closing
- —
- Monthly P&I
- —
- Monthly cashflow
- —
- DSCR
- —
- Eligible?
- —
Personal DTI + credit; lowest rate.
DSCR
20% down · 8.5% · 30yr
- Down + closing
- —
- Monthly P&I
- —
- Monthly cashflow
- —
- DSCR
- —
- Eligible?
- —
No personal income docs; deal must DSCR.
Hard money
10% down · 12.0% · 12mo
- Down + closing
- —
- Monthly P&I
- —
- Monthly cashflow
- —
- DSCR
- —
- Eligible?
- —
Short-term bridge; refi at stabilization.
Rent comps 23 comps
| Address | Beds | Baths | Sqft | Rent | $/sqft | DOM | Units | Dist |
|---|---|---|---|---|---|---|---|---|
| 3314 Decatur St Richmond, VA | 2.0 | 1.5 | 1640 | $1,800 | $1.10 | 45d | 1 | 0.45mi |
| 3154 Stockton St Richmond, VA | 3.0 | 1.0 | 1169 | $1,600 | $1.37 | 45d | 1 | 0.48mi |
| 2143 S Kinsley Ave Richmond, VA | 4.0 | 1.0 | 1297 | $1,550 | $1.20 | 45d | 1 | 0.84mi |
| 3300 Midlothian Tpke Richmond, VA | 2.0 | 1.0 | 1116 | $1,800 | $1.61 | 6d | 1 | 0.86mi |
| 100 Mardick Rd Richmond, VA | 4.0 | 2.0 | 1254 | $2,250 | $1.79 | 25d | 1 | 0.91mi |
| 1100 Richmond Hwy Richmond, VA | 1.0–3.0 | 1.0–2.0 | 1062 | $2,345 | $2.21 | 3d | 16 | 1.01mi |
| 1200 Southwood Pkwy Richmond, VA | 1.0–2.0 | 1.0–2.0 | 916 | $1,605 | $1.75 | 45d | 11 | 1.05mi |
| 10 W 27th St Unit P P Richmond, VA | 2.0 | 1.0 | 975 | $1,300 | $1.33 | 45d | 1 | 1.08mi |
| 216 Brandon Rd Richmond, VA | 3.0 | 1.0 | 1237 | $1,800 | $1.46 | 25d | 1 | 1.09mi |
| 800 Richmond Hwy Richmond, VA | 1.0–2.0 | 1.0–2.0 | 778 | $2,044 | $2.63 | 45d | 1 | 1.15mi |
| 1410 Enfield Ave Unit 1410 Richmond, VA | 3.0 | 1.0 | 912 | $1,500 | $1.64 | 45d | 1 | 1.17mi |
| 3309 Delano St Richmond, VA | 3.0 | 2.0 | 1542 | $1,850 | $1.20 | 45d | 1 | 1.18mi |
| 152 Brandon Rd Richmond, VA | 3.0 | 1.0 | 1237 | $2,109 | $1.70 | 25d | 1 | 1.18mi |
| 4904 Warwick Rd Unit 4705 Richmond, VA | 2.0 | 1.5 | 900 | $1,400 | $1.56 | 45d | 1 | 1.22mi |
| 2522 Porter St Richmond, VA | 3.0 | 2.5 | 1390 | $1,800 | $1.29 | 45d | 1 | 1.29mi |
| 2200 Ingram Ave Richmond, VA | 2.0 | 1.0–2.0 | 711 | $1,668 | $2.35 | 6d | 1 | 1.32mi |
| 2208 Keswick Ave Richmond, VA | 3.0 | 1.0 | 916 | $1,775 | $1.94 | 22d | 1 | 1.35mi |
| 2010 Maury St Richmond, VA | 2.0 | 1.0 | 883 | $1,675 | $1.90 | 6d | 1 | 1.37mi |
| 2708 Semmes Ave Unit A Richmond, VA | 2.0 | 1.0 | 1050 | $1,275 | $1.21 | 45d | 1 | 1.38mi |
| 1913 Dinwiddie Ave Unit 1546196P Richmond, VA | 2.0 | 1.0 | 1044 | $2,519 | $2.41 | 16d | 1 | 1.40mi |
| 1305 Chambers St Richmond, VA | 2.0 | 1.0 | 966 | $1,100 | $1.14 | 25d | 1 | 1.42mi |
| 1840 Powell Rd Richmond, VA | 2.0 | 1.0 | 1228 | $1,695 | $1.38 | 18d | 1 | 1.44mi |
| 1808 Edwards Ave Richmond, VA | 3.0 | 2.0 | 1040 | $1,750 | $1.68 | 25d | 1 | 1.44mi |
Listing history 10 events
-
2026-06-10days on market $225,000 Active 89 DOM
-
2026-06-09days on market $225,000 Active 88 DOM
-
2026-06-08days on market $225,000 Active 87 DOM
-
2026-06-07days on market $225,000 Active 86 DOM
-
2026-06-03days on market $225,000 Active 82 DOM
-
2026-06-02days on market $225,000 Active 81 DOM
-
2026-06-01days on market $225,000 Active 80 DOM
-
2026-05-31days on market $225,000 Active 79 DOM
-
2026-03-11$225,000 Active 191-char remark
Show marketing remark (191 chars)
Investors Special! Needs to be completely renovated. Has 3 bedrooms and an additional room on the first floor, which could be a 4th bedroom. There is a full bath downstairs and one upstairs.
-
1994-11-28soldstatus $49,950
ⓘ Source: listings_history table (triggers on properties + properties_extension) + one-shot
backfill from property_details.listing_events for pre-trigger history.
Tax reassessment forecast VA · Resets to sale price
- Current annual tax
- $1,560 · $130/mo
- Projected year-2 tax
- $1,845 · $154/mo
- Expected delta
- +$285/yr (+$24/mo · 18.3%)
ⓘ Screening estimate from a state-policy table — verify with the county assessor before closing.
Climate risk First Street
- Flood 7/10 Severe FEMA zone X (unshaded) · 97% chance over 30 yrs
- Wildfire 1/10 Low
- Heat 8/10 Severe 7 d/yr ≥105°F today · 16 d/yr by 30 yrs out
- Wind 6/10 Major 27% chance of damaging wind over 30 yrs
- Air quality 2/10 Low 1 unhealthy d/yr today · 1 by 30 yrs out
Nearby sold comps map
Loading sold comps map…
Walkable amenities ~0.75 mi
Loading nearby amenities…
Taxation est. · year 1
- Rental income
- $21,647
- − Mortgage interest
- −$12,603
- − Property taxes
- −$1,560
- − Insurance
- −$1,922
- − Repairs & maintenance
- −$1,732
- − Management
- −$1,732
- − Depreciation
- −$6,545
- Taxable loss
- −$4,448
- Est. tax savings @ 24.0%
- +$1,068
- After-tax cash flow
- $527/yr
For passive investors: Depreciation is non-cash, so a rental often shows a tax loss while cash-flowing — sheltering income. Rental losses are passive: they offset passive income freely, and up to $25,000/yr can offset ordinary (W-2) income if you actively participate and your MAGI is under $100k (phasing out to $0 by $150k); unused losses carry forward. On sale, claimed depreciation is recaptured at up to 25%, and gains may owe capital-gains tax (a 1031 exchange can defer both). Figures are a year-1 estimate at your 24.0% rate — not tax advice; consult a CPA.
Schools (NCES district)
- District
- Richmond City Public School District
- NCES district ID
- 5103240
- Math proficiency
- 32% ▼ -24.00%
- Reading proficiency
- 47% ▼ -9.00%
- Median HH income
- $40,276
- Composite
- 33.09/100
- National rank
- #5564
- State rank
- #123 of 131 in VA
Livability — Richmond
- Score
- 84/100
- State rank
- #33
- US rank
- #793
Category grades
Schools grade is shown separately in the Schools card above.
Census & demographics
- Census place
- Richmond, VA
- County
- Richmond City · 178,280 people
- City population
- 287,109
- Metro
- Richmond, VA
- Population (ZIP)
- 40,575
- Household income
- $50,475
- Rent vs Own
- Severe rent burden
- 3584.0
Population outlook (Richmond County) Hauer SSP2
- Today (2025)
- 262,263 people
- By 2030
- 284,503 · +8.5%
- By 2040
- 327,353 · +24.8%
- By 2050
- 367,946 · +40.3%
- By 2075
- 449,560 · +71.4%
- By 2100
- 500,301 · +90.8%
Race, ethnicity, and origin ACS 2023
- Neighborhood character
- Diverse neighborhood (Simpson 0.58)
- Race & ethnicity
- Black 59% Hispanic / Latino 22% White 15% Two or more races 6%
- Hispanic origin (detail)
- Mexican 5% Puerto Rican 2%
- Common ancestry
- Romanian 1% Lithuanian 1% Serbian 1%
- Foreign-born
- 17% · Canada
- Languages at home
- 78% English-only · Spanish 19% French/Haitian/Cajun 1%
Political lean MEDSL · Richmond
- 2024 margin
- Solid D (+66.3) · D 82.0% · R 15.8% · Other 2.2%
- 2008→2024 swing
- +7.2pp toward D · 2008: 59.1pp · 2024: 66.3pp
- All cycles
- 2024: D+66.3 2020: D+68.0 2016: D+63.8 2012: D+55.7 2008: D+59.1
Not yet ingested
- Civics
- —
Market trends
- HPI YoY
- ▼ -283.99%
- Current HPI
- 336.9345
- Rent YoY
- ▲ 4.55%
- Metro
- Richmond, VA
- State GDP YoY
- ▲ 2.40%
- F500 in state
- 50
Industry mix (Fortune 500 HQ in VA)
| Industry | F500 HQs | Revenue |
|---|---|---|
| Aerospace / Defense | 4 | $236B |
|
||
| Technology / Defense | 3 | $32B |
|
||
| Financial Services | 2 | $176B |
|
||
| Utilities | 2 | $27B |
|
||
| Insurance | 2 | $25B |
|
||
| Technology | 2 | $15B |
|
||
Price history
+350.5% since first listed2 events — show timeline
- 2026-03-11 Listed $225,000 CVRMLS
- 1994-11-28 Sold (Public Records) $49,950 Public Records
Property tax history
+9.4%/yrLatest (2022): $1,560 · -14.8% YoY. Source: county tax records.
Cash-flow waterfall
monthlySold comps — $/sqft
last 12 mo · ≤1 miLoading sold comps…