 🏷️ Likely Rental
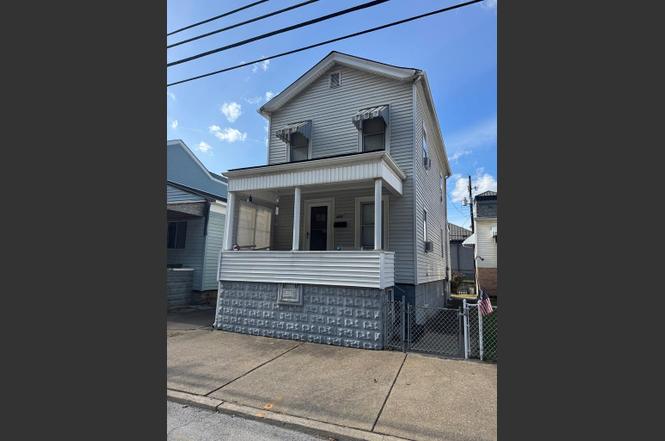
437 Mcmechen St · Benwood, WV
Flood risk 8/10 · Major
- FEMA flood zone
- AE
- Chance of flooding over 30 yrs
- 0.49%
- Est. flood insurance / yr
- $2,026 – $9,024
Fire risk 1/10 · Minimal
- Est. fire insurance / yr
- $787 – $1,461
Heat risk 3/10 · Minor
- Hot days now (above 97°F)
- 7 days/yr
- Hot days in 30 yrs
- 19 days/yr
Wind risk 1/10 · Minimal
- Chance of severe wind over 30 yrs
- —
Air-quality risk 2/10 · Minimal
- Unhealthy air days now
- 0 days/yr
- Unhealthy air days in 30 yrs
- 1 days/yr
Risk factors via First Street. Map © Google.
Why this score? — see what drove the A- grade
The composite is a weighted blend of 9 inputs, each scored 0–100. Each bar is that input's sub-score; the figure is the points it added to the 100-point composite (weight × sub-score).
- Cash flow +30.0/30.0
- ARV discount +15.0/15.0
- 1% rule +10.0/10.0
- DSCR +10.0/10.0
- Appreciation +6.9/10.0
- Livability +3.2/5.0
- Schools +2.7/10.0
- Rent growth +2.5/5.0
- Condition / age +2.5/5.0
$54,900
🖨 Deal sheet (PDF) 📄 Offer letter ✓ Due diligence
Listing remarks
Hey Investors!!! Look at this one!!! Conveniently located to Rt. 2 in Benwood-- easy access on and off of Benwood Exit. Property is currently rented through Parkersburg Housing Authority. Tenant pays $700 a month with assistance from HUD and pays her own utilities. All appliances belong to tenant including A/C units. Property is located in flood plain--has not flooded since 1972 due to the flood wall that was installed on Water Street years ago. Tenant works different hours every day---"NEED" a 24-hour notice to view property.
Key facts
- Flood wall installed
- Easy access
- Currently rented
Tags
Neighborhood map
What this means for you Summary
Snapshot
- This is a 2-bed/1.0-bath single-family listed at $55k.
Deal economics
- At list price, monthly cash flow is $-61 ($-736/yr) — negative.
- To cash-flow at today's rent, offer at most $44k (19.7% below list).
- Meets the 1% rule at list price ($970 rent vs $55k).
- Recommended offer: $44k (19.7% below list) — sets the bar for cash-flow.
Location & tenants
- Location reads 64/100 on livability (#145 in WV) — a middle-class / working-renter tenant base. Strengths: crime A+, cost of living A+, housing A+; Watch: amenities F, commute F, employment F.
- Marshall County Schools (suburban): math 28% / reading 36% proficiency, ranked #21 of 55 in WV (top 38%) — families likely to look elsewhere, expect single-tenant / working-renter base with shorter leases.
- Zoned schools: Center Mcmechen Elementary School (math 42% / reading 42%, grade F, #87 of 377 statewide, top 28%, 197 students, 0% FRL); Sherrard Middle School (math 27% / reading 43%, grade F, #33 of 109 statewide, top 30%, 454 students, 0% FRL); John Marshall High School (math 22% / reading 49%, grade F, #41 of 110 statewide, top 37%, 1,046 students, 0% FRL) — zoned schools average 0% FRL vs 42% district-wide (42 pts lower); this property's tenant base skews higher-income than the district average.
- Market conditions: 16 active listings in the ZIP; 6 units permitted in Marshall County in 2024 (0 in 5+ unit buildings).
Forward outlook
- In year one you build about $2k of equity ($380 loan paydown + $2k appreciation (3.8% local appreciation)).
- Marshall County population projected at -19% by 2050 — secular population decline; favor cash flow + early exit over multi-decade hold.
- At projected returns (3.8% appreciation + 3.0% rent growth), your $15k cash investment doubles in ~7 years — after that, you're playing with house money.
Negotiation context
- It's been on market 165 days — a 12% lower offer ($48k) is reasonable based on typical stale-listing flexibility.
Risks & watch-outs
- Watch-outs: flood insurance adds $460/mo; built in 1900 — expect roof / HVAC / electrical / plumbing capex.
- Climate carrying-cost: in FEMA flood zone AE (mandatory federal flood insurance) — expect insurance premiums to compound above CPI over the hold.
Questions for the listing agent
- What do current leases actually rent for vs. the listed asking? Can we see a recent rent roll and the last 12 months of T-12 income?
- It's been on market 165 days. Have you received any prior offers? Is the seller open to a 20% concession, seller financing, or rate buy-down credit?
- Built in 1900 — when were the roof, HVAC, electrical panel, plumbing, and water heater last replaced?
- What's the actual annual flood-insurance premium (NFIP or private), and is the property in a SFHA with mandatory coverage?
- Why hasn't it sold? Are there any deal-killer items the seller is aware of (foundation, flood, title, zoning, code violations)?
- Is there a deadline driving the sale (1031 exchange, divorce, estate, relocation)? That informs how much negotiation room exists.
- Schools are F-rated, which usually means shorter tenancies and higher turnover. Who's the typical renter profile here, and what's been the actual vacancy rate?
- What's the average days-on-market for RENTAL listings here right now (not sales)? A rising rental-DOM trend means longer vacancies and softer asking-rent achievability than the comps imply.
- What's the recent tenant-quality profile in this submarket — average credit score on applications, eviction rate, late-payment / NSF rate, and stable-employment percentage? A property-management company in the area should have these aggregated.
- How much new for-sale + rental construction is in the pipeline within 1–3 miles? Heavy new supply typically softens prices + rents 12–24 months out; constrained supply supports both.
Investment metrics
- 1% rule
- 1.77% ✓
- Cap rate
- 15.02%
- Cash-on-cash
- 31.16%
- DSCR
- 2.39
- GRM
- 4.7
CMA / ARV
- ARV (on-the-fly)
- $87,600
- Comps found
- 4
Show comp detail 4 sales within ~0.75 mi
| Address | Dist | Beds/Ba | Sqft | Sold | Price | $/sf | Match |
|---|---|---|---|---|---|---|---|
| 135 Roosevelt Ave | 0.43mi | 2/1.0 | 1,168 (+7%) | 0mo | $77,500 | $66 | 69 |
| 111 Roosevelt Ave | 0.49mi | 2/1.0 | 1,008 (-8%) | 14mo | $70,000 | $69 | 52 |
| 3510 Trumbull St | 0.72mi | 3/1.0 (+1) | 1,000 (-9%) | 0mo | $85,000 | $85 | 47 |
| 3725 Franklin St | 0.64mi | 3/1.5 (+1) | 1,163 (+6%) | 18mo | $92,500 | $80 | 38 |
Match score weights: distance 35% · size 25% · config 20% · recency 20%. Top-matched comps best support the ARV.
Projected returns pro-forma
3.8% appreciation · 3.0% rent growth · sell at horizon
- IRR
- 5.8%
- Equity multiple
- 1.35×
- Total profit
- $5,355
- Equity at exit
- $27,192
- IRR
- 8.7%
- Equity multiple
- 2.44×
- Total profit
- $22,126
- Equity at exit
- $43,970
Cash invested: $15,372 (down + closing). Projections, not guarantees.
Landlord ↔ Tenant lean methodology
- Overall (STATE)
- 83 Strongly Landlord-Friendly
- State West Virginia
- 83 Strongly Landlord-Friendly · R+22
- County
- — inherits STATE
- City
- — inherits STATE
ZIP-level market 26031
- Home prices YoY
- 2.6%
- Active inventory
- 16
- Price-to-rent
- 4.7×
Monthly cashflow live
- Estimated rent
- $970 medium interval (Pro) →
- Mortgage (P&I)
- −$288
- Tax from tax record
- −$57 /mo · $682/yr
- Insurance
- −$23
- Flood insurance flood zone
- −$460 /mo · $5,525/yr
- HOA
- −$0
- Vacancy / Maint / Mgmt
- −$204
- Net cashflow
- $-61
Break-even live
Sensitivity live
| Price | -10% $-30 | -5% $-46 | +0% $-61 | +5% $-77 | +10% $-92 |
|---|---|---|---|---|---|
| Rent | -10% $-138 | -5% $-100 | +0% $-61 | +5% $-23 | +10% $15 |
| Rate | -1.0pp $-34 | -0.5pp $-47 | base $-61 | +0.5pp $-76 | +1.0pp $-90 |
UW: 25.0% down · 7.5% · 30yr · 1.5% tax · 5.0% vac · 8.0% maint · 8.0% mgmt
Financing live
Cash to close
- Down payment
- $13,725
- Closing costs
- $1,647
- Reserves months
- —
- Total cash needed
- —
Loan-product check · same deal, 3 products live
Conventional
25% down · 7.5% · 30yr
- Down + closing
- —
- Monthly P&I
- —
- Monthly cashflow
- —
- DSCR
- —
- Eligible?
- —
Personal DTI + credit; lowest rate.
DSCR
20% down · 8.5% · 30yr
- Down + closing
- —
- Monthly P&I
- —
- Monthly cashflow
- —
- DSCR
- —
- Eligible?
- —
No personal income docs; deal must DSCR.
Hard money
10% down · 12.0% · 12mo
- Down + closing
- —
- Monthly P&I
- —
- Monthly cashflow
- —
- DSCR
- —
- Eligible?
- —
Short-term bridge; refi at stabilization.
Listing history 3 events
-
2026-04-20status Pending
-
2026-03-24price $54,900
-
2025-11-06$59,900 Active
ⓘ Source: listings_history table (triggers on properties + properties_extension) + one-shot
backfill from property_details.listing_events for pre-trigger history.
Tax reassessment forecast WV · Resets to sale price
- Current annual tax
- $682 · $57/mo
- Projected year-2 tax
- $682 · $57/mo
- Expected delta
- $0/yr ($0/mo · 0.0%)
ⓘ Screening estimate from a state-policy table — verify with the county assessor before closing.
Climate risk First Street
- Flood 8/10 Severe FEMA zone AE · 49% chance over 30 yrs
- Wildfire 1/10 Low
- Heat 3/10 Moderate 7 d/yr ≥97°F today · 19 d/yr by 30 yrs out
- Wind 1/10 Low
- Air quality 2/10 Low 0 unhealthy d/yr today · 1 by 30 yrs out
Nearby sold comps map
Loading sold comps map…
Walkable amenities ~0.75 mi
Loading nearby amenities…
Taxation est. · year 1
- Rental income
- $11,646
- − Mortgage interest
- −$3,075
- − Property taxes
- −$682
- − Insurance
- −$5,800
- − Repairs & maintenance
- −$932
- − Management
- −$932
- − Depreciation
- −$1,597
- Taxable loss
- −$1,371
- Est. tax savings @ 24.0%
- +$329
- After-tax cash flow
- $-407/yr
For passive investors: Depreciation is non-cash, so a rental often shows a tax loss while cash-flowing — sheltering income. Rental losses are passive: they offset passive income freely, and up to $25,000/yr can offset ordinary (W-2) income if you actively participate and your MAGI is under $100k (phasing out to $0 by $150k); unused losses carry forward. On sale, claimed depreciation is recaptured at up to 25%, and gains may owe capital-gains tax (a 1031 exchange can defer both). Figures are a year-1 estimate at your 24.0% rate — not tax advice; consult a CPA.
Schools (NCES district)
- District
- Marshall County Schools
- NCES district ID
- 5400750
- Math proficiency
- 28% ▼ -6.00%
- Reading proficiency
- 36% ▼ -4.00%
- Median HH income
- $40,289
- Composite
- 26.91/100
- National rank
- #7086
- State rank
- #21 of 55 in WV
Livability — Benwood
- Score
- 64/100
- State rank
- #145
- US rank
- #14454
Category grades
Schools grade is shown separately in the Schools card above.
Census & demographics
- Census place
- Benwood, WV
- Population (ZIP)
- 1,556
Population outlook (Marshall County) Hauer SSP2
- Today (2025)
- 30,387 people
- By 2030
- 29,242 · -3.8%
- By 2040
- 26,806 · -11.8%
- By 2050
- 24,627 · -19.0%
- By 2075
- 19,846 · -34.7%
- By 2100
- 15,169 · -50.1%
Race, ethnicity, and origin ACS 2023
- Neighborhood character
- Predominantly White (91%)
- Race & ethnicity
- White 91% Two or more races 7%
- Common ancestry
- Romanian 11% Iranian 3% Subsaharan African 2%
- Foreign-born
- 1% · Canada
- Languages at home
- 98% English-only · German/W. Germanic 1% Spanish 1%
Political lean MEDSL · Marshall
- 2024 margin
- Solid R (+50.0) · D 24.1% · R 74.1% · Other 1.8%
- 2008→2024 swing
- -37.5pp toward R · 2008: -12.6pp · 2024: -50.0pp
- All cycles
- 2024: R+50.0 2020: R+49.6 2016: R+51.0 2012: R+28.6 2008: R+12.6
Not yet ingested
- Civics
- —
Market trends
- HPI YoY
- ▲ 3.80%
- Current HPI
- 150.8599
- Rent YoY
- —
- Metro
- —
- State GDP YoY
- —
- F500 in state
- 0
Price history
-8.3% since first listed3 events — show timeline
- 2026-04-20 Pending — WBOR
- 2026-03-24 Price Changed $54,900 WBOR
- 2025-11-06 Listed $59,900 WBOR
Property tax history
+2.9%/yrLatest (2025): $682 · +4.7% YoY. Source: county tax records.
Cash-flow waterfall
monthlySold comps — $/sqft
last 12 mo · ≤1 miLoading sold comps…