 Fourplex
6821 Mayo Rd · New Orleans, LA
Flood risk 8/10 · Major
- FEMA flood zone
- X (shaded)
- Chance of flooding over 30 yrs
- 0.6%
- Est. flood insurance / yr
- $507 – $1,088
Fire risk 1/10 · Minimal
- Est. fire insurance / yr
- $1,269 – $2,357
Heat risk 10/10 · Severe
- Hot days now (above 107°F)
- 7 days/yr
- Hot days in 30 yrs
- 21 days/yr
Wind risk 10/10 · Severe
- Chance of severe wind over 30 yrs
- 99.0%
Air-quality risk 3/10 · Minor
- Unhealthy air days now
- 3 days/yr
- Unhealthy air days in 30 yrs
- 3 days/yr
Risk factors via First Street. Map © Google.
Why this score? — see what drove the B- grade
The composite is a weighted blend of 9 inputs, each scored 0–100. Each bar is that input's sub-score; the figure is the points it added to the 100-point composite (weight × sub-score).
- Cash flow +30.0/30.0
- 1% rule +10.0/10.0
- DSCR +10.0/10.0
- ARV discount +5.9/15.0
- Livability +4.0/5.0
- Condition / age +2.5/5.0
- Rent growth +2.4/5.0
- Schools +1.6/10.0
- Appreciation +0.0/10.0
$310,000
🖨 Deal sheet (PDF) 📄 Offer letter ✓ Due diligence
Multi-family units
County records classify this as Multi-Family (2-4 Unit). Listing-text estimate: 4 units. confirmed
Listing remarks MLS
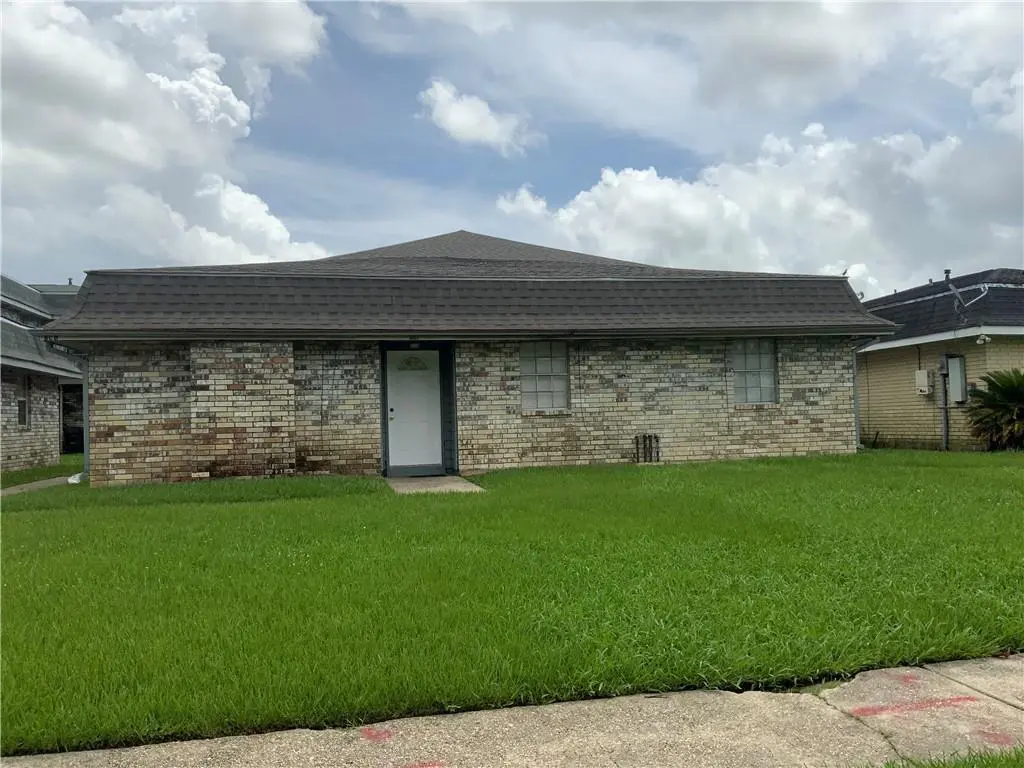
Solid 4-plex rental property located just minutes from the Crowder Road I-10 ramps. Mostly all brick construction with all utilities on individual meters.
Key facts
- Individual meters
- Parking
- Built 1981
Tags
Property features AI
Finance
- Other:
- Financial info: 4 total units; Tenants pay electricity, gas, and water
- HOA & community:
Exterior
- Parking: Carport
- Security:
- Utilities: Public water; Public sewer
- Home design: 2-story building; New construction in 1981
- Construction: Brick and vinyl siding exterior; Shingle roof; Slab foundation; Average condition
- Exterior features: Fenced yard; City lot; Rectangular lot (54 x 140)
Interior
- Kitchen:
- Bedrooms:
- Flooring:
- Bathrooms: 5 full bathrooms; 2 half bathrooms
- Heating & cooling: Central heating; Central air conditioning
- Interior features: Screened windows
- Laundry & utility:
Neighborhood map
What this means for you Summary
Snapshot
- This is a 4 × 2-bed/1.5-bath units multifamily listed at $310k.
Deal economics
- At list price, monthly cash flow is $2k ($29k/yr) — positive. Per door: $611/mo.
- The deal already cash-flows at list — no discount required.
- Meets the 1% rule at list price ($6k rent vs $310k).
- Recommended offer: $305k (1.5% below list) — sets the bar for market timing.
- Cap rate 16.0% vs local median 4.4% in New Orleans — top-decile yield for the area; either an underpriced asset or a hidden risk that comps aren't pricing in. Stress-test before assuming the spread holds.
Location & tenants
- Location reads 81/100 on livability (#3 in LA, #1,383 nationally) — a professional / high-income tenant draw. Strengths: amenities A+, commute A+, health & safety A+; Watch: crime C-, employment D.
- Orleans Parish (urban): math 11% / reading 27% proficiency, ranked #69 of 98 in LA (top 70%) — low school quality limits family demand, transient renter base, plan for 1-2y turnover; 68% free/reduced lunch — lower-income household profile, screen leases tightly.
- Zoned schools: Benjamin Franklin Elem. Math And Science (math 12% / reading 23%, grade F, #479 of 646 statewide, top 75%, 747 students, 98% FRL, charter) — zoned schools average 98% FRL vs 68% district-wide (30 pts higher); higher-poverty schools than district average — tighter screening recommended.
- Market conditions: Rents soft (-0.2%/yr); 224 active listings in the ZIP; lower-income renter base — watch delinquency; 710 units permitted in Orleans Parish in 2024 (244 in 5+ unit buildings).
Forward outlook
- Local home prices are declining (-3.0%/yr); year-one equity from $2k of loan paydown is wiped out by about $9k of value loss. Plan a longer hold.
- Orleans County population projected at +61% by 2050 — long-run rental-demand tailwind backs the buy-and-hold thesis.
- At projected returns (-3.0% appreciation + 0.0% rent growth), your $87k cash investment doubles in ~4 years — after that, you're playing with house money.
Negotiation context
- It's been on market 26 days — a 2% lower offer ($305k) is reasonable based on typical stale-listing flexibility.
- 2 sale attempts with the ask held roughly flat each time — persistent listings suggest the price (not the market) is what's stuck; bring a comps-based counter.
- Current owner paid $152k; list at $310k implies a 104% gain — meaningful room to come down on a strong offer.
Risks & watch-outs
- Watch-outs: flood insurance adds $66/mo.
- Climate carrying-cost: severe flood risk; severe wind risk, 99% chance of damaging wind over 30y; extreme-heat days projected 7→21/yr by 2055 (HVAC capex compounding) — expect insurance premiums to compound above CPI over the hold.
Questions for the listing agent
- Can we see the unit-by-unit rent roll, current vacancy, and any below-market leases? What's the average tenancy length?
- What capital expenditures (roof, boiler, parking lot, exteriors) have been made in the last 5 years, and what's planned in the next 2?
- What's the actual annual flood-insurance premium (NFIP or private), and is the property in a SFHA with mandatory coverage?
- Is there a deadline driving the sale (1031 exchange, divorce, estate, relocation)? That informs how much negotiation room exists.
- What's the average days-on-market for RENTAL listings here right now (not sales)? A rising rental-DOM trend means longer vacancies and softer asking-rent achievability than the comps imply.
- What's the recent tenant-quality profile in this submarket — average credit score on applications, eviction rate, late-payment / NSF rate, and stable-employment percentage? A property-management company in the area should have these aggregated.
- How much new apartment / multifamily construction is in the pipeline within 1–3 miles? Heavy new supply (>2% of stock underway) typically softens rents 12–24 months out; light construction supports rent growth.
Investment metrics
- 1% rule
- 1.81% ✓
- Cap rate
- 16.01%
- Cash-on-cash
- 34.70%
- DSCR
- 2.54
- GRM
- 4.6
CMA / ARV
- ARV (on-the-fly)
- $299,065
- Comps found
- 4
Show comp detail 4 sales within ~0.75 mi
| Address | Dist | Beds/Ba | Sqft | Sold | Price | $/sf | Match |
|---|---|---|---|---|---|---|---|
| 6816 W Coronet Ct | 0.03mi | 9/8.0 (+1) | 4,601 (0%) | 18mo | $340,000 | $74 | 64 |
| 6833 E Coronet Ct | 0.27mi | 8/6.0 | 4,224 (-8%) | 2mo | $254,375 | $60 | 64 |
| 7874 S Coronet Ct | 0.27mi | 8/6.0 | 4,000 (-13%) | 17mo | $260,000 | $65 | 43 |
| 4623-25 Wilson Ave | 0.60mi | 8/8.0 | 4,052 (-12%) | 9mo | $255,000 | $63 | 28 |
Match score weights: distance 35% · size 25% · config 20% · recency 20%. Top-matched comps best support the ARV.
Projected returns pro-forma
-3.0% appreciation · 0.0% rent growth · sell at horizon
- IRR
- 25.8%
- Equity multiple
- 2.02×
- Total profit
- $88,942
- Equity at exit
- $46,222
- IRR
- 31.6%
- Equity multiple
- 3.47×
- Total profit
- $214,228
- Equity at exit
- $26,803
Cash invested: $86,800 (down + closing). Projections, not guarantees.
Landlord ↔ Tenant lean methodology
- Overall (STATE)
- 90 Strongly Landlord-Friendly
- State Louisiana
- 90 Strongly Landlord-Friendly · R+12
- County
- — inherits STATE
- City
- — inherits STATE
ZIP-level market 70126
- Home prices YoY
- -17.0%
- Rents YoY
- -0.2%
- Active inventory
- 224
- Price-to-rent
- 18.4×
Monthly cashflow live
- Estimated rent
- $5,616 high interval (Pro) →
- Mortgage (P&I)
- −$1,626
- Tax from tax record
- −$172 /mo · $2,060/yr
- Insurance
- −$129
- Flood insurance flood zone
- −$66 /mo · $798/yr
- HOA
- −$0
- Vacancy / Maint / Mgmt
- −$1,179
- Net cashflow
- $2,444
Break-even live
Sensitivity live
| Price | -10% $2,619 | -5% $2,531 | +0% $2,444 | +5% $2,356 | +10% $2,268 |
|---|---|---|---|---|---|
| Rent | -10% $2,000 | -5% $2,222 | +0% $2,444 | +5% $2,666 | +10% $2,887 |
| Rate | -1.0pp $2,600 | -0.5pp $2,523 | base $2,444 | +0.5pp $2,363 | +1.0pp $2,282 |
4-unit breakdown (identical units grouped — click to expand)
| Units | Beds | Baths | Est. rent |
|---|---|---|---|
| 4× units | 2 | 1.5 | $5,616 |
| #1 | 2 | 1.5 | $1,404 |
| #2 | 2 | 1.5 | $1,404 |
| #3 | 2 | 1.5 | $1,404 |
| #4 | 2 | 1.5 | $1,404 |
| Total (4 units) | $5,616 | ||
UW: 25.0% down · 7.5% · 30yr · 1.5% tax · 5.0% vac · 8.0% maint · 8.0% mgmt
Financing live
Cash to close
- Down payment
- $77,500
- Closing costs
- $9,300
- Reserves months
- —
- Total cash needed
- —
Loan-product check · same deal, 3 products live
Conventional
25% down · 7.5% · 30yr
- Down + closing
- —
- Monthly P&I
- —
- Monthly cashflow
- —
- DSCR
- —
- Eligible?
- —
Personal DTI + credit; lowest rate.
DSCR
20% down · 8.5% · 30yr
- Down + closing
- —
- Monthly P&I
- —
- Monthly cashflow
- —
- DSCR
- —
- Eligible?
- —
No personal income docs; deal must DSCR.
Hard money
10% down · 12.0% · 12mo
- Down + closing
- —
- Monthly P&I
- —
- Monthly cashflow
- —
- DSCR
- —
- Eligible?
- —
Short-term bridge; refi at stabilization.
Listing history 18 events
-
2026-06-21days on market $310,000 Active 26 DOM
-
2026-06-18days on market $310,000 Active 23 DOM
-
2026-06-17days on market $310,000 Active 22 DOM
-
2026-06-16days on market $310,000 Active 21 DOM
-
2026-06-15days on market $310,000 Active 20 DOM
-
2026-06-13days on market $310,000 Active 18 DOM
-
2026-06-10days on market $310,000 Active 15 DOM
-
2026-06-09days on market $310,000 Active 14 DOM
-
2026-06-08days on market $310,000 Active 13 DOM
-
2026-06-07days on market $310,000 Active 12 DOM
-
2026-06-05days on market $310,000 Active 9 DOM
-
2026-06-03days on market $310,000 Active 8 DOM
-
2026-06-02days on market $310,000 Active 7 DOM
-
2026-06-01days on market $310,000 Active 6 DOM
-
2026-05-31days on market $310,000 Active 5 DOM
-
2026-05-26$310,000 Active
Show marketing remark (154 chars)
Solid 4-plex rental property located just minutes from the Crowder Road I-10 ramps. Mostly all brick construction with all utilities on individual meters.
-
2026-05-26$310,000 Active 154-char remark
Show marketing remark (154 chars)
Solid 4-plex rental property located just minutes from the Crowder Road I-10 ramps. Mostly all brick construction with all utilities on individual meters.
-
1979-05-03soldstatus $151,800
ⓘ Source: listings_history table (triggers on properties + properties_extension) + one-shot
backfill from property_details.listing_events for pre-trigger history.
Tax reassessment forecast LA · Resets to sale price
- Current annual tax
- $2,060 · $172/mo
- Projected year-2 tax
- $2,060 · $172/mo
- Expected delta
- $0/yr ($0/mo · 0.0%)
ⓘ Screening estimate from a state-policy table — verify with the county assessor before closing.
Climate risk First Street
- Flood 8/10 Severe FEMA zone X (shaded) · 60% chance over 30 yrs
- Wildfire 1/10 Low
- Heat 10/10 Extreme 7 d/yr ≥107°F today · 21 d/yr by 30 yrs out
- Wind 10/10 Extreme 99% chance of damaging wind over 30 yrs
- Air quality 3/10 Moderate 3 unhealthy d/yr today · 3 by 30 yrs out
Nearby sold comps map
Loading sold comps map…
Walkable amenities ~0.75 mi
Loading nearby amenities…
Taxation est. · year 1
- Rental income
- $67,392
- − Mortgage interest
- −$17,365
- − Property taxes
- −$2,060
- − Insurance
- −$2,348
- − Repairs & maintenance
- −$5,391
- − Management
- −$5,391
- − Depreciation
- −$9,018
- Taxable income
- $25,819
- Est. tax owed @ 24.0%
- −$6,197
- After-tax cash flow
- $23,128/yr
For passive investors: Depreciation is non-cash, so a rental often shows a tax loss while cash-flowing — sheltering income. Rental losses are passive: they offset passive income freely, and up to $25,000/yr can offset ordinary (W-2) income if you actively participate and your MAGI is under $100k (phasing out to $0 by $150k); unused losses carry forward. On sale, claimed depreciation is recaptured at up to 25%, and gains may owe capital-gains tax (a 1031 exchange can defer both). Figures are a year-1 estimate at your 24.0% rate — not tax advice; consult a CPA.
Schools (NCES district)
- District
- Orleans Parish
- NCES district ID
- 2201170
- Math proficiency
- 11% ▼ -52.00%
- Reading proficiency
- 27% ▼ -46.00%
- Median HH income
- $37,011
- Composite
- 15.78/100
- National rank
- #9271
- State rank
- #69 of 98 in LA
Livability — New Orleans
- Score
- 81/100
- State rank
- #3
- US rank
- #1383
Category grades
Schools grade is shown separately in the Schools card above.
Census & demographics
- Census place
- New Orleans, LA
- County
- Orleans Parish · 338,817 people
- City population
- 338,817
- Metro
- New Orleans-Metairie, LA
- Population (ZIP)
- 27,047
- Household income
- $41,709
- Rent vs Own
- Severe rent burden
- 1767.0
Population outlook (Orleans County) Hauer SSP2
- Today (2025)
- 513,025 people
- By 2030
- 575,781 · +12.2%
- By 2040
- 700,174 · +36.5%
- By 2050
- 826,541 · +61.1%
- By 2075
- 1,123,374 · +119.0%
- By 2100
- 1,355,609 · +164.2%
Race, ethnicity, and origin ACS 2023
- Neighborhood character
- Predominantly Black (85%)
- Race & ethnicity
- Black 85% Hispanic / Latino 6% Two or more races 5% White 5%
- Hispanic origin (detail)
- Common ancestry
- Lithuanian 1% Italian 1%
- Foreign-born
- 4% · Canada, Vietnam
- Languages at home
- 94% English-only · Spanish 5% Other Indo-European 1%
Political lean MEDSL · Orleans
- 2024 margin
- Solid D (+67.0) · D 82.2% · R 15.2% · Other 2.7%
- 2008→2024 swing
- +6.7pp toward D · 2008: 60.3pp · 2024: 67.0pp
- All cycles
- 2024: D+67.0 2020: D+68.2 2016: D+66.2 2012: D+62.5 2008: D+60.3
Not yet ingested
- Civics
- —
Market trends
- HPI YoY
- ▼ -36.35%
- Current HPI
- 177.355
- Rent YoY
- ▼ -0.24%
- Metro
- New Orleans-Metairie, LA
- State GDP YoY
- ▲ 3.29%
- F500 in state
- 10
Industry mix (Fortune 500 HQ in LA)
| Industry | F500 HQs | Revenue |
|---|---|---|
| Telecommunications | 2 | $23B |
|
||
| Utilities | 1 | $12B |
|
||
| Wholesale / Distribution | 1 | $5B |
|
||
| Advertising | 1 | $2B |
|
||
Price history
+104.2% since first listed3 events — show timeline
- 2026-05-26 Listed $310,000 AcadianaMLS
- 2026-05-26 Listed $310,000 GSREIN
- 1979-05-03 Sold (Public Records) $151,800 Public Records
Property tax history
-0.7%/yrLatest (2026): $2,060 · +1.1% YoY. Source: county tax records.
Cash-flow waterfall
monthlySold comps — $/sqft
last 12 mo · ≤1 miLoading sold comps…