 7-Plex
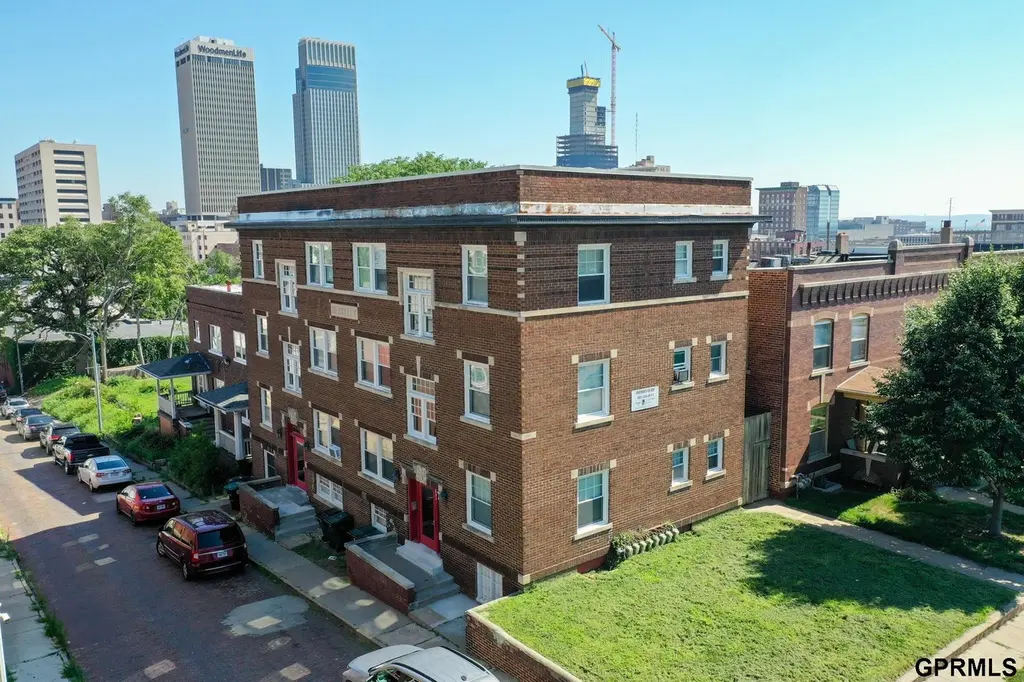
649 S 19th Ave · Omaha, NE
Flood risk No data
- FEMA flood zone
- —
- Chance of flooding over 30 yrs
- —
- Est. flood insurance / yr
- —
Fire risk No data
- Est. fire insurance / yr
- —
Heat risk No data
- Hot days now (above threshold)
- —
- Hot days in 30 yrs
- —
Wind risk No data
- Chance of severe wind over 30 yrs
- —
Air-quality risk No data
- Unhealthy air days now
- —
- Unhealthy air days in 30 yrs
- —
Risk factors via First Street. Map © Google.
Why this score? — see what drove the B grade
The composite is a weighted blend of 9 inputs, each scored 0–100. Each bar is that input's sub-score; the figure is the points it added to the 100-point composite (weight × sub-score).
- Cash flow +30.0/30.0
- DSCR +10.0/10.0
- 1% rule +8.9/10.0
- ARV discount +7.5/15.0
- Appreciation +5.0/10.0
- Livability +4.2/5.0
- Rent growth +2.8/5.0
- Condition / age +2.5/5.0
- Schools +2.1/10.0
$620,000
🖨 Deal sheet 📄 Offer letter ✓ Due diligence
Multi-family units
County records classify this as Multi-Family (5+ Unit). Listing-text estimate: 7 units. confirmed
5+ unit building — per-unit beds/baths from public records are typically unavailable; the breakdown below (if shown) is an estimate from the listing text.
Listing remarks MLS
Great Investment opportunity 7-plex in downtown Omaha. Current cap rate of 6%. Each unit is 2 Bed/1 bath and most units have been updated. All metered separate. Washer and dryer room for tenants.
Key facts
- Updated units
- Historic charm
- Three story property
Tags
Property features AI
Finance
- Financial info: Property is residential income with seven rental units (leased/tenant-occupied)
Exterior
- Parking: No garage
- Utilities: Public water; Public sewer; Seven electric meters; Seven gas meters
- Home design: Residential income property (multi-family); Three or more levels; Lot included in price
- Construction: Built in 1918; Block foundation
- Exterior features: Porch; Enclosed porch; Patio; Deck; Wood fencing; Corner lot
Interior
- Kitchen: Range; Refrigerator
- Bedrooms: Seven units (multi-unit property)
- Bathrooms: Seven bathrooms total
- Heating & cooling: Natural gas heating with forced air; Additional other fuel heating; Central air; Window air conditioning units; Seven furnaces; Six air conditioning units
- Interior features: Laundry facilities available; Range; Refrigerator
- Laundry & utility: Shared laundry facilities
Neighborhood map
What this means for you Summary
Snapshot
- This is a 7 × 2-bed/1.0-bath units multifamily listed at $620k.
Deal economics
- At list price, monthly cash flow is $3k ($30k/yr) — positive. Per door: $360/mo.
- The deal already cash-flows at list — no discount required.
- Meets the 1% rule at list price ($9k rent vs $620k).
- Recommended offer: $611k (1.5% below list) — sets the bar for market timing.
- Cap rate 11.2% vs local median 3.6% in Omaha — top-decile yield for the area; either an underpriced asset or a hidden risk that comps aren't pricing in. Stress-test before assuming the spread holds.
Location & tenants
- Location reads 84/100 on livability (#7 in NE, #663 nationally) — a professional / high-income tenant draw. Strengths: amenities A+, commute A+, cost of living A+; Watch: crime F.
- Omaha Public Schools (urban): math 20% / reading 28% proficiency, ranked #110 of 111 in NE (top 99%) — low school quality limits family demand, transient renter base, plan for 1-2y turnover; 62% free/reduced lunch — lower-income household profile, screen leases tightly.
- Zoned schools: Liberty Elementary School (math 10% / reading 15%, grade F, #487 of 502 statewide, top 97%, 626 students, 0% FRL); Norris Middle School (math 11% / reading 16%, grade F, #126 of 128 statewide, top 98%, 1,187 students, 0% FRL); Central High School (math 29% / reading 40%, grade F, #208 of 261 statewide, top 86%, 2,738 students, 0% FRL) — zoned schools average 0% FRL vs 62% district-wide (62 pts lower); this property's tenant base skews higher-income than the district average.
- Market conditions: Rents rising (+1.2%/yr); 34 active listings in the ZIP; 4,539 units permitted in Douglas County in 2024 (2,583 in 5+ unit buildings).
- At $8,614/mo this rent would consume 161% of the median local household income ($64k/yr) (locally 880% of renters already pay >50% of income on rent) — very limited rent-growth headroom before tenants either downsize or default.
Forward outlook
- In year one you build about $4k of equity ($4k loan paydown + $-588 appreciation (-0.1% local appreciation)).
- Douglas County population projected at +28% by 2050 — long-run rental-demand tailwind backs the buy-and-hold thesis.
- At projected returns (-0.1% appreciation + 1.2% rent growth), your $174k cash investment doubles in ~5 years — after that, you're playing with house money.
- By year 7, paydown + projected appreciation supports a ~$35k cash-out refi (75% LTV) — recoverable capital for the next deal without selling this one.
Negotiation context
- It's been on market 17 days — a 2% lower offer ($611k) is reasonable based on typical stale-listing flexibility.
- 6 sale attempts since 19y ago with the ask held roughly flat each time — persistent listings suggest the price (not the market) is what's stuck; bring a comps-based counter.
Risks & watch-outs
- Watch-outs: built in 1918 — expect roof / HVAC / electrical / plumbing capex.
Questions for the listing agent
- Can we see the unit-by-unit rent roll, current vacancy, and any below-market leases? What's the average tenancy length?
- What capital expenditures (roof, boiler, parking lot, exteriors) have been made in the last 5 years, and what's planned in the next 2?
- Built in 1918 — when were the roof, HVAC, electrical panel, plumbing, and water heater last replaced?
- Is there a deadline driving the sale (1031 exchange, divorce, estate, relocation)? That informs how much negotiation room exists.
- Crime grade is F in this area — have there been break-ins, vandalism, or insurance claims at this property in the last 3 years? What carrier currently insures it and at what premium?
- What's the average days-on-market for RENTAL listings here right now (not sales)? A rising rental-DOM trend means longer vacancies and softer asking-rent achievability than the comps imply.
- What's the recent tenant-quality profile in this submarket — average credit score on applications, eviction rate, late-payment / NSF rate, and stable-employment percentage? A property-management company in the area should have these aggregated.
- How much new apartment / multifamily construction is in the pipeline within 1–3 miles? Heavy new supply (>2% of stock underway) typically softens rents 12–24 months out; light construction supports rent growth.
Investment metrics
- 1% rule
- 1.39% ✓
- Cap rate
- 11.17%
- Cash-on-cash
- 17.42%
- DSCR
- 1.78
- GRM
- 6.0
CMA / ARV
No comps found within radius.
Projected returns pro-forma
-0.09% appreciation · 1.23% rent growth · sell at horizon
- IRR
- 15.3%
- Equity multiple
- 1.72×
- Total profit
- $124,682
- Equity at exit
- $177,093
- IRR
- 18.7%
- Equity multiple
- 2.93×
- Total profit
- $334,334
- Equity at exit
- $210,545
Cash invested: $173,600 (down + closing). Projections, not guarantees.
Landlord ↔ Tenant lean methodology
- Overall (STATE)
- 83 Strongly Landlord-Friendly
- State Nebraska
- 83 Strongly Landlord-Friendly · R+13
- County
- — inherits STATE
- City
- — inherits STATE
ZIP-level market 68102
- Home prices YoY
- -0.1%
- Rents YoY
- 1.2%
- Active inventory
- 34
- Price-to-rent
- 42.0×
Monthly cashflow live
- Estimated rent
- $8,614 high interval (Pro) →
- Mortgage (P&I)
- −$3,251
- Tax est. 1.5%
- −$775 /mo · $9,300/yr
- Insurance
- −$258
- HOA
- −$0
- Vacancy / Maint / Mgmt
- −$1,809
- Net cashflow
- $2,520
Break-even live
7-unit breakdown (identical units grouped — click to expand)
| Units | Beds | Baths | Est. rent |
|---|---|---|---|
| 7× units | 2 | 1 | $8,617 |
| #1 | 2 | 1 | $1,231 |
| #2 | 2 | 1 | $1,231 |
| #3 | 2 | 1 | $1,231 |
| #4 | 2 | 1 | $1,231 |
| #5 | 2 | 1 | $1,231 |
| #6 | 2 | 1 | $1,231 |
| #7 | 2 | 1 | $1,231 |
| Total (7 units) | $8,614 | ||
UW: 25.0% down · 7.5% · 30yr · 1.5% tax · 5.0% vac · 8.0% maint · 8.0% mgmt
Financing live
Cash to close
- Down payment
- $155,000
- Closing costs
- $18,600
- Reserves months
- —
- Total cash needed
- —
Loan-product check · same deal, 3 products live
Conventional
25% down · 7.5% · 30yr
- Down + closing
- —
- Monthly P&I
- —
- Monthly cashflow
- —
- DSCR
- —
- Eligible?
- —
Personal DTI + credit; lowest rate.
DSCR
20% down · 8.5% · 30yr
- Down + closing
- —
- Monthly P&I
- —
- Monthly cashflow
- —
- DSCR
- —
- Eligible?
- —
No personal income docs; deal must DSCR.
Hard money
10% down · 12.0% · 12mo
- Down + closing
- —
- Monthly P&I
- —
- Monthly cashflow
- —
- DSCR
- —
- Eligible?
- —
Short-term bridge; refi at stabilization.
Listing history 12 events
-
2026-06-18days on market $620,000 Active 17 DOM
-
2026-06-17days on market $620,000 Active 16 DOM
-
2026-06-16days on market $620,000 Active 15 DOM
-
2026-06-15days on market $620,000 Active 14 DOM
-
2026-06-13pricedays on market $620,000 Active 12 DOM
-
2026-06-10days on market $650,000 Active 9 DOM
-
2026-06-09days on market $650,000 Active 8 DOM
-
2026-06-08days on market $650,000 Active 7 DOM
-
2026-06-07statusdays on market $650,000 Active 6 DOM
-
2026-06-03days on market $650,000 New 2 DOM
-
2026-06-02remarks 444-char remark
-
2026-06-02$650,000 New 1 DOM
ⓘ Source: listings_history table (triggers on properties + properties_extension) + one-shot
backfill from property_details.listing_events for pre-trigger history.
Nearby sold comps map
Loading sold comps map…
Walkable amenities ~0.75 mi
Loading nearby amenities…
Taxation est. · year 1
- Rental income
- $103,368
- − Mortgage interest
- −$34,730
- − Property taxes
- −$9,300
- − Insurance
- −$3,100
- − Repairs & maintenance
- −$8,269
- − Management
- −$8,269
- − Depreciation
- −$18,036
- Taxable income
- $21,663
- Est. tax owed @ 24.0%
- −$5,199
- After-tax cash flow
- $25,045/yr
For passive investors: Depreciation is non-cash, so a rental often shows a tax loss while cash-flowing — sheltering income. Rental losses are passive: they offset passive income freely, and up to $25,000/yr can offset ordinary (W-2) income if you actively participate and your MAGI is under $100k (phasing out to $0 by $150k); unused losses carry forward. On sale, claimed depreciation is recaptured at up to 25%, and gains may owe capital-gains tax (a 1031 exchange can defer both). Figures are a year-1 estimate at your 24.0% rate — not tax advice; consult a CPA.
Schools (NCES district)
- District
- Omaha Public Schools
- NCES district ID
- 3174820
- Math proficiency
- 20% ▼ -10.00%
- Reading proficiency
- 28% ▼ -5.00%
- Median HH income
- $46,039
- Composite
- 20.83/100
- National rank
- #8502
- State rank
- #110 of 111 in NE
Livability — Omaha
- Score
- 84/100
- State rank
- #7
- US rank
- #663
Category grades
Schools grade is shown separately in the Schools card above.
Census & demographics
- Census place
- Omaha, NE
- County
- Douglas County · 538,646 people
- City population
- 552,986
- Metro
- Omaha-Council Bluffs, NE-IA
- Population (ZIP)
- 9,767
- Household income
- $64,111
- Rent vs Own
- Severe rent burden
- 880.0
Population outlook (Douglas County) Hauer SSP2
- Today (2025)
- 625,245 people
- By 2030
- 661,613 · +5.8%
- By 2040
- 732,395 · +17.1%
- By 2050
- 801,988 · +28.3%
- By 2075
- 968,637 · +54.9%
- By 2100
- 1,101,871 · +76.2%
Race, ethnicity, and origin ACS 2023
- Neighborhood character
- Predominantly White (67%)
- Race & ethnicity
- White 67% Black 15% Hispanic / Latino 9% Two or more races 8% Asian 3% Native American 2%
- Hispanic origin (detail)
- Mexican 6%
- Common ancestry
- Iranian 4% Romanian 3% Lithuanian 2%
- Foreign-born
- 8% · Canada, Vietnam
- Languages at home
- 89% English-only · Spanish 5% Other Indo-European 1% Russian/Polish/Slavic 1%
Political lean MEDSL · Douglas
- 2024 margin
- D (+10.2) · D 54.4% · R 44.2% · Other 1.4%
- 2008→2024 swing
- +5.5pp toward D · 2008: 4.6pp · 2024: 10.2pp
- All cycles
- 2024: D+10.2 2020: D+11.3 2016: D+1.4 2012: R+4.3 2008: D+4.6
Not yet ingested
- Civics
- —
Market trends
- HPI YoY
- ▼ -0.09%
- Current HPI
- 148.3676
- Rent YoY
- ▲ 1.23%
- Metro
- Omaha-Council Bluffs, NE-IA
- State GDP YoY
- ▲ 0.68%
- F500 in state
- 2
Industry mix (Fortune 500 HQ in NE)
| Industry | F500 HQs | Revenue |
|---|---|---|
| Conglomerate | 1 | $371B |
|
||
Price history
+196.8% since first listed20 events — show timeline
- 2026-06-01 Listed $650,000 GPRMLS
- 2026-04-21 Listing Removed — GPRMLS
- 2026-03-17 Price Changed $630,000 GPRMLS
- 2026-01-05 Price Changed $660,000 GPRMLS
- 2025-11-12 Price Changed $665,000 GPRMLS
- 2025-10-23 Price Changed $675,000 GPRMLS
- 2025-09-26 Price Changed $695,000 GPRMLS
- 2025-08-18 Price Changed $717,000 GPRMLS
- 2025-07-21 Listed $735,000 GPRMLS
- 2022-05-31 Sold (MLS) $575,000 GPRMLS
- 2022-05-02 Pending — GPRMLS
- 2022-04-14 Price Changed $636,000 GPRMLS
- 2022-03-24 Relisted — GPRMLS
- 2022-03-21 Pending — GPRMLS
- 2022-02-11 Listed $686,000 GPRMLS
- 2021-10-08 Listing Removed — GPRMLS
- 2021-07-09 Listed $756,000 GPRMLS
- 2008-02-15 Sold (MLS) $210,000 GPRMLS
- 2007-11-19 Listing Removed — GPRMLS
- 2007-10-19 Listed $219,000 GPRMLS
Cash-flow waterfall
monthlySold comps — $/sqft
last 12 mo · ≤1 miLoading sold comps…