 Triplex
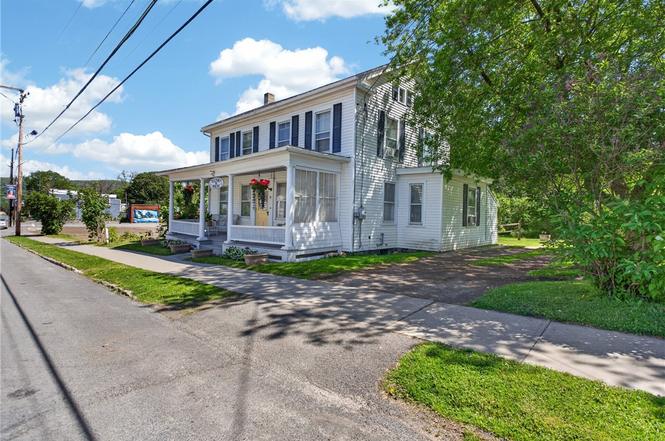
88 W Main St Unit 1-3 · Milford, NY
Flood risk 1/10 · Minimal
- FEMA flood zone
- X (unshaded)
- Chance of flooding over 30 yrs
- 0.0%
- Est. flood insurance / yr
- $473 – $860
Fire risk 1/10 · Minimal
- Est. fire insurance / yr
- $691 – $1,283
Heat risk 2/10 · Minimal
- Hot days now (above 92°F)
- 7 days/yr
- Hot days in 30 yrs
- 18 days/yr
Wind risk 2/10 · Minimal
- Chance of severe wind over 30 yrs
- 1.0%
Air-quality risk 1/10 · Minimal
- Unhealthy air days now
- 0 days/yr
- Unhealthy air days in 30 yrs
- 0 days/yr
Risk factors via First Street. Map © Google.
Why this score? — see what drove the A- grade
The composite is a weighted blend of 9 inputs, each scored 0–100. Each bar is that input's sub-score; the figure is the points it added to the 100-point composite (weight × sub-score).
- Cash flow +30.0/30.0
- 1% rule +10.0/10.0
- DSCR +10.0/10.0
- Appreciation +8.9/10.0
- ARV discount +7.5/15.0
- Schools +4.3/10.0
- Condition / age +3.8/5.0
- Livability +3.2/5.0
- Rent growth +2.5/5.0
$299,900
🖨 Deal sheet 📄 Offer letter ✓ Due diligence
Multi-family units
County records classify this as Multi-Family (2-4 Unit). Listing-text estimate: 3 units. confirmed
Listing remarks
Well-maintained Village of Milford triplex offering a fantastic opportunity for investors or owner-occupants. This property features three residential units, including a spacious 3-bedroom, 2-bath apartment, a 2-bedroom, 1-bath apartment, and a 1-bedroom, 1-bath apartment, offering flexibility for a variety of living arrangements and rental needs. The current owners have made numerous improvements over the years while continuing to carefully maintain the property, allowing the next owner to step right in. Offering over 3,000 square feet of living space, the property includes off-street parking, storage space, outdoor living areas, a designated laundry area, a welcoming front porch, and a sp
Key facts
- 9,583 sq ft lot
- Garage
- Built 1876
Property features AI
Finance
- Financial info: Three total units; Gross income reported at $50,696; Operating expenses reported at $16,660; Operating expenses include advertising, electric, fuel, insurance, licenses, maintenance (structure), professional management, rent, snow removal, utilities, and water/sewer; Owner pays all utilities (rent includes all utilities)
Exterior
- Parking: Garage; Gravel parking; Two or more parking spaces; 1 garage space
- Utilities: Electricity available with circuit breakers; High-speed internet available; Public water connected; Septic tank sewer
- Home design: Two-story building; Existing (established) construction
- Construction: Vinyl siding; Shingle roof; Stone foundation; Resale condition
- Exterior features: Barbecue area; Partial fencing; Fence
Interior
- Flooring: Carpet; Hardwood; Vinyl; Varies
- Bathrooms: Four full bathrooms
- Heating & cooling: Has heating; Oil heating; Baseboard heating; Forced air; Hot water
- Interior features: Varied flooring including carpet, hardwood and vinyl; Full dirt-floor basement
- Laundry & utility: Common area laundry; Electric water heater
Neighborhood map
What this means for you Summary
Snapshot
- This is a 2×2bd/1.3ba + 1×1bd/1.3ba units multifamily listed at $300k. Condition is rated good.
Deal economics
- At list price, monthly cash flow is $2k ($25k/yr) — positive. Per door: $704/mo.
- The deal already cash-flows at list — no discount required.
- Meets the 1% rule at list price ($5k rent vs $300k).
Location & tenants
- Location reads 65/100 on livability (#691 in NY) — a middle-class / working-renter tenant base. Strengths: cost of living A+, housing A-; Watch: schools C-, health & safety C-, commute D.
- Milford Central School District (rural): math 55% / reading 40% proficiency, ranked #507 of 755 in NY (top 67%) — families likely to look elsewhere, expect single-tenant / working-renter base with shorter leases.
- Market conditions: 12 active listings in the ZIP; 133 units permitted in Otsego County in 2024 (10 in 5+ unit buildings).
Forward outlook
- In year one you build about $25k of equity ($2k loan paydown + $23k appreciation (7.8% local appreciation)).
- Otsego County population projected at -21% by 2050 — secular population decline; favor cash flow + early exit over multi-decade hold.
- At projected returns (7.8% appreciation + 3.0% rent growth), your $84k cash investment doubles in ~2 years — after that, you're playing with house money.
- By year 2, paydown + projected appreciation supports a ~$41k cash-out refi (75% LTV) — recoverable capital for the next deal without selling this one.
Negotiation context
- Only 5 days on market — expect competitive offers; lowballing is unlikely to land.
Risks & watch-outs
- Watch-outs: built in 1876 — expect roof / HVAC / electrical / plumbing capex.
Questions for the listing agent
- Can we see the unit-by-unit rent roll, current vacancy, and any below-market leases? What's the average tenancy length?
- What capital expenditures (roof, boiler, parking lot, exteriors) have been made in the last 5 years, and what's planned in the next 2?
- Built in 1876 — when were the roof, HVAC, electrical panel, plumbing, and water heater last replaced?
- Is there a deadline driving the sale (1031 exchange, divorce, estate, relocation)? That informs how much negotiation room exists.
- Crime grade is F in this area — have there been break-ins, vandalism, or insurance claims at this property in the last 3 years? What carrier currently insures it and at what premium?
- What's the average days-on-market for RENTAL listings here right now (not sales)? A rising rental-DOM trend means longer vacancies and softer asking-rent achievability than the comps imply.
- What's the recent tenant-quality profile in this submarket — average credit score on applications, eviction rate, late-payment / NSF rate, and stable-employment percentage? A property-management company in the area should have these aggregated.
- How much new apartment / multifamily construction is in the pipeline within 1–3 miles? Heavy new supply (>2% of stock underway) typically softens rents 12–24 months out; light construction supports rent growth.
Investment metrics
- 1% rule
- 1.77% ✓
- Cap rate
- 14.74%
- Cash-on-cash
- 30.16%
- DSCR
- 2.34
- GRM
- 4.7
CMA / ARV
No comps found within radius.
Projected returns pro-forma
7.78% appreciation · 3.0% rent growth · sell at horizon
- IRR
- 43.8%
- Equity multiple
- 4.02×
- Total profit
- $253,747
- Equity at exit
- $223,274
- IRR
- 39.4%
- Equity multiple
- 8.58×
- Total profit
- $636,415
- Equity at exit
- $438,910
Cash invested: $83,972 (down + closing). Projections, not guarantees.
Landlord ↔ Tenant lean methodology
- Overall (STATE)
- 15 Strongly Tenant-Friendly
- State New York
- 15 Strongly Tenant-Friendly · D+10
- County
- — inherits STATE
- City
- — inherits STATE
ZIP-level market 13807
- Home prices YoY
- 1.9%
- Active inventory
- 12
- Price-to-rent
- 13.9×
Monthly cashflow live
- Estimated rent
- $5,295 medium interval (Pro) →
- Mortgage (P&I)
- −$1,573
- Tax est. 1.5%
- −$375 /mo · $4,498/yr
- Insurance
- −$125
- HOA
- −$0
- Vacancy / Maint / Mgmt
- −$1,112
- Net cashflow
- $2,111
Break-even live
3-unit breakdown (identical units grouped — click to expand)
| Units | Beds | Baths | Est. rent |
|---|---|---|---|
| 2× units | 2 | 1.3 | $3,600 |
| #1 | 2 | 1.3 | $1,800 |
| #2 | 2 | 1.3 | $1,800 |
| 1× unit | 1 | 1.3 | $1,695 |
| Total (3 units) | $5,295 | ||
UW: 25.0% down · 7.5% · 30yr · 1.5% tax · 5.0% vac · 8.0% maint · 8.0% mgmt
Financing live
Cash to close
- Down payment
- $74,975
- Closing costs
- $8,997
- Reserves months
- —
- Total cash needed
- —
Loan-product check · same deal, 3 products live
Conventional
25% down · 7.5% · 30yr
- Down + closing
- —
- Monthly P&I
- —
- Monthly cashflow
- —
- DSCR
- —
- Eligible?
- —
Personal DTI + credit; lowest rate.
DSCR
20% down · 8.5% · 30yr
- Down + closing
- —
- Monthly P&I
- —
- Monthly cashflow
- —
- DSCR
- —
- Eligible?
- —
No personal income docs; deal must DSCR.
Hard money
10% down · 12.0% · 12mo
- Down + closing
- —
- Monthly P&I
- —
- Monthly cashflow
- —
- DSCR
- —
- Eligible?
- —
Short-term bridge; refi at stabilization.
Listing history 7 events
-
2026-06-19days on market $299,900 Active 5 DOM
-
2026-06-18days on market $299,900 Active 4 DOM
-
2026-06-17days on market $299,900 Active 3 DOM
-
2026-06-16days on market $299,900 Active 2 DOM
-
2026-06-16remarks 699-char remark
-
2026-06-15remarks 24-char remark
-
2026-06-15$299,900 Active 1 DOM
ⓘ Source: listings_history table (triggers on properties + properties_extension) + one-shot
backfill from property_details.listing_events for pre-trigger history.
Climate risk First Street
- Flood 1/10 Low FEMA zone X (unshaded) · 0% chance over 30 yrs
- Wildfire 1/10 Low
- Heat 2/10 Low 7 d/yr ≥92°F today · 18 d/yr by 30 yrs out
- Wind 2/10 Low 100% chance of damaging wind over 30 yrs
- Air quality 1/10 Low 0 unhealthy d/yr today · 0 by 30 yrs out
Nearby sold comps map
Loading sold comps map…
Walkable amenities ~0.75 mi
Loading nearby amenities…
Taxation est. · year 1
- Rental income
- $63,540
- − Mortgage interest
- −$16,799
- − Property taxes
- −$4,498
- − Insurance
- −$1,500
- − Repairs & maintenance
- −$5,083
- − Management
- −$5,083
- − Depreciation
- −$8,724
- Taxable income
- $21,852
- Est. tax owed @ 24.0%
- −$5,245
- After-tax cash flow
- $20,082/yr
For passive investors: Depreciation is non-cash, so a rental often shows a tax loss while cash-flowing — sheltering income. Rental losses are passive: they offset passive income freely, and up to $25,000/yr can offset ordinary (W-2) income if you actively participate and your MAGI is under $100k (phasing out to $0 by $150k); unused losses carry forward. On sale, claimed depreciation is recaptured at up to 25%, and gains may owe capital-gains tax (a 1031 exchange can defer both). Figures are a year-1 estimate at your 24.0% rate — not tax advice; consult a CPA.
Condition & rehab AI · 12 photos
This well-maintained triplex in Milford offers a great opportunity for investors or owner-occupants. With minor repairs and updates, it can be transformed into a move-in-ready property with significant value appreciation potential.
Repairs flagged
- Minor kitchen countertops — Worn appearance
- Minor bathroom fixtures — Dated appearance
- Minor kitchen cabinets — Worn appearance
Value-add opportunities
- Resale Paint interior walls — Fresh paint can make a significant difference in the home's appearance.
- Resale Replace kitchen countertops — New countertops can improve the home's functionality and aesthetic.
- Resale Update bathroom fixtures — Modern fixtures can enhance the home's appeal and functionality.
- Both Landscaping improvements — Enhanced landscaping can improve curb appeal and add value to the property.
Renovation cost estimate screening
| Repair item | Severity | Est. cost |
|---|---|---|
| kitchen countertops · Worn appearance | Minor | $500–3,000 |
| bathroom fixtures · Dated appearance | Minor | $500–3,000 |
| kitchen cabinets · Worn appearance | Minor | $500–3,000 |
| Total estimated repair cost · 3 items | $1,500–9,000 |
Value-add ROI direction
- Resale Paint interior walls — Fresh paint can make a significant difference in the home's appearance. ↑
- Resale Replace kitchen countertops — New countertops can improve the home's functionality and aesthetic. ↑
- Resale Update bathroom fixtures — Modern fixtures can enhance the home's appeal and functionality. ↑
- Both Landscaping improvements — Enhanced landscaping can improve curb appeal and add value to the property. ↑
ⓘ Cost ranges are severity-bucket heuristics (US national rule-of-thumb). Get contractor quotes + a written scope before underwriting a rehab budget.
Schools (NCES district)
- District
- Milford Central School District
- NCES district ID
- 3619350
- Math proficiency
- 55% ▲ 5.00%
- Reading proficiency
- 40% ▬ 0.00%
- Median HH income
- $49,927
- Composite
- 42.86/100
- National rank
- #6725
- State rank
- #507 of 755 in NY
Livability — Milford
- Score
- 65/100
- State rank
- #691
- US rank
- #13074
Category grades
Schools grade is shown separately in the Schools card above.
Census & demographics
- Census place
- Milford, NY
- Population (ZIP)
- 1,260
Population outlook (Otsego County) Hauer SSP2
- Today (2025)
- 57,987 people
- By 2030
- 55,403 · -4.5%
- By 2040
- 50,336 · -13.2%
- By 2050
- 45,715 · -21.2%
- By 2075
- 38,769 · -33.1%
- By 2100
- 33,468 · -42.3%
Race, ethnicity, and origin ACS 2023
- Neighborhood character
- Predominantly White (91%)
- Race & ethnicity
- White 91% Asian 5% Hispanic / Latino 4% Two or more races 2%
- Common ancestry
- Lithuanian 11% Romanian 8% Iranian 5%
- Foreign-born
- 6% · Canada
- Languages at home
- 92% English-only · Tagalog/Filipino 3% Spanish 2% Other Asian/Pacific 1%
Political lean MEDSL · Otsego
- 2024 margin
- Lean R (+7.9) · D 46.1% · R 53.9%
- 2008→2024 swing
- -13.8pp toward R · 2008: 5.9pp · 2024: -7.9pp
- All cycles
- 2024: R+7.9 2020: R+5.0 2016: R+13.0 2012: D+2.0 2008: D+5.9
Not yet ingested
- Civics
- —
Market trends
- HPI YoY
- ▲ 7.78%
- Current HPI
- 421.1413
- Rent YoY
- —
- Metro
- —
- State GDP YoY
- ▲ 2.60%
- F500 in state
- 92
Industry mix (Fortune 500 HQ in NY)
| Industry | F500 HQs | Revenue |
|---|---|---|
| Financial Services | 10 | $950B |
|
||
| Consumer Goods | 9 | $162B |
|
||
| Insurance | 4 | $225B |
|
||
| Telecommunications | 2 | $144B |
|
||
| Pharmaceuticals | 2 | $112B |
|
||
| Media / Entertainment | 2 | $69B |
|
||
Price history
1 event — show timeline
- 2026-06-14 Listed $299,900 UNYREIS
Cash-flow waterfall
monthlySold comps — $/sqft
last 12 mo · ≤1 miLoading sold comps…