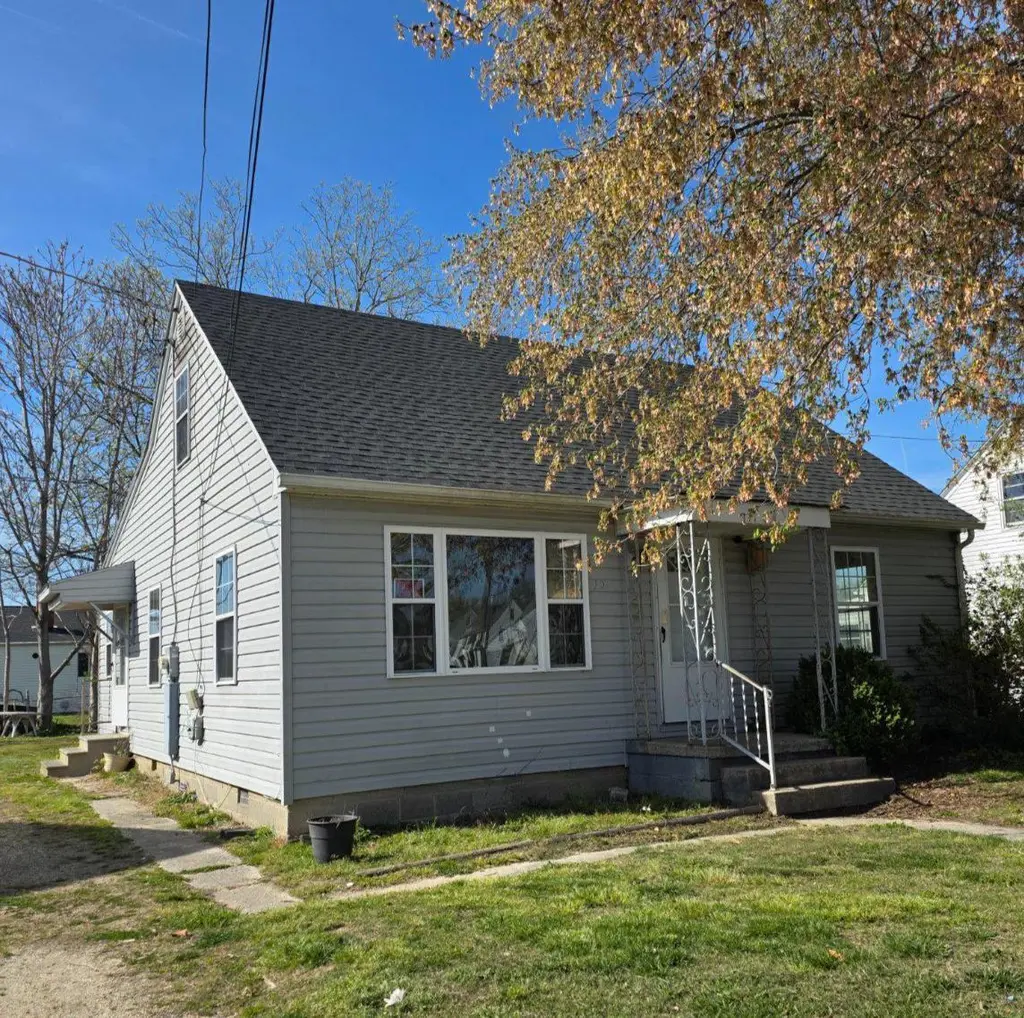
12 Somerset Ave · Pocomoke City, MD
Flood risk 5/10 · Moderate
- FEMA flood zone
- X (unshaded)
- Chance of flooding over 30 yrs
- 0.5%
- Est. flood insurance / yr
- $507 – $1,088
Fire risk 3/10 · Minor
- Est. fire insurance / yr
- $755 – $1,403
Heat risk 8/10 · Major
- Hot days now (above 102°F)
- 7 days/yr
- Hot days in 30 yrs
- 19 days/yr
Wind risk 8/10 · Major
- Chance of severe wind over 30 yrs
- 80.0%
Air-quality risk 2/10 · Minimal
- Unhealthy air days now
- 1 days/yr
- Unhealthy air days in 30 yrs
- 1 days/yr
Risk factors via First Street. Map © Google.
Why this score? — see what drove the C+ grade
The composite is a weighted blend of 9 inputs, each scored 0–100. Each bar is that input's sub-score; the figure is the points it added to the 100-point composite (weight × sub-score).
- Cash flow +23.7/30.0
- ARV discount +15.0/15.0
- DSCR +7.6/10.0
- 1% rule +6.6/10.0
- Livability +3.6/5.0
- Schools +3.3/10.0
- Rent growth +2.5/5.0
- Condition / age +2.5/5.0
- Appreciation +0.0/10.0
$159,000
🖨 Deal sheet 📄 Offer letter ✓ Due diligence
Listing remarks
Located just west of Route 113 and right off of Route 50 in Pocomoke City, this 1.5 story home offers a flexible layout in an established residential area close to shopping, dining and other amenities. The main level features a living room, kitchen, dining area, laundry space, one full bathroom as well as one stand alone bedroom and two adjoining bedrooms. Upstairs is a bonus space with two adjoining rooms that could serve as an additional bedroom, office space or storage. There is hardwood flooring throughout most of the home and vinyl flooring in the kitchen. The kitchen and bathroom are in need of updating/cosmetic repair. The interior has been freshly painted, the landscaping refreshed,
Key facts
- Hardwood flooring
- Flexible layout
- Bonus space
Tags
Property features AI
Finance
- Financial info: Lease not considered
Exterior
- Parking: Gravel driveway; Driveway parking; On-street parking
- Utilities: Public water; Public sewer; Propane available; Electric available; Phone available; Cable internet
- Home design: Detached property; Fee simple ownership; Estimated year built
- Construction: Stick-built construction; Block foundation; Above-grade and below-grade structures
- Exterior features: Sidewalks; Partially fenced yard; Rear yard; Shed
Interior
- Kitchen: Wall oven; Cooktop
- Bedrooms: 3 bedrooms on the main level
- Flooring: Hardwood; Partial carpeting; Vinyl
- Bathrooms: 1 full bathroom (main level)
- Heating & cooling: Forced-air heating (electric); Central air conditioning; Ceiling fans
- Interior features: Ceiling fans; Combination kitchen and dining area; Dining area; Traditional floor plan; Entry-level bedroom; Wood floors
- Laundry & utility: Washer; Dryer; Propane water heater
Neighborhood map
What this means for you Summary
Snapshot
- This is a 3-bed/1.0-bath single-family listed at $159k.
Deal economics
- At list price, monthly cash flow is $303 ($4k/yr) — positive.
- The deal already cash-flows at list — no discount required.
- Meets the 1% rule at list price ($2k rent vs $159k).
- Recommended offer: $154k (3.0% below list) — sets the bar for market timing.
- Cap rate 8.6% vs local median 5.6% in Pocomoke City — top-decile yield for the area; either an underpriced asset or a hidden risk that comps aren't pricing in. Stress-test before assuming the spread holds.
Location & tenants
- Location reads 71/100 on livability (#157 in MD) — a middle-class / working-renter tenant base. Strengths: cost of living A+, health & safety A+, housing A-; Watch: employment D+, crime F, amenities F.
- Worcester County Public Schools (town): math 30% / reading 44% proficiency, ranked #6 of 24 in MD (top 25%) — families likely to look elsewhere, expect single-tenant / working-renter base with shorter leases.
- Market conditions: 69 active listings in the ZIP; 7 comparable units currently listed for rent nearby; rentals leasing fast (median 13d on market — plan ~1-2 weeks tenant-placement turnaround); 354 units permitted in Worcester County in 2024 (6 in 5+ unit buildings).
Forward outlook
- Local home prices are declining (-3.0%/yr); year-one equity from $1k of loan paydown is wiped out by about $5k of value loss. Plan a longer hold.
- Worcester County population projected to shrink 4% by 2050 — rents likely to lag national; underwrite the cash flow, not the appreciation.
Negotiation context
- It's been on market 41 days — a 3% lower offer ($154k) is reasonable based on typical stale-listing flexibility.
- Current owner paid $63k; list at $159k implies a 152% gain — meaningful room to come down on a strong offer.
Risks & watch-outs
- Watch-outs: built in 1953 — expect roof / HVAC / electrical / plumbing capex.
- Climate carrying-cost: moderate flood risk; severe wind risk, 80% chance of damaging wind over 30y; extreme-heat days projected 7→19/yr by 2055 (HVAC capex compounding) — expect insurance premiums to compound above CPI over the hold.
Questions for the listing agent
- It's been on market 41 days. Have you received any prior offers? Is the seller open to a 3% concession, seller financing, or rate buy-down credit?
- Built in 1953 — when were the roof, HVAC, electrical panel, plumbing, and water heater last replaced?
- Is there a deadline driving the sale (1031 exchange, divorce, estate, relocation)? That informs how much negotiation room exists.
- Crime grade is F in this area — have there been break-ins, vandalism, or insurance claims at this property in the last 3 years? What carrier currently insures it and at what premium?
- What's the average days-on-market for RENTAL listings here right now (not sales)? A rising rental-DOM trend means longer vacancies and softer asking-rent achievability than the comps imply.
- What's the recent tenant-quality profile in this submarket — average credit score on applications, eviction rate, late-payment / NSF rate, and stable-employment percentage? A property-management company in the area should have these aggregated.
- How much new for-sale + rental construction is in the pipeline within 1–3 miles? Heavy new supply typically softens prices + rents 12–24 months out; constrained supply supports both.
Investment metrics
- 1% rule
- 1.16% ✓
- Cap rate
- 8.58%
- Cash-on-cash
- 8.18%
- DSCR
- 1.36
- GRM
- 7.2
CMA / ARV
- ARV (median comp)
- $203,904
- List price
- $159,000
- Delta
- -22.02%
- Verdict
- UNDERPRICED
- Comps
- 20 within 1.0 mi
Show comp detail 12 sales within ~0.75 mi
| Address | Dist | Beds/Ba | Sqft | Sold | Price | $/sf | Match |
|---|---|---|---|---|---|---|---|
| 1296 Dorchester Ave | 0.13mi | 3/2.0 | 1,506 (-2%) | 8mo | $282,100 | $187 | 81 |
| 1406 Cedar Run | 0.32mi | 3/2.5 | 1,475 (-4%) | 1mo | $289,900 | $197 | 72 |
| 1401 Cedar Run | 0.27mi | 3/2.5 | 1,475 (-4%) | 5mo | $289,900 | $197 | 71 |
| 1403 Linden Dr | 0.15mi | 3/2.0 | 1,312 (-14%) | 5mo | $175,000 | $133 | 61 |
| 1731 Cedar St | 0.71mi | 3/2.0 | 1,581 (+3%) | 1mo | $221,000 | $140 | 56 |
| 1411 Cedar Run | 0.30mi | 3/2.5 | 1,331 (-13%) | 4mo | $280,000 | $210 | 55 |
| 1410 Cedar Run | 0.33mi | 3/2.0 | 1,311 (-14%) | 3mo | $289,900 | $221 | 54 |
| 2240 Bypass Rd | 0.67mi | 3/2.0 | 1,632 (+7%) | 0mo | $330,000 | $202 | 53 |
| 2139 Groton Rd | 0.72mi | 2/2.0 (-1) | 1,494 (-2%) | 1mo | $102,900 | $69 | 53 |
| 1400 Cedar St | 0.33mi | 4/2.0 (+1) | 1,750 (+14%) | 6mo | $110,000 | $63 | 46 |
| 621 Cedar St | 0.62mi | 3/2.5 | 1,350 (-12%) | 6mo | $220,000 | $163 | 41 |
| 1714 Cedar St | 0.64mi | 3/2.5 | 1,741 (+14%) | 6mo | $292,000 | $168 | 36 |
Match score weights: distance 35% · size 25% · config 20% · recency 20%. Top-matched comps best support the ARV.
Projected returns pro-forma
-3.0% appreciation · 3.0% rent growth · sell at horizon
- IRR
- -3.8%
- Equity multiple
- 0.86×
- Total profit
- $-6,386
- Equity at exit
- $23,707
- IRR
- 5.9%
- Equity multiple
- 1.44×
- Total profit
- $19,557
- Equity at exit
- $13,747
Cash invested: $44,520 (down + closing). Projections, not guarantees.
Landlord ↔ Tenant lean methodology
- Overall (STATE)
- 27 Tenant-Leaning
- State Maryland
- 27 Tenant-Leaning · D+14
- County
- — inherits STATE
- City
- — inherits STATE
ZIP-level market 21851
- Home prices YoY
- -4.0%
- Active inventory
- 69
- Price-to-rent
- 7.2×
Monthly cashflow live
- Estimated rent
- $1,840 high interval (Pro) →
- Mortgage (P&I)
- −$834
- Tax from tax record
- −$251 /mo · $3,007/yr
- Insurance
- −$66
- HOA
- −$0
- Vacancy / Maint / Mgmt
- −$386
- Net cashflow
- $303
Break-even live
UW: 25.0% down · 7.5% · 30yr · 1.5% tax · 5.0% vac · 8.0% maint · 8.0% mgmt
Financing live
Cash to close
- Down payment
- $39,750
- Closing costs
- $4,770
- Reserves months
- —
- Total cash needed
- —
Loan-product check · same deal, 3 products live
Conventional
25% down · 7.5% · 30yr
- Down + closing
- —
- Monthly P&I
- —
- Monthly cashflow
- —
- DSCR
- —
- Eligible?
- —
Personal DTI + credit; lowest rate.
DSCR
20% down · 8.5% · 30yr
- Down + closing
- —
- Monthly P&I
- —
- Monthly cashflow
- —
- DSCR
- —
- Eligible?
- —
No personal income docs; deal must DSCR.
Hard money
10% down · 12.0% · 12mo
- Down + closing
- —
- Monthly P&I
- —
- Monthly cashflow
- —
- DSCR
- —
- Eligible?
- —
Short-term bridge; refi at stabilization.
Rent comps 7 comps
| Address | Beds | Baths | Sqft | Rent | $/sqft | DOM | Units | Dist |
|---|---|---|---|---|---|---|---|---|
| 241 Morgans Ct Pocomoke City, MD | 3.0 | 2.5 | 1304 | $1,795 | $1.38 | 13d | 1 | 0.20mi |
| 242 Morgans Ct Pocomoke City, MD | 3.0 | 2.5 | 1304 | $1,795 | $1.38 | 13d | 1 | 0.21mi |
| 202 Carsons Ct Pocomoke City, MD | 3.0 | 2.0 | 1472 | $1,695 | $1.15 | 13d | 1 | 0.21mi |
| 1513 Princess Anne Ln Pocomoke City, MD | 3.0 | 2.0 | 1542 | $1,950 | $1.26 | 43d | 1 | 0.25mi |
| 621 Cedar St Pocomoke City, MD | 3.0 | 2.5 | 1352 | $2,195 | $1.62 | 13d | 1 | 0.61mi |
| 2005 S Old Mill Dr Pocomoke City, MD | 3.0 | 2.0 | 1373 | $1,895 | $1.38 | 13d | 1 | 0.96mi |
| 2007 S Old Mill Dr Pocomoke City, MD | 3.0 | 2.0 | 1302 | $1,895 | $1.46 | 13d | 1 | 0.97mi |
Listing history 16 events
-
2026-06-18days on market $159,000 Active 41 DOM
-
2026-06-17days on market $159,000 Active 40 DOM
-
2026-06-16days on market $159,000 Active 39 DOM
-
2026-06-15days on market $159,000 Active 38 DOM
-
2026-06-14days on market $159,000 Active 36 DOM
-
2026-06-13pricedays on market $159,000 Active 35 DOM
-
2026-06-10days on market $169,000 Active 33 DOM
-
2026-06-09days on market $169,000 Active 32 DOM
-
2026-06-08days on market $169,000 Active 31 DOM
-
2026-06-07days on market $169,000 Active 30 DOM
-
2026-06-02days on market $169,000 Active 25 DOM
-
2026-06-01days on market $169,000 Active 24 DOM
-
2026-05-31days on market $169,000 Active 23 DOM
-
2026-05-30days on market $169,000 Active 22 DOM
-
2026-05-08$169,000 Active 975-char remark
-
1994-05-23soldstatus $63,000
ⓘ Source: listings_history table (triggers on properties + properties_extension) + one-shot
backfill from property_details.listing_events for pre-trigger history.
Tax reassessment forecast MD · Partial reset (capped growth)
- Current annual tax
- $3,007 · $251/mo
- Projected year-2 tax
- $3,007 · $251/mo
- Expected delta
- $0/yr ($0/mo · 0.0%)
ⓘ Screening estimate from a state-policy table — verify with the county assessor before closing.
Climate risk First Street
- Flood 5/10 Major FEMA zone X (unshaded) · 50% chance over 30 yrs
- Wildfire 3/10 Moderate
- Heat 8/10 Severe 7 d/yr ≥102°F today · 19 d/yr by 30 yrs out
- Wind 8/10 Severe 80% chance of damaging wind over 30 yrs
- Air quality 2/10 Low 1 unhealthy d/yr today · 1 by 30 yrs out
Nearby sold comps map
Loading sold comps map…
Walkable amenities ~0.75 mi
Loading nearby amenities…
Taxation est. · year 1
- Rental income
- $22,086
- − Mortgage interest
- −$8,906
- − Property taxes
- −$3,007
- − Insurance
- −$795
- − Repairs & maintenance
- −$1,767
- − Management
- −$1,767
- − Depreciation
- −$4,625
- Taxable income
- $1,218
- Est. tax owed @ 24.0%
- −$292
- After-tax cash flow
- $3,348/yr
For passive investors: Depreciation is non-cash, so a rental often shows a tax loss while cash-flowing — sheltering income. Rental losses are passive: they offset passive income freely, and up to $25,000/yr can offset ordinary (W-2) income if you actively participate and your MAGI is under $100k (phasing out to $0 by $150k); unused losses carry forward. On sale, claimed depreciation is recaptured at up to 25%, and gains may owe capital-gains tax (a 1031 exchange can defer both). Figures are a year-1 estimate at your 24.0% rate — not tax advice; consult a CPA.
Schools (NCES district)
- District
- Worcester County Public Schools
- NCES district ID
- 2400720
- Math proficiency
- 30% ▼ -25.00%
- Reading proficiency
- 44% ▼ -20.00%
- Median HH income
- $56,748
- Composite
- 32.6/100
- National rank
- #5672
- State rank
- #6 of 24 in MD
Livability — Pocomoke City
- Score
- 71/100
- State rank
- #157
- US rank
- #7066
Category grades
Schools grade is shown separately in the Schools card above.
Census & demographics
- Census place
- Pocomoke City, MD
- Population (ZIP)
- 7,252
Population outlook (Worcester County) Hauer SSP2
- Today (2025)
- 51,363 people
- By 2030
- 51,191 · -0.3%
- By 2040
- 50,459 · -1.8%
- By 2050
- 49,451 · -3.7%
- By 2075
- 48,533 · -5.5%
- By 2100
- 44,223 · -13.9%
Race, ethnicity, and origin ACS 2023
- Neighborhood character
- Diverse neighborhood (Simpson 0.58)
- Race & ethnicity
- White 54% Black 37% Two or more races 5% Asian 2% Hispanic / Latino 2%
- Common ancestry
- Scandinavian 2% Romanian 2% Scotch-Irish 2%
- Foreign-born
- 5% · Canada, Dominican Republic, Mexico
- Languages at home
- 93% English-only · Other Asian/Pacific 1% Spanish 1% Vietnamese 1%
Political lean MEDSL · Worcester
- 2024 margin
- Strong R (+22.0) · D 38.0% · R 60.0% · Other 2.0%
- 2008→2024 swing
- -6.5pp toward R · 2008: -15.5pp · 2024: -22.0pp
- All cycles
- 2024: R+22.0 2020: R+19.0 2016: R+27.9 2012: R+18.3 2008: R+15.5
Not yet ingested
- Civics
- —
Market trends
- HPI YoY
- ▼ -10.03%
- Current HPI
- 243.2329
- Rent YoY
- —
- Metro
- —
- State GDP YoY
- ▲ 2.97%
- F500 in state
- 12
Industry mix (Fortune 500 HQ in MD)
| Industry | F500 HQs | Revenue |
|---|---|---|
| Aerospace / Defense | 1 | $71B |
|
||
| Utilities | 1 | $25B |
|
||
| Hotels | 1 | $24B |
|
||
| Consumer Goods | 1 | $7B |
|
||
| Real Estate | 1 | $6B |
|
||
| Chemicals | 1 | $2B |
|
||
Price history
+152.4% since first listed3 events — show timeline
- 2026-06-10 Price Changed $159,000 BRIGHT MLS
- 2026-05-08 Listed $169,000 BRIGHT MLS
- 1994-05-23 Sold (Public Records) $63,000 Public Records
Property tax history
+5.0%/yrLatest (2025): $3,007 · +9.9% YoY. Source: county tax records.
Cash-flow waterfall
monthlySold comps — $/sqft
last 12 mo · ≤1 miLoading sold comps…