 Multi-family
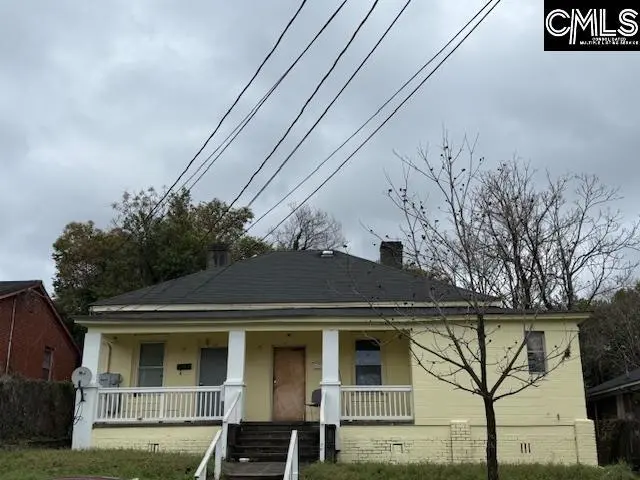
1108 Tree St · Columbia, SC
Flood risk 1/10 · Minimal
- FEMA flood zone
- X
- Chance of flooding over 30 yrs
- 0.0%
- Est. flood insurance / yr
- $435 – $905
Fire risk 1/10 · Minimal
- Est. fire insurance / yr
- $783 – $1,453
Heat risk 6/10 · Moderate
- Hot days now (above threshold)
- 7 days/yr
- Hot days in 30 yrs
- 16 days/yr
Wind risk No data
- Chance of severe wind over 30 yrs
- —
Air-quality risk No data
- Unhealthy air days now
- —
- Unhealthy air days in 30 yrs
- —
Risk factors via First Street. Map © Google.
Why this score? — see what drove the B grade
The composite is a weighted blend of 9 inputs, each scored 0–100. Each bar is that input's sub-score; the figure is the points it added to the 100-point composite (weight × sub-score).
- Cash flow +30.0/30.0
- 1% rule +10.0/10.0
- DSCR +10.0/10.0
- ARV discount +7.5/15.0
- Rent growth +4.2/5.0
- Livability +3.9/5.0
- Schools +2.6/10.0
- Condition / age +2.5/5.0
- Appreciation +0.0/10.0
$120,000
🖨 Deal sheet (PDF) 📄 Offer letter ✓ Due diligence
Multi-family units
County records classify this as Multi-Family (2-4 Unit). Listing-text estimate: 1 unit. estimate disagrees with records
Listing remarks
This 1940s Bungalow converted to a duplex many, many years ago has a lot of potential. It's located in a fast growing area of Columbia. Unit #1 is vacant and has been renovated. Unit #2 has a long time tenant in place (month to month). With some TLC this could be a great investment. The house can be updated as a rental or rehabbed as a single-family house. One block from Gervais and three blocks from the Millwood/Gervais intersection. Best option would be to leave it as a rental now and renovate as the neighborhood continues to improve and update. Less than 1.5 mile from USC campus. Disclaimer: CMLS has not reviewed and, therefore, does not endorse vendors who may appear in listings.
Key facts
- Renovated unit
- 5,227 sq ft lot
- Parking
Tags
Property features AI
Finance
- Other: Pest control provided by owner
- Financial info: Unit 2 currently rented for $500
Exterior
- Parking: One parking space; Additional parking noted as 'Other (See Remarks)'
- Utilities: Public sewer; Gas paid by tenant; Electricity paid by tenant; Sewer paid by tenant; Trash service paid by owner; Cable paid by tenant
- Home design: Single-story building; Two-unit property
- Construction: Crawlspace foundation
- Exterior features: Block and brick exterior; Owner is responsible for lawn maintenance; Paved road access; Public water
Interior
- Bedrooms: Unit 1: 1 bedroom; Unit 2: 1 bedroom
- Bathrooms: Two full bathrooms total (each unit has 1 full bath)
- Heating & cooling: Window air conditioning units; Heating provided (see remarks); heating cost paid by owner
- Interior features: Two separate units (duplex); Total heated area approximately 1,610
Neighborhood map
What this means for you Summary
Snapshot
- This is a 2-bed/2.0-bath multifamily listed at $120k.
Deal economics
- At list price, monthly cash flow is $1k ($15k/yr) — positive.
- The deal already cash-flows at list — no discount required.
- Meets the 1% rule at list price ($3k rent vs $120k).
- Recommended offer: $118k (1.5% below list) — sets the bar for market timing.
Location & tenants
- Location reads 78/100 on livability (#18 in SC, #2,436 nationally) — a middle-class / working-renter tenant base. Strengths: amenities A+, commute A+, cost of living A+; Watch: employment D, crime F.
- Richland 01 (urban): math 26% / reading 36% proficiency, ranked #54 of 80 in SC (top 68%) — families likely to look elsewhere, expect single-tenant / working-renter base with shorter leases; 64% free/reduced lunch — lower-income household profile, screen leases tightly.
- Zoned schools: Carver-Lyon Elementary (math 27% / reading 27%, grade F, #421 of 597 statewide, top 73%, 387 students, 100% FRL); Crayton Middle (math 48% / reading 64%, grade B-, #23 of 229 statewide, top 10%, 905 students, 100% FRL); A. C. Flora High (math 42% / reading 92%, grade B, #73 of 196 statewide, top 41%, 1,352 students, 100% FRL) — zoned schools average 100% FRL vs 64% district-wide (36 pts higher); higher-poverty schools than district average — tighter screening recommended.
- Zoned-school proficiency averages 50% at this address vs 31% district-wide (+19 pts) — the actual schools serving this property are materially stronger than the Richland 01 average implies; a family-tenant draw the district grade alone would hide.
- Market conditions: Rents rising fast (+7.0%/yr); 150 active listings in the ZIP; 10 comparable units currently listed for rent nearby; rentals at typical pace (median 25d on market — plan ~3-4 weeks tenant-placement turnaround); 3,472 units permitted in Richland County in 2024 (1,096 in 5+ unit buildings).
Forward outlook
- Local home prices are declining (-3.0%/yr); year-one equity from $830 of loan paydown is wiped out by about $4k of value loss. Plan a longer hold.
- Richland County population projected at +30% by 2050 — long-run rental-demand tailwind backs the buy-and-hold thesis.
- At projected returns (-3.0% appreciation + 7.0% rent growth), your $34k cash investment doubles in ~3 years — after that, you're playing with house money.
Negotiation context
- It's been on market 20 days — a 2% lower offer ($118k) is reasonable based on typical stale-listing flexibility.
- 2 sale attempts since 5y ago with the ask held roughly flat each time — persistent listings suggest the price (not the market) is what's stuck; bring a comps-based counter.
- Current owner paid $58k; list at $120k implies a 107% gain — meaningful room to come down on a strong offer.
Risks & watch-outs
- Watch-outs: built in 1940 — expect roof / HVAC / electrical / plumbing capex.
- Climate carrying-cost: extreme-heat days projected 7→16/yr by 2055 (HVAC capex compounding) — expect insurance premiums to compound above CPI over the hold.
Questions for the listing agent
- Built in 1940 — when were the roof, HVAC, electrical panel, plumbing, and water heater last replaced?
- Is there a deadline driving the sale (1031 exchange, divorce, estate, relocation)? That informs how much negotiation room exists.
- Schools are D-rated, which usually means shorter tenancies and higher turnover. Who's the typical renter profile here, and what's been the actual vacancy rate?
- Crime grade is F in this area — have there been break-ins, vandalism, or insurance claims at this property in the last 3 years? What carrier currently insures it and at what premium?
- What's the average days-on-market for RENTAL listings here right now (not sales)? A rising rental-DOM trend means longer vacancies and softer asking-rent achievability than the comps imply.
- What's the recent tenant-quality profile in this submarket — average credit score on applications, eviction rate, late-payment / NSF rate, and stable-employment percentage? A property-management company in the area should have these aggregated.
- How much new apartment / multifamily construction is in the pipeline within 1–3 miles? Heavy new supply (>2% of stock underway) typically softens rents 12–24 months out; light construction supports rent growth.
Investment metrics
- 1% rule
- 2.24% ✓
- Cap rate
- 19.19%
- Cash-on-cash
- 46.07%
- DSCR
- 3.05
- GRM
- 3.7
CMA / ARV
No comps found within radius.
Projected returns pro-forma
-3.0% appreciation · 6.95% rent growth · sell at horizon
- IRR
- 47.7%
- Equity multiple
- 3.20×
- Total profit
- $73,861
- Equity at exit
- $17,892
- IRR
- 55.1%
- Equity multiple
- 7.54×
- Total profit
- $219,742
- Equity at exit
- $10,375
Cash invested: $33,600 (down + closing). Projections, not guarantees.
Landlord ↔ Tenant lean methodology
- Overall (STATE)
- 90 Strongly Landlord-Friendly
- State South Carolina
- 90 Strongly Landlord-Friendly · R+6
- County
- — inherits STATE
- City
- — inherits STATE
ZIP-level market 29205
- Rents YoY
- 7.0%
- Active inventory
- 150
- Price-to-rent
- 7.4×
Monthly cashflow live
- Estimated rent
- $2,689 high interval (Pro) →
- Mortgage (P&I)
- −$629
- Tax from tax record
- −$155 /mo · $1,862/yr
- Insurance
- −$50
- HOA
- −$0
- Vacancy / Maint / Mgmt
- −$565
- Net cashflow
- $1,290
Break-even live
Sensitivity live
| Price | -10% $1,358 | -5% $1,324 | +0% $1,290 | +5% $1,256 | +10% $1,222 |
|---|---|---|---|---|---|
| Rent | -10% $1,077 | -5% $1,184 | +0% $1,290 | +5% $1,396 | +10% $1,502 |
| Rate | -1.0pp $1,350 | -0.5pp $1,320 | base $1,290 | +0.5pp $1,259 | +1.0pp $1,227 |
2-unit breakdown (identical units grouped — click to expand)
| Units | Beds | Baths | Est. rent |
|---|---|---|---|
| 2× units | 2 | 1 | $2,690 |
| #1 | 2 | 1 | $1,345 |
| #2 | 2 | 1 | $1,345 |
| Total (2 units) | $2,689 | ||
UW: 25.0% down · 7.5% · 30yr · 1.5% tax · 5.0% vac · 8.0% maint · 8.0% mgmt
Financing live
Cash to close
- Down payment
- $30,000
- Closing costs
- $3,600
- Reserves months
- —
- Total cash needed
- —
Loan-product check · same deal, 3 products live
Conventional
25% down · 7.5% · 30yr
- Down + closing
- —
- Monthly P&I
- —
- Monthly cashflow
- —
- DSCR
- —
- Eligible?
- —
Personal DTI + credit; lowest rate.
DSCR
20% down · 8.5% · 30yr
- Down + closing
- —
- Monthly P&I
- —
- Monthly cashflow
- —
- DSCR
- —
- Eligible?
- —
No personal income docs; deal must DSCR.
Hard money
10% down · 12.0% · 12mo
- Down + closing
- —
- Monthly P&I
- —
- Monthly cashflow
- —
- DSCR
- —
- Eligible?
- —
Short-term bridge; refi at stabilization.
Rent comps 10 comps
| Address | Beds | Baths | Sqft | Rent | $/sqft | DOM | Units | Dist |
|---|---|---|---|---|---|---|---|---|
| 1121 Zeigler St Unit B Columbia, SC | 3.0 | 2.5 | 1550 | $3,300 | $2.13 | 23d | 1 | 0.08mi |
| 2229 Greene St Columbia, SC | 3.0 | 2.0 | 1050 | $1,695 | $1.61 | 20d | 1 | 0.53mi |
| 1018 Laurens St Columbia, SC | 3.0 | 1.0 | 1500 | $2,700 | $1.80 | 25d | 1 | 0.76mi |
| 3040 Girardeau Ave Columbia, SC | 3.0 | 1.5 | 1400 | $2,150 | $1.54 | 16d | 1 | 0.87mi |
| 3040 Girardeau Ave Columbia, SC | 3.0 | 1.5 | 1400 | $2,150 | $1.54 | 25d | 1 | 0.87mi |
| 614 Capitol Pl Columbia, SC | 2.0 | 1.0 | 1200 | $1,895 | $1.58 | 16d | 1 | 0.99mi |
| 3125 Heyward St Unit A Columbia, SC | 3.0 | 1.0 | 1200 | $2,400 | $2.00 | 25d | 1 | 1.35mi |
| 3125 Heyward St Unit B Columbia, SC | 2.0 | 1.0 | 1100 | $1,600 | $1.45 | 25d | 1 | 1.35mi |
| 318 S Woodrow St Columbia, SC | 2.0 | 1.0 | 1103 | $1,700 | $1.54 | 25d | 1 | 1.38mi |
| 2050 N Beltline Blvd Columbia, SC | 1.0–2.0 | 1.0–1.5 | 831 | $1,042 | $1.25 | 16d | 6 | 1.39mi |
Listing history 14 events
-
2026-06-21days on market $120,000 Active 20 DOM
-
2026-06-18days on market $120,000 Active 17 DOM
-
2026-06-17days on market $120,000 Active 16 DOM
-
2026-06-16days on market $120,000 Active 15 DOM
-
2026-06-15days on market $120,000 Active 14 DOM
-
2026-06-14days on market $120,000 Active 12 DOM
-
2026-06-10statusdays on market $120,000 Active 9 DOM
-
2026-05-18$120,000 Active
-
2021-03-08soldstatus $58,000
-
2021-01-26historical
-
2021-01-22$65,000 Active
-
2021-01-19soldstatus $35,000
-
2004-11-18soldstatus $21,000
-
2002-04-17soldstatus $20,000
ⓘ Source: listings_history table (triggers on properties + properties_extension) + one-shot
backfill from property_details.listing_events for pre-trigger history.
Tax reassessment forecast SC · Resets to sale price
- Current annual tax
- $1,862 · $155/mo
- Projected year-2 tax
- $1,862 · $155/mo
- Expected delta
- $0/yr ($0/mo · 0.0%)
ⓘ Screening estimate from a state-policy table — verify with the county assessor before closing.
Climate risk First Street
- Flood 1/10 Low FEMA zone X · 0% chance over 30 yrs
- Wildfire 1/10 Low
- Heat 6/10 Major
Nearby sold comps map
Loading sold comps map…
Walkable amenities ~0.75 mi
Loading nearby amenities…
Taxation est. · year 1
- Rental income
- $32,268
- − Mortgage interest
- −$6,722
- − Property taxes
- −$1,862
- − Insurance
- −$600
- − Repairs & maintenance
- −$2,581
- − Management
- −$2,581
- − Depreciation
- −$3,491
- Taxable income
- $14,430
- Est. tax owed @ 24.0%
- −$3,463
- After-tax cash flow
- $12,015/yr
For passive investors: Depreciation is non-cash, so a rental often shows a tax loss while cash-flowing — sheltering income. Rental losses are passive: they offset passive income freely, and up to $25,000/yr can offset ordinary (W-2) income if you actively participate and your MAGI is under $100k (phasing out to $0 by $150k); unused losses carry forward. On sale, claimed depreciation is recaptured at up to 25%, and gains may owe capital-gains tax (a 1031 exchange can defer both). Figures are a year-1 estimate at your 24.0% rate — not tax advice; consult a CPA.
Schools (NCES district)
- District
- Richland 01
- NCES district ID
- 4503360
- Math proficiency
- 26% ▼ -7.00%
- Reading proficiency
- 36% ▼ -5.00%
- Median HH income
- $38,931
- Composite
- 25.94/100
- National rank
- #7335
- State rank
- #54 of 80 in SC
Livability — Columbia
- Score
- 78/100
- State rank
- #18
- US rank
- #2436
Category grades
Schools grade is shown separately in the Schools card above.
Census & demographics
- Census place
- Columbia, SC
- County
- Richland County · 389,530 people
- City population
- 335,994
- Metro
- Columbia, SC
- Population (ZIP)
- 22,223
- Household income
- $64,231
- Rent vs Own
- Severe rent burden
- 1372.0
Population outlook (Richland County) Hauer SSP2
- Today (2025)
- 459,667 people
- By 2030
- 487,524 · +6.1%
- By 2040
- 542,035 · +17.9%
- By 2050
- 595,371 · +29.5%
- By 2075
- 732,998 · +59.5%
- By 2100
- 820,415 · +78.5%
Race, ethnicity, and origin ACS 2023
- Neighborhood character
- Predominantly White (73%)
- Race & ethnicity
- White 73% Black 16% Two or more races 6% Hispanic / Latino 5% Asian 3%
- Common ancestry
- Serbian 6% Slovak 4% Lithuanian 3%
- Foreign-born
- 4% · Canada, China
- Languages at home
- 93% English-only · Spanish 3% German/W. Germanic 1% Chinese 1%
Political lean MEDSL · Richland
- 2024 margin
- Solid D (+34.6) · D 66.4% · R 31.8% · Other 1.8%
- 2008→2024 swing
- +5.7pp toward D · 2008: 28.9pp · 2024: 34.6pp
- All cycles
- 2024: D+34.6 2020: D+38.3 2016: D+32.9 2012: D+33.3 2008: D+28.9
Not yet ingested
- Civics
- —
Market trends
- HPI YoY
- ▼ -457.47%
- Current HPI
- 230.5538
- Rent YoY
- ▲ 6.95%
- Metro
- Columbia, SC
- State GDP YoY
- ▲ 4.51%
- F500 in state
- 2
Industry mix (Fortune 500 HQ in SC)
| Industry | F500 HQs | Revenue |
|---|---|---|
| Packaging | 1 | $7B |
|
||
Price history
+500.0% since first listed7 events — show timeline
- 2026-05-18 Listed $120,000 Consolidated MLS
- 2021-03-08 Sold (Public Records) $58,000 Public Records
- 2021-01-26 Delisted — Consolidated MLS
- 2021-01-22 Listed $65,000 Consolidated MLS
- 2021-01-19 Sold (Public Records) $35,000 Public Records
- 2004-11-18 Sold (Public Records) $21,000 Public Records
- 2002-04-17 Sold (Public Records) $20,000 Public Records
Property tax history
+7.7%/yrLatest (2025): $1,862 · +2.1% YoY. Source: county tax records.
Cash-flow waterfall
monthlySold comps — $/sqft
last 12 mo · ≤1 miLoading sold comps…