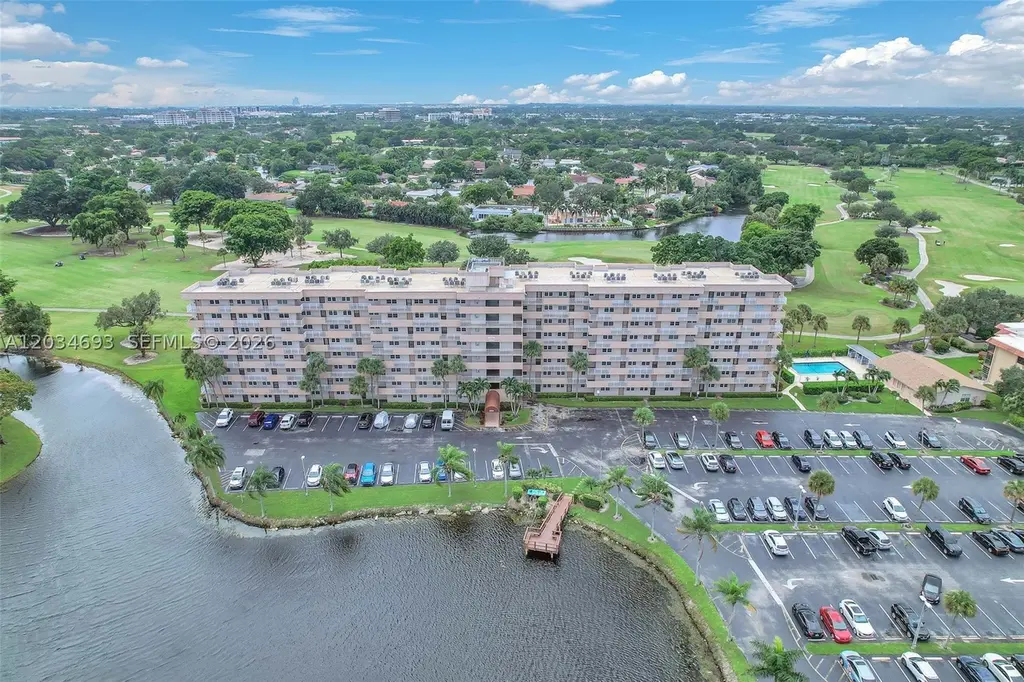
250 Jacaranda Dr #704 · Plantation, FL
Flood risk 1/10 · Minimal
- FEMA flood zone
- X (shaded)
- Chance of flooding over 30 yrs
- 0.0%
- Est. flood insurance / yr
- $507 – $1,088
Fire risk 1/10 · Minimal
- Est. fire insurance / yr
- $947 – $1,759
Heat risk 10/10 · Severe
- Hot days now (above 105°F)
- 7 days/yr
- Hot days in 30 yrs
- 26 days/yr
Wind risk 10/10 · Severe
- Chance of severe wind over 30 yrs
- 99.0%
Air-quality risk 3/10 · Minor
- Unhealthy air days now
- 2 days/yr
- Unhealthy air days in 30 yrs
- 3 days/yr
Risk factors via First Street. Map © Google.
Why this score? — see what drove the D grade
The composite is a weighted blend of 9 inputs, each scored 0–100. Each bar is that input's sub-score; the figure is the points it added to the 100-point composite (weight × sub-score).
- Cash flow +10.9/30.0
- ARV discount +7.5/15.0
- 1% rule +7.0/10.0
- Schools +4.1/10.0
- Livability +4.1/5.0
- DSCR +3.2/10.0
- Rent growth +2.8/5.0
- Condition / age +2.5/5.0
- Appreciation +0.0/10.0
$200,000
🖨 Deal sheet 📄 Offer letter ✓ Due diligence
Listing remarks
Discover the potential of this spacious 2-bedroom, 2-bathroom residence located in the heart of Plantation. Situated on the 7th floor, this well-maintained unit offers generous living spaces, abundant natural light, and endless opportunities to create the home of your dreams. The thoughtfully designed open floor plan provides a seamless flow between the living, dining, and entertaining areas, making it ideal for both everyday living and hosting guests. High-impact windows throughout offer added peace of mind, energy efficiency, and beautiful views. Both oversized bedrooms feature ample closet space and provide comfort and flexibility for family living. Whether you envision a contemporary re
Key facts
- Open floor plan
- Oversized bedrooms
- Ample closet space
Tags
Property features AI
Finance
- Financial info: Pets are allowed
- HOA & community: Monthly association fee; Association amenities include golf course access, laundry facilities, pool, and elevators; Association fee covers common areas; Located in a golf course community
Exterior
- Parking: Assigned parking with two or more spaces
- Security: Secured lobby
- Utilities: Cooling and heating provided (central); Standard utilities (details not specified)
- Home design: Condominium in an 8-story building; Unit entry on level 7
- Construction: Block construction
- Exterior features: No notable exterior features listed; Association pool
Interior
- Kitchen: Dishwasher; Disposal; Refrigerator
- Flooring: Ceramic tile
- Bathrooms: Two full bathrooms
- Heating & cooling: Central heating; Central air; Ceiling fans
- Interior features: Bedroom on main level; Elevator access
- Laundry & utility: Common area laundry
Neighborhood map
What this means for you Summary
Snapshot
- This is a 2-bed/2.0-bath condo listed at $200k.
Deal economics
- At list price, monthly cash flow is $-89 ($-1k/yr) — negative.
- To cash-flow at today's rent, offer at most $184k (7.9% below list).
- Meets the 1% rule at list price ($2k rent vs $200k).
- Recommended offer: $184k (7.9% below list) — sets the bar for cash-flow.
- Cap rate 5.8% vs local median 3.4% in Plantation — top-decile yield for the area; either an underpriced asset or a hidden risk that comps aren't pricing in. Stress-test before assuming the spread holds.
Location & tenants
- Location reads 82/100 on livability (#70 in FL, #1,174 nationally) — a professional / high-income tenant draw. Strengths: commute A+, housing A+, health & safety A+; Watch: amenities C-, cost of living D-.
- Broward (suburban): math 42% / reading 53% proficiency, ranked #46 of 73 in FL (top 63%) — families likely to look elsewhere, expect single-tenant / working-renter base with shorter leases.
- Market conditions: Rents rising (+1.2%/yr); 398 active listings in the ZIP; 40 comparable units currently listed for rent nearby; rentals at typical pace (median 17d on market — plan ~3-4 weeks tenant-placement turnaround); solid renter incomes; 2,111 units permitted in Broward County in 2024 (1,265 in 5+ unit buildings).
- This rent runs 34% of the median local income ($85k/yr) — at the standard rent-burdened threshold; future hikes will face affordability resistance.
Forward outlook
- Local home prices are declining (-3.0%/yr); year-one equity from $1k of loan paydown is wiped out by about $6k of value loss. Plan a longer hold.
- Broward County population projected at +34% by 2050 — long-run rental-demand tailwind backs the buy-and-hold thesis.
Negotiation context
- Only 8 days on market — expect competitive offers; lowballing is unlikely to land.
- Current owner paid $126k; list at $200k implies a 59% gain — meaningful room to come down on a strong offer.
Risks & watch-outs
- Watch-outs: HOA is 33% of rent.
- Climate carrying-cost: severe wind risk, 99% chance of damaging wind over 30y; extreme-heat days projected 7→26/yr by 2055 (HVAC capex compounding) — expect insurance premiums to compound above CPI over the hold.
Questions for the listing agent
- What do current leases actually rent for vs. the listed asking? Can we see a recent rent roll and the last 12 months of T-12 income?
- Built in 1975 — when were the roof, HVAC, electrical panel, plumbing, and water heater last replaced?
- What does the HOA fee cover, when was the last increase, and are there any pending special assessments or reserve-fund shortfalls?
- Any open or pending special assessments — roof, HVAC, plumbing, elevator, façade? What's the per-unit balance and payoff schedule, and is the seller paying it off at close or rolling it to the buyer?
- Is there a deadline driving the sale (1031 exchange, divorce, estate, relocation)? That informs how much negotiation room exists.
- Schools are B-rated — typically a magnet for longer-tenancy family renters. What's the average tenant stay here, and is there a school-zone premium baked into asking?
- The area grade is low — what's the realistic commute time and amenity access for the typical tenant pool here? Any planned neighborhood developments (good or bad) we should know about?
- What's the average days-on-market for RENTAL listings here right now (not sales)? A rising rental-DOM trend means longer vacancies and softer asking-rent achievability than the comps imply.
- What's the recent tenant-quality profile in this submarket — average credit score on applications, eviction rate, late-payment / NSF rate, and stable-employment percentage? A property-management company in the area should have these aggregated.
- How much new apartment / multifamily construction is in the pipeline within 1–3 miles? Heavy new supply (>2% of stock underway) typically softens rents 12–24 months out; light construction supports rent growth.
Investment metrics
- 1% rule
- 1.20% ✓
- Cap rate
- 5.76%
- Cash-on-cash
- -1.91%
- DSCR
- 0.92
- GRM
- 7.0
CMA / ARV
No comps found within radius.
Projected returns pro-forma
-3.0% appreciation · 1.23% rent growth · sell at horizon
- IRR
- -22.1%
- Equity multiple
- 0.25×
- Total profit
- $-41,867
- Equity at exit
- $29,821
- IRR
- -23.4%
- Equity multiple
- -0.05×
- Total profit
- $-58,724
- Equity at exit
- $17,292
Cash invested: $56,000 (down + closing). Projections, not guarantees.
Landlord ↔ Tenant lean methodology
- Overall (STATE)
- 87 Strongly Landlord-Friendly
- State Florida
- 87 Strongly Landlord-Friendly · R+3
- County
- — inherits STATE
- City
- — inherits STATE
ZIP-level market 33324
- Home prices YoY
- -33.5%
- Rents YoY
- 1.2%
- Active inventory
- 398
- Price-to-rent
- 7.0×
Monthly cashflow live
- Estimated rent
- $2,398 high interval (Pro) →
- Mortgage (P&I)
- −$1,049
- Tax from tax record
- −$69 /mo · $827/yr
- Insurance
- −$83
- HOA
- −$782
- Vacancy / Maint / Mgmt
- −$503
- Net cashflow
- $-89
Break-even live
UW: 25.0% down · 7.5% · 30yr · 1.5% tax · 5.0% vac · 8.0% maint · 8.0% mgmt
Financing live
Cash to close
- Down payment
- $50,000
- Closing costs
- $6,000
- Reserves months
- —
- Total cash needed
- —
Loan-product check · same deal, 3 products live
Conventional
25% down · 7.5% · 30yr
- Down + closing
- —
- Monthly P&I
- —
- Monthly cashflow
- —
- DSCR
- —
- Eligible?
- —
Personal DTI + credit; lowest rate.
DSCR
20% down · 8.5% · 30yr
- Down + closing
- —
- Monthly P&I
- —
- Monthly cashflow
- —
- DSCR
- —
- Eligible?
- —
No personal income docs; deal must DSCR.
Hard money
10% down · 12.0% · 12mo
- Down + closing
- —
- Monthly P&I
- —
- Monthly cashflow
- —
- DSCR
- —
- Eligible?
- —
Short-term bridge; refi at stabilization.
Rent comps 40 comps
| Address | Beds | Baths | Sqft | Rent | $/sqft | DOM | Units | Dist |
|---|---|---|---|---|---|---|---|---|
| 250 Jacaranda Dr Plantation, FL | 2.0 | 2.0 | 1015 | $2,275 | $2.24 | 3d | 2 | 0.01mi |
| 250 Jacaranda Dr Plantation, FL | 2.0 | 2.0 | 1015 | $2,300 | $2.27 | 16d | 1 | 0.01mi |
| 250 Jacaranda Dr #608 Plantation, FL | 2.0 | 2.0 | 1015 | $2,250 | $2.22 | 11d | 1 | 0.01mi |
| 200 Jacaranda Dr Unit B1 Plantation, FL | 1.0 | 1.0 | 810 | $1,900 | $2.35 | 13d | 1 | 0.08mi |
| 130 Jacaranda Country Club Dr #203 Plantation, FL | 2.0 | 2.5 | 1205 | $2,450 | $2.03 | 17d | 1 | 0.12mi |
| 130 Jacaranda Country Club Dr #203 Plantation, FL | 2.0 | 3.0 | 1205 | $2,450 | $2.03 | 11d | 1 | 0.12mi |
| 130 Jacaranda Country Club Dr #203 Plantation, FL | 2.0 | 2.5 | 1205 | $2,450 | $2.03 | 22d | 1 | 0.12mi |
| 21 Jacaranda Dr #224 Fort Lauderdale, FL | 2.0 | 2.0 | 900 | $2,499 | $2.78 | 24d | 1 | 0.13mi |
| 1 Jacaranda Dr #202 Fort Lauderdale, FL | 2.0 | 2.0 | 900 | $1,800 | $2.00 | 16d | 1 | 0.19mi |
| 2641 N Flamingo Rd Plantation, FL | 2.0 | 2.0 | 1102 | $2,997 | $2.72 | 1d | 3 | 0.24mi |
| 2641 N Flamingo Rd Plantation, FL | 2.0 | 2.0 | 1102 | $3,175 | $2.88 | 16d | 4 | 0.24mi |
| 150 SW 91st Ave Plantation, FL | 1.0–3.0 | 1.0–2.0 | 962 | $2,438 | $2.53 | 1d | 19 | 0.25mi |
| 64 Wimbledon Lake Dr #64 Plantation, FL | 3.0 | 2.0 | 1210 | $2,650 | $2.19 | 16d | 1 | 0.26mi |
| 261 Wimbledon Lake Dr Plantation, FL | 3.0 | 2.0 | 1210 | $2,750 | $2.27 | 24d | 1 | 0.27mi |
| 181 Wimbledon Lakes Dr #181 Plantation, FL | 3.0 | 2.5 | 1500 | $2,750 | $1.83 | 24d | 1 | 0.30mi |
| 1 S Pine Island Rd Plantation, FL | 2.0 | 1.0–2.0 | 922 | $2,530 | $2.74 | 1d | 13 | 0.30mi |
| 192 SW 96th Ave Unit 192 Plantation, FL | 2.0 | 2.5 | 1110 | $2,600 | $2.34 | 10d | 1 | 0.41mi |
| 9001 Jacaranda Ln #107 Plantation, FL | 2.0 | 2.0 | 960 | $2,250 | $2.34 | 24d | 1 | 0.43mi |
| 9050 Jacaranda Ln #8 Plantation, FL | 1.0 | 1.0 | 721 | $1,725 | $2.39 | 24d | 1 | 0.48mi |
| 9050 Jacaranda Ln #8 Plantation, FL | 1.0 | 1.0 | 721 | $1,725 | $2.39 | 7d | 1 | 0.48mi |
| 301 N Pine Island Rd #156 Plantation, FL | 2.0 | 1.5 | 1010 | $1,950 | $1.93 | 24d | 1 | 0.49mi |
| 145 SW 96th Ter Unit 145 Plantation, FL | 2.0 | 1.5 | 1110 | $2,500 | $2.25 | 2d | 1 | 0.50mi |
| 8760 NW 4th St Plantation, FL | 1.0 | 1.0 | 774 | $2,250 | $2.91 | 2d | 11 | 0.53mi |
| 455 S Pine Island Rd Unit 110C Plantation, FL | 3.0 | 2.0 | 1172 | $2,500 | $2.13 | 17d | 1 | 0.57mi |
| 455 S Pine Island Rd Unit 307C Plantation, FL | 2.0 | 2.0 | 1021 | $1,900 | $1.86 | 24d | 1 | 0.57mi |
| 104 NW 98th Ter #104 Plantation, FL | 2.0 | 2.0 | 1257 | $2,700 | $2.15 | 7d | 1 | 0.60mi |
| 505 S Pine Island Rd Plantation, FL | 2.0 | 2.5 | 1007 | $2,000 | $1.99 | 1d | 1 | 0.60mi |
| 461 NW 87th Rd Plantation, FL | 1.0–2.0 | 1.0–2.0 | 951 | $2,420 | $2.54 | 2d | 8 | 0.64mi |
| 134 NW 98th Ter Plantation, FL | 2.0 | 2.0 | 1272 | $2,900 | $2.28 | 24d | 1 | 0.64mi |
| 9801 NW 1st Ct #9801 Plantation, FL | 3.0 | 2.0 | 1310 | $3,000 | $2.29 | 18d | 1 | 0.66mi |
| 731 N Pine Island Rd Plantation, FL | 1.0–2.0 | 1.5–2.0 | 910 | $2,300 | $2.53 | 4d | 2 | 0.68mi |
| 731 N Pine Island Rd Plantation, FL | 1.0–2.0 | 1.5–2.0 | 910 | $2,300 | $2.53 | 7d | 3 | 0.68mi |
| 731 N Pine Island Rd #401 Plantation, FL | 2.0 | 2.0 | 1057 | $2,300 | $2.18 | 15d | 1 | 0.69mi |
| 9867 NW 1st Ct Plantation, FL | 3.0 | 2.0 | 1310 | $3,200 | $2.44 | 17d | 1 | 0.70mi |
| 9867 NW 1st Ct Plantation, FL | 3.0 | 2.0 | 1310 | $3,200 | $2.44 | 5d | 1 | 0.70mi |
| 721 N Pine Island Rd #103 Plantation, FL | 2.0 | 2.0 | 1057 | $2,100 | $1.99 | 24d | 1 | 0.74mi |
| 721 N Pine Island Rd Plantation, FL | 1.0–2.0 | 1.5–2.0 | 912 | $2,100 | $2.30 | 14d | 3 | 0.74mi |
| 721 N Pine Island Rd Plantation, FL | 1.0–2.0 | 1.5–2.0 | 912 | $2,100 | $2.30 | 7d | 3 | 0.74mi |
| 721 N Pine Island Rd Plantation, FL | 2.0 | 2.0 | 1058 | $1,925 | $1.82 | 17d | 2 | 0.74mi |
| 741 N Pine Island Rd #303 Plantation, FL | 3.0 | 2.0 | 1214 | $2,400 | $1.98 | 24d | 1 | 0.76mi |
HOA detail condo
- Monthly dues
- $782 · $9,384/yr
- Assessments
- None detected in remarks — confirm with the listing agent.
Listing history 6 events
-
2026-06-18days on market $200,000 Active 8 DOM
-
2026-06-17days on market $200,000 Active 7 DOM
-
2026-06-16days on market $200,000 Active 6 DOM
-
2026-06-15days on market $200,000 Active 5 DOM
-
2026-06-13remarks 699-char remark
-
2026-06-13$200,000 Active 3 DOM
ⓘ Source: listings_history table (triggers on properties + properties_extension) + one-shot
backfill from property_details.listing_events for pre-trigger history.
Tax reassessment forecast FL · Resets to sale price
- Current annual tax
- $827 · $69/mo
- Projected year-2 tax
- $1,660 · $138/mo
- Expected delta
- +$833/yr (+$69/mo · 100.8%)
ⓘ Screening estimate from a state-policy table — verify with the county assessor before closing.
Climate risk First Street
- Flood 1/10 Low FEMA zone X (shaded) · 0% chance over 30 yrs
- Wildfire 1/10 Low
- Heat 10/10 Extreme 7 d/yr ≥105°F today · 26 d/yr by 30 yrs out
- Wind 10/10 Extreme 99% chance of damaging wind over 30 yrs
- Air quality 3/10 Moderate 2 unhealthy d/yr today · 3 by 30 yrs out
Nearby sold comps map
Loading sold comps map…
Walkable amenities ~0.75 mi
Loading nearby amenities…
Taxation est. · year 1
- Rental income
- $28,770
- − Mortgage interest
- −$11,203
- − Property taxes
- −$827
- − Insurance
- −$1,000
- − Repairs & maintenance
- −$2,302
- − Management
- −$2,302
- − HOA
- −$9,384
- − Depreciation
- −$5,818
- Taxable loss
- −$4,065
- Est. tax savings @ 24.0%
- +$976
- After-tax cash flow
- $-92/yr
For passive investors: Depreciation is non-cash, so a rental often shows a tax loss while cash-flowing — sheltering income. Rental losses are passive: they offset passive income freely, and up to $25,000/yr can offset ordinary (W-2) income if you actively participate and your MAGI is under $100k (phasing out to $0 by $150k); unused losses carry forward. On sale, claimed depreciation is recaptured at up to 25%, and gains may owe capital-gains tax (a 1031 exchange can defer both). Figures are a year-1 estimate at your 24.0% rate — not tax advice; consult a CPA.
Schools (NCES district)
- District
- Broward
- NCES district ID
- 1200180
- Math proficiency
- 42% ▼ -18.00%
- Reading proficiency
- 53% ▼ -5.00%
- Median HH income
- $52,139
- Composite
- 40.88/100
- National rank
- #3621
- State rank
- #46 of 73 in FL
Livability — Plantation
- Score
- 82/100
- State rank
- #70
- US rank
- #1174
Category grades
Schools grade is shown separately in the Schools card above.
Census & demographics
- Census place
- Plantation, FL
- County
- Broward County · 1,963,430 people
- City population
- 111,690
- Metro
- Miami-Fort Lauderdale-Pompano Beach, FL
- Population (ZIP)
- 50,151
- Household income
- $85,000
- Rent vs Own
- Severe rent burden
- 2923.0
Population outlook (Broward County) Hauer SSP2
- Today (2025)
- 2,207,033 people
- By 2030
- 2,360,704 · +7.0%
- By 2040
- 2,661,208 · +20.6%
- By 2050
- 2,946,698 · +33.5%
- By 2075
- 3,602,273 · +63.2%
- By 2100
- 3,970,984 · +79.9%
Race, ethnicity, and origin ACS 2023
- Neighborhood character
- Diverse neighborhood (Simpson 0.69)
- Race & ethnicity
- White 42% Hispanic / Latino 31% Two or more races 20% Black 16% Asian 6%
- Hispanic origin (detail)
- Mexican 2% Puerto Rican 5% Cuban 4% Dominican 2%
- Common ancestry
- Romanian 3% Italian 3% Hispanic 3%
- Foreign-born
- 31% · Canada, Jamaica, China
- Languages at home
- 60% English-only · Spanish 26% Other Indo-European 4% French/Haitian/Cajun 3%
Political lean MEDSL · Broward
- 2024 margin
- D (+17.0) · D 58.0% · R 41.0%
- 2008→2024 swing
- -17.8pp toward R · 2008: 34.7pp · 2024: 17.0pp
- All cycles
- 2024: D+17.0 2020: D+29.8 2016: D+35.0 2012: D+34.9 2008: D+34.7
Not yet ingested
- Civics
- —
Market trends
- HPI YoY
- ▼ -160.16%
- Current HPI
- 317.8685
- Rent YoY
- ▲ 1.23%
- Metro
- Miami-Fort Lauderdale-Pompano Beach, FL
- State GDP YoY
- ▲ 3.28%
- F500 in state
- 36
Industry mix (Fortune 500 HQ in FL)
| Industry | F500 HQs | Revenue |
|---|---|---|
| Industrial Technology | 2 | $29B |
|
||
| Insurance | 2 | $17B |
|
||
| Retail | 1 | $60B |
|
||
| Technology Distribution | 1 | $58B |
|
||
| Homebuilding | 1 | $35B |
|
||
| Technology Manufacturing | 1 | $35B |
|
||
Price history
+185.7% since first listed3 events — show timeline
- 2026-06-10 Listed $200,000 MARMLS
- 2003-04-18 Sold (Public Records) $125,900 Public Records
- 1982-05-01 Sold (Public Records) $70,000 Public Records
Property tax history
+2.1%/yrLatest (2025): $827 · +4.9% YoY. Source: county tax records.
Cash-flow waterfall
monthlySold comps — $/sqft
last 12 mo · ≤1 miLoading sold comps…