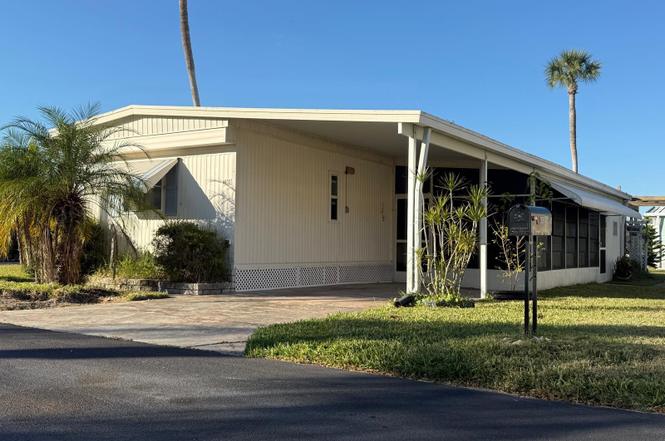
4432 Tucker Sq · Beacon Square, FL
Flood risk 9/10 · Severe
- FEMA flood zone
- AE
- Chance of flooding over 30 yrs
- 0.99%
- Est. flood insurance / yr
- $1,737 – $8,500
Fire risk 3/10 · Minor
- Est. fire insurance / yr
- $947 – $1,759
Heat risk 10/10 · Severe
- Hot days now (above 109°F)
- 7 days/yr
- Hot days in 30 yrs
- 27 days/yr
Wind risk 10/10 · Severe
- Chance of severe wind over 30 yrs
- 99.0%
Air-quality risk 2/10 · Minimal
- Unhealthy air days now
- 1 days/yr
- Unhealthy air days in 30 yrs
- 1 days/yr
Risk factors via First Street. Map © Google.
Why this score? — see what drove the B grade
The composite is a weighted blend of 9 inputs, each scored 0–100. Each bar is that input's sub-score; the figure is the points it added to the 100-point composite (weight × sub-score).
- Cash flow +30.0/30.0
- 1% rule +10.0/10.0
- DSCR +10.0/10.0
- ARV discount +7.5/15.0
- Schools +4.3/10.0
- Livability +3.3/5.0
- Rent growth +2.7/5.0
- Condition / age +2.5/5.0
- Appreciation +0.0/10.0
$49,900
🖨 Deal sheet 📄 Offer letter ✓ Due diligence
Listing remarks MLS
A Fully renovated Manufactured Home awaits in a 55+ community! Approximate Project Completion Date: 03/31/2025. It is close to public parks, beaches, shopping, restaurants. Don't miss this opportunity to have a piece of beautiful New Port Richey to call your own.
Key facts
- Fully renovated
- Shopping
- Beaches
Tags
Property features AI
Finance
- Other:
- Financial info:
- HOA & community: HOA required (Place in Sun/Marcia McDonald) — $175 monthly; includes cable TV, pool, internet, and common area taxes; Community clubhouse; Buyer approval required; Senior community; Pets allowed
Exterior
- Parking:
- Security:
- Utilities: Well water; Septic tank; Broadband/high-speed internet available; Cable available; Private utilities
- Home design: Residential mobile home (single wide); One story; Faces east; Entry level: One
- Construction: Metal frame construction; Metal roof; Crawlspace foundation; Built on a 0.11-acre lot
- Exterior features: Other exterior features; Paved road access
Interior
- Kitchen: Appliances: Other
- Bedrooms: 2 bedrooms
- Flooring: Carpet; Vinyl
- Bathrooms: 2 full bathrooms
- Heating & cooling: Central heating (electric); Central air conditioning
- Interior features: Other interior features
- Laundry & utility: Laundry: Other
Neighborhood map
What this means for you Summary
Snapshot
- This is a 2-bed/2.0-bath manufactured listed at $50k.
Deal economics
- At list price, monthly cash flow is $297 ($4k/yr) — positive.
- The deal already cash-flows at list — no discount required.
- Meets the 1% rule at list price ($2k rent vs $50k).
- Recommended offer: $44k (12.0% below list) — sets the bar for market timing.
- Cap rate 23.7% vs local median 2.7% in Beacon Square — top-decile yield for the area; either an underpriced asset or a hidden risk that comps aren't pricing in. Stress-test before assuming the spread holds.
Location & tenants
- Location reads 66/100 on livability (#600 in FL) — a middle-class / working-renter tenant base. Strengths: cost of living A+, housing A+, health & safety B; Watch: employment D, schools F, amenities F.
- Pasco (suburban): math 50% / reading 52% proficiency, ranked #32 of 73 in FL (top 44%) — acceptable for families but not a draw, mixed tenant base, ~2y average lease.
- Market conditions: Rents flat; 635 active listings in the ZIP; 40 comparable units currently listed for rent nearby; rentals at typical pace (median 20d on market — plan ~3-4 weeks tenant-placement turnaround); 6,765 units permitted in Pasco County in 2024 (1,250 in 5+ unit buildings).
- This rent runs 34% of the median local income ($57k/yr) — at the standard rent-burdened threshold; future hikes will face affordability resistance.
Forward outlook
- Local home prices are declining (-3.0%/yr); year-one equity from $345 of loan paydown is wiped out by about $1k of value loss. Plan a longer hold.
- Pasco County population projected at +29% by 2050 — long-run rental-demand tailwind backs the buy-and-hold thesis.
- At projected returns (-3.0% appreciation + 0.7% rent growth), your $14k cash investment doubles in ~6 years — after that, you're playing with house money.
Negotiation context
- It's been on market 367 days — a 12% lower offer ($44k) is reasonable based on typical stale-listing flexibility.
- 4 sale attempts since 10y ago; this cycle's ask has dropped $79k (61%) from the opening price — seller is motivated, your offer sets the floor, not the list.
- Current owner paid $37k; 35% above their basis — modest negotiation headroom, anchor on the comps not their cost.
Risks & watch-outs
- Watch-outs: flood insurance adds $427/mo.
- Climate carrying-cost: in FEMA flood zone AE (mandatory federal flood insurance); severe wind risk, 99% chance of damaging wind over 30y; extreme-heat days projected 7→27/yr by 2055 (HVAC capex compounding) — expect insurance premiums to compound above CPI over the hold.
Questions for the listing agent
- It's been on market 367 days. Have you received any prior offers? Is the seller open to a 12% concession, seller financing, or rate buy-down credit?
- What's the actual annual flood-insurance premium (NFIP or private), and is the property in a SFHA with mandatory coverage?
- What does the HOA fee cover, when was the last increase, and are there any pending special assessments or reserve-fund shortfalls?
- Why hasn't it sold? Are there any deal-killer items the seller is aware of (foundation, flood, title, zoning, code violations)?
- Is there a deadline driving the sale (1031 exchange, divorce, estate, relocation)? That informs how much negotiation room exists.
- Schools are F-rated, which usually means shorter tenancies and higher turnover. Who's the typical renter profile here, and what's been the actual vacancy rate?
- What's the average days-on-market for RENTAL listings here right now (not sales)? A rising rental-DOM trend means longer vacancies and softer asking-rent achievability than the comps imply.
- What's the recent tenant-quality profile in this submarket — average credit score on applications, eviction rate, late-payment / NSF rate, and stable-employment percentage? A property-management company in the area should have these aggregated.
- How much new for-sale + rental construction is in the pipeline within 1–3 miles? Heavy new supply typically softens prices + rents 12–24 months out; constrained supply supports both.
Investment metrics
- 1% rule
- 3.19% ✓
- Cap rate
- 23.70%
- Cash-on-cash
- 62.16%
- DSCR
- 3.77
- GRM
- 2.6
CMA / ARV
- ARV (on-the-fly)
- $136,920
- Comps found
- 1
Show comp detail 1 sale within ~0.75 mi
| Address | Dist | Beds/Ba | Sqft | Sold | Price | $/sf | Match |
|---|---|---|---|---|---|---|---|
| 4135 Pecan Dr | 0.65mi | 2/2.0 | 864 (+3%) | 13mo | $141,000 | $163 | 54 |
Match score weights: distance 35% · size 25% · config 20% · recency 20%. Top-matched comps best support the ARV.
Projected returns pro-forma
-3.0% appreciation · 0.72% rent growth · sell at horizon
- IRR
- 14.5%
- Equity multiple
- 1.55×
- Total profit
- $7,677
- Equity at exit
- $7,440
- IRR
- 19.8%
- Equity multiple
- 2.34×
- Total profit
- $18,705
- Equity at exit
- $4,314
Cash invested: $13,972 (down + closing). Projections, not guarantees.
Landlord ↔ Tenant lean methodology
- Overall (STATE)
- 87 Strongly Landlord-Friendly
- State Florida
- 87 Strongly Landlord-Friendly · R+3
- County
- — inherits STATE
- City
- — inherits STATE
ZIP-level market 34652
- Home prices YoY
- -26.1%
- Rents YoY
- 0.7%
- Active inventory
- 635
- Price-to-rent
- 2.6×
Monthly cashflow live
- Estimated rent
- $1,590 high interval (Pro) →
- Mortgage (P&I)
- −$262
- Tax from tax record
- −$75 /mo · $903/yr
- Insurance
- −$21
- Flood insurance flood zone
- −$427 /mo · $5,118/yr
- HOA
- −$175
- Vacancy / Maint / Mgmt
- −$334
- Net cashflow
- $297
Break-even live
UW: 25.0% down · 7.5% · 30yr · 1.5% tax · 5.0% vac · 8.0% maint · 8.0% mgmt
Financing live
Cash to close
- Down payment
- $12,475
- Closing costs
- $1,497
- Reserves months
- —
- Total cash needed
- —
Loan-product check · same deal, 3 products live
Conventional
25% down · 7.5% · 30yr
- Down + closing
- —
- Monthly P&I
- —
- Monthly cashflow
- —
- DSCR
- —
- Eligible?
- —
Personal DTI + credit; lowest rate.
DSCR
20% down · 8.5% · 30yr
- Down + closing
- —
- Monthly P&I
- —
- Monthly cashflow
- —
- DSCR
- —
- Eligible?
- —
No personal income docs; deal must DSCR.
Hard money
10% down · 12.0% · 12mo
- Down + closing
- —
- Monthly P&I
- —
- Monthly cashflow
- —
- DSCR
- —
- Eligible?
- —
Short-term bridge; refi at stabilization.
Rent comps 40 comps
| Address | Beds | Baths | Sqft | Rent | $/sqft | DOM | Units | Dist |
|---|---|---|---|---|---|---|---|---|
| 4221 Touchton Pl New Port Richey, FL | 2.0 | 2.0 | 888 | $1,300 | $1.46 | 23d | 1 | 0.15mi |
| 4408 Rustic Dr New Port Richey, FL | 2.0 | 1.0 | 1101 | $1,500 | $1.36 | 24d | 1 | 0.17mi |
| 4209 Touchton Pl New Port Richey, FL | 1.0 | 1.0 | 624 | $1,300 | $2.08 | 16d | 1 | 0.17mi |
| 4411 Rustic Dr Unit 1 New Port Richey, FL | 2.0 | 2.0 | 1050 | $1,450 | $1.38 | 12d | 1 | 0.20mi |
| 4211 Hampton Dr New Port Richey, FL | 2.0 | 2.0 | 1050 | $1,795 | $1.71 | 4d | 1 | 0.22mi |
| 4540 Irene Loop New Port Richey, FL | 2.0 | 1.0 | 768 | $1,550 | $2.02 | 24d | 1 | 0.42mi |
| 4721 Naftis Ln New Port Richey, FL | 3.0 | 2.0 | 1104 | $1,700 | $1.54 | 12d | 1 | 0.46mi |
| 4124 Flamingo Dr New Port Richey, FL | 3.0 | 1.0 | 744 | $1,500 | $2.02 | 3d | 1 | 0.47mi |
| 4124 Flamingo Dr New Port Richey, FL | 3.0 | 1.0 | 744 | $1,500 | $2.02 | 14d | 1 | 0.47mi |
| 4616 Irene Loop New Port Richey, FL | 2.0 | 1.0 | 898 | $1,600 | $1.78 | 19d | 1 | 0.48mi |
| 4133 Grayton Dr New Port Richey, FL | 2.0 | 1.5 | 1068 | $1,727 | $1.62 | 4d | 1 | 0.53mi |
| 4852 Pompano Dr New Port Richey, FL | 2.0 | 2.0 | 1104 | $2,900 | $2.63 | 24d | 1 | 0.57mi |
| 5020 Vickers Dr New Port Richey, FL | 2.0 | 1.0 | 863 | $1,550 | $1.80 | 4d | 1 | 0.63mi |
| 4548 Belfast Dr New Port Richey, FL | 3.0 | 1.0 | 1075 | $1,575 | $1.47 | 17d | 1 | 0.75mi |
| 4939 Floramar Ter New Port Richey, FL | 2.0 | 2.0 | 1050 | $1,675 | $1.60 | 24d | 2 | 0.78mi |
| 4939 Floramar Ter New Port Richey, FL | 2.0 | 2.0 | 1050 | $1,600 | $1.52 | 1d | 2 | 0.78mi |
| 4939 Floramar Ter New Port Richey, FL | 2.0 | 2.0 | 1050 | $1,648 | $1.57 | 16d | 3 | 0.78mi |
| 4436 Floramar Ter New Port Richey, FL | 2.0 | 1.5 | 890 | $2,295 | $2.58 | 4d | 1 | 0.83mi |
| 4430 Floramar Ter New Port Richey, FL | 2.0 | 1.5 | 1094 | $2,500 | $2.29 | 3d | 1 | 0.84mi |
| 4518 Audrey Ln Unit 4551 New Port Richey, FL | 2.0 | 1.0 | 750 | $1,295 | $1.73 | 21d | 1 | 0.85mi |
| 4529 Audrey Ln New Port Richey, FL | 2.0 | 1.0 | 750 | $1,295 | $1.73 | 21d | 1 | 0.85mi |
| 4540 Audrey Ln New Port Richey, FL | 2.0 | 1.0 | 750 | $1,150 | $1.53 | 24d | 1 | 0.87mi |
| 4551 Audrey Ln NEW PRT RCHY, FL | 2.0 | 1.0 | 750 | $1,295 | $1.73 | 21d | 1 | 0.87mi |
| 5197 Silent Loop #124 New Port Richey, FL | 2.0 | 2.0 | 956 | $2,200 | $2.30 | 24d | 1 | 0.92mi |
| 5197 Silent Loop New Port Richey, FL | 2.0 | 2.0 | 956 | $2,200 | $2.30 | 3d | 1 | 0.92mi |
| 4754 Marine Pkwy Unit 102-I New Port Richey, FL | 2.0 | 2.0 | 1088 | $1,500 | $1.38 | 24d | 1 | 0.92mi |
| 3439 Clydesdale Dr Holiday, FL | 2.0 | 1.0 | 968 | $1,395 | $1.44 | 4d | 1 | 0.93mi |
| 4854 Marine Pkwy #103 New Port Richey, FL | 1.0 | 2.0 | 1088 | $1,500 | $1.38 | 24d | 1 | 0.93mi |
| 5132 Amulet Dr #107 New Port Richey, FL | 1.0 | 1.0 | 928 | $1,395 | $1.50 | 12d | 1 | 0.93mi |
| 3511 Cambridge St New Port Richey, FL | 2.0 | 2.0 | 936 | $2,100 | $2.24 | 4d | 1 | 0.95mi |
| 3433 Monticello St Holiday, FL | 3.0 | 1.5 | 960 | $1,650 | $1.72 | 24d | 1 | 0.95mi |
| 4753 Marine Pkwy Unit 4753 New Port Richey, FL | 2.0 | 2.0 | 1100 | $1,600 | $1.45 | 24d | 1 | 0.97mi |
| 5154 Turquoise Ln #102 New Port Richey, FL | 1.0 | 1.0 | 708 | $1,250 | $1.77 | 4d | 1 | 0.99mi |
| 4744 Azalea Dr #204 New Port Richey, FL | 1.0 | 1.0 | 736 | $1,100 | $1.49 | 20d | 1 | 1.01mi |
| 4901 Onyx Ln #102 New Port Richey, FL | 1.0 | 1.0 | 672 | $1,295 | $1.93 | 24d | 1 | 1.02mi |
| 4533 Marine Pkwy #101 New Port Richey, FL | 2.0 | 2.0 | 1066 | $1,795 | $1.68 | 20d | 1 | 1.02mi |
| 4533 Marine Pkwy #101 New Port Richey, FL | 2.0 | 2.0 | 1066 | $1,795 | $1.68 | 17d | 1 | 1.02mi |
| 4746 Azalea Dr Apt 103C Port Richey, FL | 2.0 | 2.0 | 1008 | $1,220 | $1.21 | 24d | 1 | 1.04mi |
| 5333 Pasadena Dr Unit 5333 New Port Richey, FL | 1.0 | 1.0 | 576 | $1,200 | $2.08 | 17d | 1 | 1.04mi |
| 3516 Sheryl Hill Dr Holiday, FL | 2.0 | 2.0 | 848 | $1,595 | $1.88 | 24d | 1 | 1.05mi |
HOA detail
- Monthly dues
- $175 · $2,100/yr
Listing history 27 events
-
2026-06-18days on market $49,900 Active 367 DOM
-
2026-06-17days on market $49,900 Active 366 DOM
-
2026-06-16days on market $49,900 Active 365 DOM
-
2026-06-15days on market $49,900 Active 364 DOM
-
2026-06-13days on market $49,900 Active 362 DOM
-
2026-06-09days on market $49,900 Active 358 DOM
-
2026-06-08days on market $49,900 Active 357 DOM
-
2026-06-07days on market $49,900 Active 356 DOM
-
2026-06-04days on market $49,900 Active 353 DOM
-
2026-06-03days on market $49,900 Active 352 DOM
-
2026-06-02days on market $49,900 Active 351 DOM
-
2026-06-01days on market $49,900 Active 350 DOM
-
2026-05-31days on market $49,900 Active 349 DOM
-
2025-09-23price $49,900
-
2025-09-18price $129,000
-
2025-07-11price $159,000
-
2025-06-16$129,000 Active
-
2025-05-09soldstatus $37,000 Closed 263-char remark
Show marketing remark (263 chars)
A Fully renovated Manufactured Home awaits in a 55+ community! Approximate Project Completion Date: 03/31/2025. It is close to public parks, beaches, shopping, restaurants. Don't miss this opportunity to have a piece of beautiful New Port Richey to call your own.
-
2025-05-01status Pending 263-char remark
Show marketing remark (263 chars)
A Fully renovated Manufactured Home awaits in a 55+ community! Approximate Project Completion Date: 03/31/2025. It is close to public parks, beaches, shopping, restaurants. Don't miss this opportunity to have a piece of beautiful New Port Richey to call your own.
-
2025-01-07$129,900 Active 263-char remark
Show marketing remark (263 chars)
A Fully renovated Manufactured Home awaits in a 55+ community! Approximate Project Completion Date: 03/31/2025. It is close to public parks, beaches, shopping, restaurants. Don't miss this opportunity to have a piece of beautiful New Port Richey to call your own.
-
2024-12-17soldstatus $25,000 Closed 199-char remark
Show marketing remark (199 chars)
This charming home with 2 bedrooms and 2 bathrooms single-wide in a 1,509 SqFt lot. This property has great bones. It needs some work. This has been flooded and need to verify any applicable changes.
-
2024-12-02status Pending 199-char remark
Show marketing remark (199 chars)
This charming home with 2 bedrooms and 2 bathrooms single-wide in a 1,509 SqFt lot. This property has great bones. It needs some work. This has been flooded and need to verify any applicable changes.
-
2024-11-18$28,900 Active 199-char remark
Show marketing remark (199 chars)
This charming home with 2 bedrooms and 2 bathrooms single-wide in a 1,509 SqFt lot. This property has great bones. It needs some work. This has been flooded and need to verify any applicable changes.
-
2017-08-31soldstatus $40,000 Sold
-
2017-03-25status Pending
-
2016-09-06$45,900 Active
-
2009-10-01soldstatus $30,000
ⓘ Source: listings_history table (triggers on properties + properties_extension) + one-shot
backfill from property_details.listing_events for pre-trigger history.
Tax reassessment forecast FL · Resets to sale price
- Current annual tax
- $903 · $75/mo
- Projected year-2 tax
- $903 · $75/mo
- Expected delta
- $0/yr ($0/mo · 0.0%)
ⓘ Screening estimate from a state-policy table — verify with the county assessor before closing.
Climate risk First Street
- Flood 9/10 Extreme FEMA zone AE · 99% chance over 30 yrs
- Wildfire 3/10 Moderate
- Heat 10/10 Extreme 7 d/yr ≥109°F today · 27 d/yr by 30 yrs out
- Wind 10/10 Extreme 99% chance of damaging wind over 30 yrs
- Air quality 2/10 Low 1 unhealthy d/yr today · 1 by 30 yrs out
Nearby sold comps map
Loading sold comps map…
Walkable amenities ~0.75 mi
Loading nearby amenities…
Taxation est. · year 1
- Rental income
- $19,085
- − Mortgage interest
- −$2,795
- − Property taxes
- −$903
- − Insurance
- −$5,368
- − Repairs & maintenance
- −$1,527
- − Management
- −$1,527
- − HOA
- −$2,100
- − Depreciation
- −$1,452
- Taxable income
- $3,414
- Est. tax owed @ 24.0%
- −$819
- After-tax cash flow
- $2,747/yr
For passive investors: Depreciation is non-cash, so a rental often shows a tax loss while cash-flowing — sheltering income. Rental losses are passive: they offset passive income freely, and up to $25,000/yr can offset ordinary (W-2) income if you actively participate and your MAGI is under $100k (phasing out to $0 by $150k); unused losses carry forward. On sale, claimed depreciation is recaptured at up to 25%, and gains may owe capital-gains tax (a 1031 exchange can defer both). Figures are a year-1 estimate at your 24.0% rate — not tax advice; consult a CPA.
Schools (NCES district)
- District
- Pasco
- NCES district ID
- 1201530
- Math proficiency
- 50% ▼ -10.00%
- Reading proficiency
- 52% ▼ -5.00%
- Median HH income
- $45,039
- Composite
- 43.14/100
- National rank
- #3074
- State rank
- #32 of 73 in FL
Livability — Beacon Square
- Score
- 66/100
- State rank
- #600
- US rank
- #11494
Category grades
Schools grade is shown separately in the Schools card above.
Census & demographics
- Census place
- Beacon Square, FL
- County
- Pasco County · 524,098 people
- Metro
- Tampa-St. Petersburg-Clearwater, FL
- Population (ZIP)
- 27,444
- Household income
- $56,931
- Rent vs Own
- Severe rent burden
- 1190.0
Population outlook (Pasco County) Hauer SSP2
- Today (2025)
- 570,045 people
- By 2030
- 605,844 · +6.3%
- By 2040
- 674,806 · +18.4%
- By 2050
- 736,022 · +29.1%
- By 2075
- 862,900 · +51.4%
- By 2100
- 906,364 · +59.0%
Race, ethnicity, and origin ACS 2023
- Neighborhood character
- Predominantly White (78%)
- Race & ethnicity
- White 78% Hispanic / Latino 13% Two or more races 9% Black 4%
- Hispanic origin (detail)
- Mexican 3% Puerto Rican 4% Cuban 4%
- Common ancestry
- Romanian 4% Lithuanian 3% Slovak 2%
- Foreign-born
- 9% · Canada
- Languages at home
- 87% English-only · Spanish 9% Other Indo-European 1% Russian/Polish/Slavic 1%
Political lean MEDSL · Pasco
- 2024 margin
- Strong R (+25.2) · D 36.9% · R 62.1% · Other 1.0%
- 2008→2024 swing
- -21.6pp toward R · 2008: -3.6pp · 2024: -25.2pp
- All cycles
- 2024: R+25.2 2020: R+20.1 2016: R+21.6 2012: R+6.7 2008: R+3.6
Not yet ingested
- Civics
- —
Market trends
- HPI YoY
- ▼ -109.49%
- Current HPI
- 310.8347
- Rent YoY
- ▲ 0.72%
- Metro
- Tampa-St. Petersburg-Clearwater, FL
- State GDP YoY
- ▲ 3.28%
- F500 in state
- 36
Industry mix (Fortune 500 HQ in FL)
| Industry | F500 HQs | Revenue |
|---|---|---|
| Industrial Technology | 2 | $29B |
|
||
| Insurance | 2 | $17B |
|
||
| Retail | 1 | $60B |
|
||
| Technology Distribution | 1 | $58B |
|
||
| Homebuilding | 1 | $35B |
|
||
| Technology Manufacturing | 1 | $35B |
|
||
Price history
+66.3% since first listed14 events — show timeline
- 2025-09-23 Price Changed $49,900 Stellar MLS as Distributed by MLS Grid
- 2025-09-18 Price Changed $129,000 Stellar MLS as Distributed by MLS Grid
- 2025-07-11 Price Changed $159,000 Stellar MLS as Distributed by MLS Grid
- 2025-06-16 Listed $129,000 Stellar MLS as Distributed by MLS Grid
- 2025-05-09 Sold (MLS) $37,000 Stellar MLS as Distributed by MLS Grid
- 2025-05-01 Pending — Stellar MLS as Distributed by MLS Grid
- 2025-01-07 Listed $129,900 Stellar MLS as Distributed by MLS Grid
- 2024-12-17 Sold (MLS) $25,000 Stellar MLS as Distributed by MLS Grid
- 2024-12-02 Pending — Stellar MLS as Distributed by MLS Grid
- 2024-11-18 Listed $28,900 Stellar MLS as Distributed by MLS Grid
- 2017-08-31 Sold (MLS) $40,000 Stellar MLS as Distributed by MLS Grid
- 2017-03-25 Pending — Stellar MLS as Distributed by MLS Grid
- 2016-09-06 Listed $45,900 Stellar MLS as Distributed by MLS Grid
- 2009-10-01 Sold (Public Records) $30,000 Public Records
Property tax history
+4.2%/yrLatest (2025): $903 · -24.7% YoY. Source: county tax records.
Cash-flow waterfall
monthlySold comps — $/sqft
last 12 mo · ≤1 miLoading sold comps…