1212 Butte Rd · Loveland, CO
Flood risk 1/10 · Minimal
- FEMA flood zone
- X (unshaded)
- Chance of flooding over 30 yrs
- 0.0%
- Est. flood insurance / yr
- $507 – $1,088
Fire risk 7/10 · Major
- Est. fire insurance / yr
- $939 – $1,743
Heat risk 3/10 · Minor
- Hot days now (above 92°F)
- 7 days/yr
- Hot days in 30 yrs
- 18 days/yr
Wind risk 1/10 · Minimal
- Chance of severe wind over 30 yrs
- —
Air-quality risk 4/10 · Minor
- Unhealthy air days now
- 6 days/yr
- Unhealthy air days in 30 yrs
- 8 days/yr
Risk factors via First Street. Map © Google.
Why this score? — see what drove the B+ grade
The composite is a weighted blend of 9 inputs, each scored 0–100. Each bar is that input's sub-score; the figure is the points it added to the 100-point composite (weight × sub-score).
- Cash flow +30.0/30.0
- ARV discount +15.0/15.0
- 1% rule +10.0/10.0
- DSCR +10.0/10.0
- Livability +3.7/5.0
- Rent growth +3.4/5.0
- Schools +3.4/10.0
- Condition / age +2.5/5.0
- Appreciation +0.0/10.0
$68,000
🖨 Deal sheet 📄 Offer letter ✓ Due diligence
Listing remarks
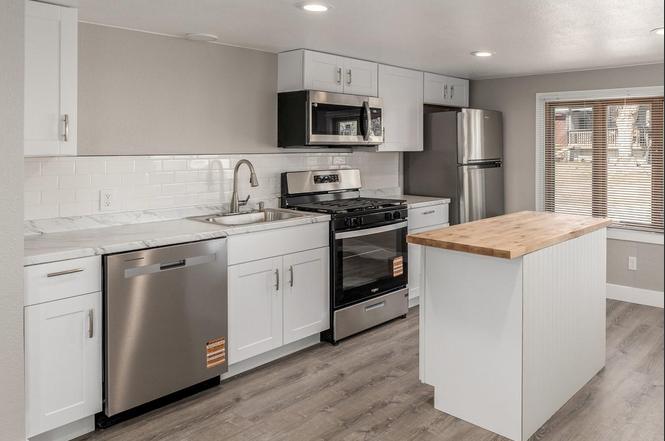
Welcome to this beautifully remodeled home located in Mountainview community. This inviting home offers a bright open floor plan, modern finishes, and comfortable living spaces throughout. Inside you will find a spacious living area filled with natural light, recessed lighting, fresh neutral tones, and durable luxury vinyl flooring that flows seamlessly through the main living areas. The open layout creates a welcoming space ideal for both everyday living and entertaining. The fully remodeled kitchen features white cabinetry, stainless steel appliances, subway tile backsplash, generous counter space, and a center island with butcher block top with eat in space—perfect for meal pr
Key facts
- Waterfall tub faucet
- Remodeled home
- 2 parking spots
Tags
Property features AI
Finance
- Other: Property area 728 (public records)
- Financial info: Monthly land lease: $660
- HOA & community: Association: Mountainview Mobile Home Park (professionally managed); Association contact phone available
Exterior
- Parking: Two off-street parking spaces (total 2)
- Utilities: Public sewer
- Home design: Manufactured home in park; Single-story (main level living); Model 7663; Owned by corporation/trust
- Construction: Wood siding construction; Manufactured home (52' x 14')
- Exterior features: Metal roof; Located in Mountainview Mobile Home Park (lot 55); Land lease in effect (monthly land lease of $660; lease expires March 31, 2026)
Interior
- Kitchen: Includes dishwasher, microwave, oven, range, refrigerator
- Bedrooms: Two bedrooms on the main level; Primary suite on the main level
- Bathrooms: One full bathroom on the main level; En suite bathroom in the primary suite
- Heating & cooling: Forced air heating
- Interior features: Dishwasher; Microwave; Oven; Range; Refrigerator
Neighborhood map
What this means for you Summary
Snapshot
- This is a 1-bed/1.0-bath manufactured listed at $68k.
Deal economics
- At list price, monthly cash flow is $690 ($8k/yr) — positive.
- The deal already cash-flows at list — no discount required.
- Meets the 1% rule at list price ($1k rent vs $68k).
- Recommended offer: $62k (9.0% below list) — sets the bar for market timing.
- Cap rate 18.5% vs local median 2.9% in Loveland — top-decile yield for the area; either an underpriced asset or a hidden risk that comps aren't pricing in. Stress-test before assuming the spread holds.
Location & tenants
- Location reads 73/100 on livability (#52 in CO) — a middle-class / working-renter tenant base. Strengths: housing A+, health & safety A+, amenities A; Watch: crime C-, commute F, cost of living F.
- Thompson School District R-2J (suburban): math 28% / reading 48% proficiency, ranked #28 of 86 in CO (top 33%) — families likely to look elsewhere, expect single-tenant / working-renter base with shorter leases.
- Zoned schools: Namaqua Elementary School (math 34% / reading 37%, grade F, #422 of 966 statewide, top 44%, 252 students, 36% FRL); Walt Clark Middle School (math 24% / reading 32%, grade F, #145 of 270 statewide, top 55%, 366 students, 38% FRL); Thompson Valley High School (math 37% / reading 62%, grade D, #115 of 381 statewide, top 34%, 1,039 students, 31% FRL).
- Market conditions: Rents rising (+3.6%/yr); 283 active listings in the ZIP; 1 comparable units currently listed for rent nearby; solid renter incomes; 1,786 units permitted in Larimer County in 2024 (402 in 5+ unit buildings).
Forward outlook
- Local home prices are declining (-3.0%/yr); year-one equity from $470 of loan paydown is wiped out by about $2k of value loss. Plan a longer hold.
- Larimer County population projected at +51% by 2050 — long-run rental-demand tailwind backs the buy-and-hold thesis.
- At projected returns (-3.0% appreciation + 3.6% rent growth), your $19k cash investment doubles in ~3 years — after that, you're playing with house money.
Negotiation context
- It's been on market 98 days — a 9% lower offer ($62k) is reasonable based on typical stale-listing flexibility.
- 4 sale attempts since 2y ago; this cycle's ask has dropped $15k (18%) from the opening price — seller is motivated, your offer sets the floor, not the list.
Risks & watch-outs
- Climate carrying-cost: major wildfire risk — expect insurance premiums to compound above CPI over the hold.
Questions for the listing agent
- It's been on market 98 days. Have you received any prior offers? Is the seller open to a 9% concession, seller financing, or rate buy-down credit?
- Built in 1977 — when were the roof, HVAC, electrical panel, plumbing, and water heater last replaced?
- Why hasn't it sold? Are there any deal-killer items the seller is aware of (foundation, flood, title, zoning, code violations)?
- Is there a deadline driving the sale (1031 exchange, divorce, estate, relocation)? That informs how much negotiation room exists.
- What's the average days-on-market for RENTAL listings here right now (not sales)? A rising rental-DOM trend means longer vacancies and softer asking-rent achievability than the comps imply.
- What's the recent tenant-quality profile in this submarket — average credit score on applications, eviction rate, late-payment / NSF rate, and stable-employment percentage? A property-management company in the area should have these aggregated.
- How much new for-sale + rental construction is in the pipeline within 1–3 miles? Heavy new supply typically softens prices + rents 12–24 months out; constrained supply supports both.
Investment metrics
- 1% rule
- 2.16% ✓
- Cap rate
- 18.48%
- Cash-on-cash
- 43.51%
- DSCR
- 2.94
- GRM
- 3.9
CMA / ARV
- ARV (on-the-fly)
- $109,760
- Comps found
- 4
Show comp detail 4 sales within ~0.75 mi
| Address | Dist | Beds/Ba | Sqft | Sold | Price | $/sf | Match |
|---|---|---|---|---|---|---|---|
| 1212 Butte Rd #20 | 0.00mi | 2/1.0 (+1) | 728 (-7%) | 3mo | $28,500 | $39 | 80 |
| 1212 Butte Rd #34 | 0.00mi | 2/2.0 (+1) | 784 (0%) | 15mo | $109,500 | $140 | 79 |
| 1212 Butte Rd #27 | 0.00mi | 2/1.0 (+1) | 728 (-7%) | 6mo | $56,900 | $78 | 78 |
| 1212 Butte Rd #18 | 0.00mi | 2/1.0 (+1) | 728 (-7%) | 19mo | $127,500 | $175 | 67 |
Match score weights: distance 35% · size 25% · config 20% · recency 20%. Top-matched comps best support the ARV.
Projected returns pro-forma
-3.0% appreciation · 3.57% rent growth · sell at horizon
- IRR
- 41.0%
- Equity multiple
- 2.78×
- Total profit
- $33,821
- Equity at exit
- $10,139
- IRR
- 47.6%
- Equity multiple
- 5.71×
- Total profit
- $89,677
- Equity at exit
- $5,879
Cash invested: $19,040 (down + closing). Projections, not guarantees.
Landlord ↔ Tenant lean methodology
- Overall (STATE)
- 38 Tenant-Leaning
- State Colorado
- 38 Tenant-Leaning · D+4
- County
- — inherits STATE
- City
- — inherits STATE
ZIP-level market 80537
- Rents YoY
- 3.6%
- Active inventory
- 283
- Price-to-rent
- 3.9×
Monthly cashflow live
- Estimated rent
- $1,469 medium interval (Pro) →
- Mortgage (P&I)
- −$357
- Tax est. 1.5%
- −$85 /mo · $1,020/yr
- Insurance
- −$28
- HOA
- −$0
- Vacancy / Maint / Mgmt
- −$308
- Net cashflow
- $690
Break-even live
UW: 25.0% down · 7.5% · 30yr · 1.5% tax · 5.0% vac · 8.0% maint · 8.0% mgmt
Financing live
Cash to close
- Down payment
- $17,000
- Closing costs
- $2,040
- Reserves months
- —
- Total cash needed
- —
Loan-product check · same deal, 3 products live
Conventional
25% down · 7.5% · 30yr
- Down + closing
- —
- Monthly P&I
- —
- Monthly cashflow
- —
- DSCR
- —
- Eligible?
- —
Personal DTI + credit; lowest rate.
DSCR
20% down · 8.5% · 30yr
- Down + closing
- —
- Monthly P&I
- —
- Monthly cashflow
- —
- DSCR
- —
- Eligible?
- —
No personal income docs; deal must DSCR.
Hard money
10% down · 12.0% · 12mo
- Down + closing
- —
- Monthly P&I
- —
- Monthly cashflow
- —
- DSCR
- —
- Eligible?
- —
Short-term bridge; refi at stabilization.
Rent comps 1 comps
| Address | Beds | Baths | Sqft | Rent | $/sqft | DOM | Units | Dist |
|---|---|---|---|---|---|---|---|---|
| 1751 Wilson Ave Loveland, CO | 2.0 | 1.5 | 995 | $1,745 | $1.75 | 23d | 3 | 1.37mi |
Listing history 26 events
-
2026-06-18days on market $68,000 Active 98 DOM
-
2026-06-17days on market $68,000 Active 97 DOM
-
2026-06-16days on market $68,000 Active 96 DOM
-
2026-06-15days on market $68,000 Active 95 DOM
-
2026-06-14days on market $68,000 Active 93 DOM
-
2026-06-13days on market $68,000 Active 92 DOM
-
2026-06-10days on market $68,000 Active 90 DOM
-
2026-06-09days on market $68,000 Active 89 DOM
-
2026-06-08days on market $68,000 Active 88 DOM
-
2026-06-07days on market $68,000 Active 87 DOM
-
2026-06-03days on market $68,000 Active 83 DOM
-
2026-06-02days on market $68,000 Active 82 DOM
-
2026-06-01days on market $68,000 Active 81 DOM
-
2026-05-31days on market $68,000 Active 80 DOM
-
2026-05-30days on market $68,000 Active 79 DOM
-
2026-05-22price $68,000
-
2026-04-19price $79,000
-
2026-04-03price $82,000
-
2026-03-30price $81,000
-
2026-03-12$83,000 Active
-
2025-04-24historical $1,600
-
2025-02-22$1,600
-
2024-04-18historical $1,490
-
2024-04-12$1,490
-
2024-04-10historical $1,490
-
2024-03-13$1,490
ⓘ Source: listings_history table (triggers on properties + properties_extension) + one-shot
backfill from property_details.listing_events for pre-trigger history.
Climate risk First Street
- Flood 1/10 Low FEMA zone X (unshaded) · 0% chance over 30 yrs
- Wildfire 7/10 Severe
- Heat 3/10 Moderate 7 d/yr ≥92°F today · 18 d/yr by 30 yrs out
- Wind 1/10 Low
- Air quality 4/10 Moderate 6 unhealthy d/yr today · 8 by 30 yrs out
Nearby sold comps map
Loading sold comps map…
Walkable amenities ~0.75 mi
Loading nearby amenities…
Taxation est. · year 1
- Rental income
- $17,625
- − Mortgage interest
- −$3,809
- − Property taxes
- −$1,020
- − Insurance
- −$340
- − Repairs & maintenance
- −$1,410
- − Management
- −$1,410
- − Depreciation
- −$1,978
- Taxable income
- $7,658
- Est. tax owed @ 24.0%
- −$1,838
- After-tax cash flow
- $6,447/yr
For passive investors: Depreciation is non-cash, so a rental often shows a tax loss while cash-flowing — sheltering income. Rental losses are passive: they offset passive income freely, and up to $25,000/yr can offset ordinary (W-2) income if you actively participate and your MAGI is under $100k (phasing out to $0 by $150k); unused losses carry forward. On sale, claimed depreciation is recaptured at up to 25%, and gains may owe capital-gains tax (a 1031 exchange can defer both). Figures are a year-1 estimate at your 24.0% rate — not tax advice; consult a CPA.
Schools (NCES district)
- District
- Thompson School District R-2J
- NCES district ID
- 0805400
- Math proficiency
- 28% ▼ -7.00%
- Reading proficiency
- 48% ▬ 0.00%
- Median HH income
- $63,040
- Composite
- 34.01/100
- National rank
- #5313
- State rank
- #28 of 86 in CO
Livability — Loveland
- Score
- 73/100
- State rank
- #52
- US rank
- #5353
Category grades
Schools grade is shown separately in the Schools card above.
Census & demographics
- County
- Larimer County · 338,255 people
- City population
- 94,535
- Metro
- Fort Collins, CO
- Population (ZIP)
- 44,425
- Household income
- $86,325
- Rent vs Own
- Severe rent burden
- 1703.0
Population outlook (Larimer County) Hauer SSP2
- Today (2025)
- 415,361 people
- By 2030
- 457,762 · +10.2%
- By 2040
- 542,310 · +30.6%
- By 2050
- 627,048 · +51.0%
- By 2075
- 833,722 · +100.7%
- By 2100
- 952,590 · +129.3%
Race, ethnicity, and origin ACS 2023
- Neighborhood character
- Predominantly White (83%)
- Race & ethnicity
- White 83% Hispanic / Latino 12% Two or more races 8%
- Hispanic origin (detail)
- Mexican 10%
- Common ancestry
- Slovak 4% Italian 3% Lithuanian 3%
- Foreign-born
- 3% · Canada
- Languages at home
- 95% English-only · Spanish 4%
Political lean MEDSL · Larimer
- 2024 margin
- D (+17.6) · D 57.4% · R 39.8% · Other 2.9%
- 2008→2024 swing
- +7.9pp toward D · 2008: 9.7pp · 2024: 17.6pp
- All cycles
- 2024: D+17.6 2020: D+15.4 2016: D+4.9 2012: D+5.2 2008: D+9.7
Not yet ingested
- Civics
- —
Market trends
- HPI YoY
- ▼ -606.26%
- Current HPI
- 253.4939
- Rent YoY
- ▲ 3.57%
- Metro
- Fort Collins, CO
- State GDP YoY
- ▲ 1.95%
- F500 in state
- 14
Industry mix (Fortune 500 HQ in CO)
| Industry | F500 HQs | Revenue |
|---|---|---|
| Technology Distribution | 1 | $31B |
|
||
| Food / Agriculture | 1 | $18B |
|
||
| Packaging | 1 | $14B |
|
||
| Healthcare | 1 | $13B |
|
||
| Energy | 1 | $10B |
|
||
| Technology | 1 | $4B |
|
||
Price history
+4463.8% since first listed11 events — show timeline
- 2026-05-22 Price Changed $68,000 REColorado as Distributed by MLS Grid
- 2026-04-19 Price Changed $79,000 REColorado as Distributed by MLS Grid
- 2026-04-03 Price Changed $82,000 REColorado as Distributed by MLS Grid
- 2026-03-30 Price Changed $81,000 REColorado as Distributed by MLS Grid
- 2026-03-12 Listed $83,000 REColorado as Distributed by MLS Grid
- 2025-04-24 Rental Removed $1,600 RENTALBEAST
- 2025-02-22 Listed for Rent $1,600 RENTALBEAST
- 2024-04-18 Rental Removed $1,490 APPFOLIO
- 2024-04-12 Listed for Rent $1,490 APPFOLIO
- 2024-04-10 Rental Removed $1,490 APPFOLIO
- 2024-03-13 Listed for Rent $1,490 APPFOLIO
Property tax history
+3.1%/yrLatest (2021): $22 · +0.0% YoY. Source: county tax records.
Cash-flow waterfall
monthlySold comps — $/sqft
last 12 mo · ≤1 miLoading sold comps…