103 Locust Lake Dr · Conashaugh Lakes, PA
Flood risk 1/10 · Minimal
- FEMA flood zone
- X (unshaded)
- Chance of flooding over 30 yrs
- 0.0%
- Est. flood insurance / yr
- $507 – $1,088
Fire risk 4/10 · Minor
- Est. fire insurance / yr
- $511 – $949
Heat risk 2/10 · Minimal
- Hot days now (above 91°F)
- 7 days/yr
- Hot days in 30 yrs
- 15 days/yr
Wind risk 3/10 · Minor
- Chance of severe wind over 30 yrs
- 6.0%
Air-quality risk 2/10 · Minimal
- Unhealthy air days now
- 1 days/yr
- Unhealthy air days in 30 yrs
- 2 days/yr
Risk factors via First Street. Map © Google.
Why this score? — see what drove the C+ grade
The composite is a weighted blend of 9 inputs, each scored 0–100. Each bar is that input's sub-score; the figure is the points it added to the 100-point composite (weight × sub-score).
- Cash flow +30.0/30.0
- 1% rule +10.0/10.0
- DSCR +10.0/10.0
- Schools +4.7/10.0
- Livability +3.5/5.0
- Rent growth +2.5/5.0
- Condition / age +2.2/5.0
- ARV discount +0.0/15.0
- Appreciation +0.0/10.0
$59,900
🖨 Deal sheet 📄 Offer letter ✓ Due diligence
Listing remarks
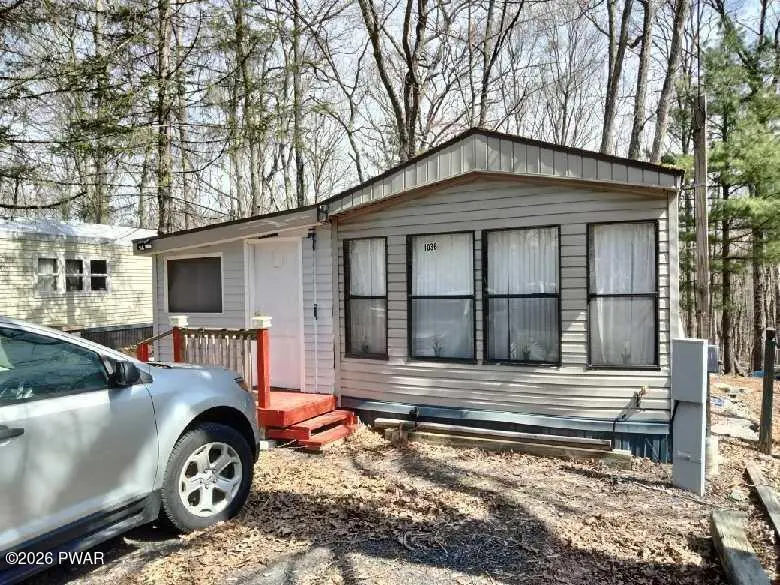
1036 LOCUST LAKE DR (911 103 LOCUST LAKE DR) 2 BEDROOM PARK MODEL WITH A PERMANENT SCREEN ROOM ON A 50 AMP STATE FOREST CAMPSITE FOR GREATER PRIVACY AND NO NEIGHBORS TO THE REAR OF THE PROPERTY. EXLCUSIVE. THE PROPERTY ALSO HAS A SHED AND SOFT TOP SCREEN ROOM ON THE REAR TENT PLATFORM. FURNACE OPERABLE & WINDOW AC $69,900.00
Key facts
- Shed
- Soft top screen room
- Rear tent platform
Tags
Property features AI
Finance
- Financial info: Annual tax amount: $240.91
- HOA & community: Has a homeowners association; Seasonal association fee of $2,800
Exterior
- Home design: Residential property listed as Vacation RV/Trailer; Commercial zoning
- Construction: 400 square feet of above-grade finished area
- Exterior features: Located in the Lake Adventure subdivision; Directions: From the front gate proceed straight taking the 3rd right onto Village Dr East, continue until Locust Lake Dr and turn left; property is the second campsite on the right bordering the state forest
Interior
- Bathrooms: One full bathroom
- Interior features: Total of 4 rooms; 1 full bathroom
Neighborhood map
What this means for you Summary
Snapshot
- This is a 2-bed/1.0-bath single-family listed at $60k. Condition is rated fair.
Deal economics
- At list price, monthly cash flow is $633 ($8k/yr) — positive.
- The deal already cash-flows at list — no discount required.
- Meets the 1% rule at list price ($2k rent vs $60k).
- Recommended offer: $59k (1.5% below list) — sets the bar for market timing.
- Cap rate 19.0% vs local median 5.3% in Conashaugh Lakes — top-decile yield for the area; either an underpriced asset or a hidden risk that comps aren't pricing in. Stress-test before assuming the spread holds.
Location & tenants
- Location reads 70/100 on livability (#786 in PA) — a middle-class / working-renter tenant base. Strengths: crime A+, employment A+, housing A+; Watch: health & safety D, amenities F, commute F.
- Delaware Valley SD (rural): math 41% / reading 66% proficiency, ranked #121 of 539 in PA (top 22%) — acceptable for families but not a draw, mixed tenant base, ~2y average lease.
- Market conditions: 290 active listings in the ZIP; solid renter incomes; 213 units permitted in Pike County in 2024 (0 in 5+ unit buildings).
Forward outlook
- Local home prices are declining (-3.0%/yr); year-one equity from $414 of loan paydown is wiped out by about $2k of value loss. Plan a longer hold.
- Pike County population projected at -25% by 2050 — secular population decline; favor cash flow + early exit over multi-decade hold.
- At projected returns (-3.0% appreciation + 3.0% rent growth), your $17k cash investment doubles in ~3 years — after that, you're playing with house money.
Negotiation context
- It's been on market 27 days — a 2% lower offer ($59k) is reasonable based on typical stale-listing flexibility.
Questions for the listing agent
- Have any recent inspections been done? Can we get a copy of the seller's disclosures and any deferred-maintenance estimates?
- What does the HOA fee cover, when was the last increase, and are there any pending special assessments or reserve-fund shortfalls?
- Is there a deadline driving the sale (1031 exchange, divorce, estate, relocation)? That informs how much negotiation room exists.
- What's the average days-on-market for RENTAL listings here right now (not sales)? A rising rental-DOM trend means longer vacancies and softer asking-rent achievability than the comps imply.
- What's the recent tenant-quality profile in this submarket — average credit score on applications, eviction rate, late-payment / NSF rate, and stable-employment percentage? A property-management company in the area should have these aggregated.
- How much new for-sale + rental construction is in the pipeline within 1–3 miles? Heavy new supply typically softens prices + rents 12–24 months out; constrained supply supports both.
Investment metrics
- 1% rule
- 2.70% ✓
- Cap rate
- 18.98%
- Cash-on-cash
- 45.29%
- DSCR
- 3.02
- GRM
- 3.1
CMA / ARV
- ARV (on-the-fly)
- $42,400
- Comps found
- 12
Show comp detail 12 sales within ~0.75 mi
| Address | Dist | Beds/Ba | Sqft | Sold | Price | $/sf | Match |
|---|---|---|---|---|---|---|---|
| 131 Bobcat Dr | 0.40mi | 1/1.0 (-1) | 399 (-0%) | 4mo | $84,000 | $211 | 73 |
| 114 Glenwood Landing Lndg | 0.48mi | 2/1.0 | 407 (+2%) | 3mo | $36,457 | $90 | 72 |
| 102 Lake Dr N #1772 | 0.33mi | 2/1.0 | 385 (-4%) | 8mo | $91,500 | $238 | 72 |
| 121 Birchy Brook Dr | 0.17mi | 2/1.0 | 340 (-15%) | 3mo | $36,000 | $106 | 65 |
| 154 Village Dr W | 0.61mi | 2/1.0 | 400 (0%) | 10mo | $40,000 | $100 | 63 |
| 126 Deer Run | 0.66mi | 2/1.0 | 400 (0%) | 10mo | $109,000 | $273 | 61 |
| 120 Forest Glen Dr | 0.74mi | 3/1.0 (+1) | 400 (0%) | 0mo | $40,000 | $100 | 60 |
| 224 Locust Lake Dr | 0.53mi | 2/1.0 | 360 (-10%) | 2mo | $40,000 | $111 | 57 |
| 216 Village Dr W | 0.38mi | 2/1.0 | 345 (-14%) | 6mo | $62,000 | $180 | 54 |
| 104 Glenwood Lndg | 0.48mi | 1/1.0 (-1) | 340 (-15%) | 0mo | $11,000 | $32 | 47 |
| 109 Bobcat Dr | 0.44mi | 1/1.0 (-1) | 450 (+12%) | 11mo | $38,500 | $86 | 45 |
| 140 Blue Aspen Dr | 0.72mi | 2/1.0 | 350 (-12%) | 9mo | $24,000 | $69 | 38 |
Match score weights: distance 35% · size 25% · config 20% · recency 20%. Top-matched comps best support the ARV.
Projected returns pro-forma
-3.0% appreciation · 3.0% rent growth · sell at horizon
- IRR
- 42.5%
- Equity multiple
- 2.84×
- Total profit
- $30,781
- Equity at exit
- $8,931
- IRR
- 48.7%
- Equity multiple
- 5.73×
- Total profit
- $79,402
- Equity at exit
- $5,179
Cash invested: $16,772 (down + closing). Projections, not guarantees.
Landlord ↔ Tenant lean methodology
- Overall (STATE)
- 62 Landlord-Friendly
- State Pennsylvania
- 62 Landlord-Friendly · EVEN
- County
- — inherits STATE
- City
- — inherits STATE
ZIP-level market 18337
- Home prices YoY
- -22.0%
- Active inventory
- 290
- Price-to-rent
- 3.1×
Monthly cashflow live
- Estimated rent
- $1,620 medium interval (Pro) →
- Mortgage (P&I)
- −$314
- Tax est. 1.5%
- −$75 /mo · $898/yr
- Insurance
- −$25
- HOA
- −$233
- Vacancy / Maint / Mgmt
- −$340
- Net cashflow
- $633
Break-even live
UW: 25.0% down · 7.5% · 30yr · 1.5% tax · 5.0% vac · 8.0% maint · 8.0% mgmt
Financing live
Cash to close
- Down payment
- $14,975
- Closing costs
- $1,797
- Reserves months
- —
- Total cash needed
- —
Loan-product check · same deal, 3 products live
Conventional
25% down · 7.5% · 30yr
- Down + closing
- —
- Monthly P&I
- —
- Monthly cashflow
- —
- DSCR
- —
- Eligible?
- —
Personal DTI + credit; lowest rate.
DSCR
20% down · 8.5% · 30yr
- Down + closing
- —
- Monthly P&I
- —
- Monthly cashflow
- —
- DSCR
- —
- Eligible?
- —
No personal income docs; deal must DSCR.
Hard money
10% down · 12.0% · 12mo
- Down + closing
- —
- Monthly P&I
- —
- Monthly cashflow
- —
- DSCR
- —
- Eligible?
- —
Short-term bridge; refi at stabilization.
HOA detail
- Monthly dues
- $233 · $2,796/yr
Listing history 16 events
-
2026-06-18price $59,900 Active 27 DOM
-
2026-06-18days on market $69,900 Active 27 DOM
-
2026-06-17days on market $69,900 Active 26 DOM
-
2026-06-16days on market $69,900 Active 25 DOM
-
2026-06-15days on market $69,900 Active 24 DOM
-
2026-06-13days on market $69,900 Active 22 DOM
-
2026-06-13days on market $69,900 Active 21 DOM
-
2026-06-09days on market $69,900 Active 18 DOM
-
2026-06-08days on market $69,900 Active 17 DOM
-
2026-06-07days on market $69,900 Active 16 DOM
-
2026-06-04days on market $69,900 Active 13 DOM
-
2026-06-03days on market $69,900 Active 12 DOM
-
2026-06-02days on market $69,900 Active 11 DOM
-
2026-06-01days on market $69,900 Active 10 DOM
-
2026-05-31days on market $69,900 Active 9 DOM
-
2026-05-22$69,900 Active
ⓘ Source: listings_history table (triggers on properties + properties_extension) + one-shot
backfill from property_details.listing_events for pre-trigger history.
Climate risk First Street
- Flood 1/10 Low FEMA zone X (unshaded) · 0% chance over 30 yrs
- Wildfire 4/10 Moderate
- Heat 2/10 Low 7 d/yr ≥91°F today · 15 d/yr by 30 yrs out
- Wind 3/10 Moderate 6% chance of damaging wind over 30 yrs
- Air quality 2/10 Low 1 unhealthy d/yr today · 2 by 30 yrs out
Nearby sold comps map
Loading sold comps map…
Walkable amenities ~0.75 mi
Loading nearby amenities…
Taxation est. · year 1
- Rental income
- $19,443
- − Mortgage interest
- −$3,355
- − Property taxes
- −$898
- − Insurance
- −$300
- − Repairs & maintenance
- −$1,555
- − Management
- −$1,555
- − HOA
- −$2,796
- − Depreciation
- −$1,743
- Taxable income
- $7,240
- Est. tax owed @ 24.0%
- −$1,738
- After-tax cash flow
- $5,859/yr
For passive investors: Depreciation is non-cash, so a rental often shows a tax loss while cash-flowing — sheltering income. Rental losses are passive: they offset passive income freely, and up to $25,000/yr can offset ordinary (W-2) income if you actively participate and your MAGI is under $100k (phasing out to $0 by $150k); unused losses carry forward. On sale, claimed depreciation is recaptured at up to 25%, and gains may owe capital-gains tax (a 1031 exchange can defer both). Figures are a year-1 estimate at your 24.0% rate — not tax advice; consult a CPA.
Condition & rehab AI · 18 photos
This mobile home requires significant repairs and updates to its exterior, interior, and appliances to improve its condition and value.
Repairs flagged
- Major Foundation — Significant damage visible
- Major Exterior siding — Weathered and damaged
- Major Flooring — Worn and damaged
- Major Interior walls/paint — Worn and damaged
- Major Bathrooms — Worn fixtures and damage
- Major Kitchen — Worn appliances and damage
Value-add opportunities
- Both Painting and updating fixtures — Enhances curb appeal and interior aesthetics
- Both Flooring replacement — Improves comfort and durability
- Both Appliance repair and replacement — Enhances functionality and appeal
Renovation cost estimate screening
| Repair item | Severity | Est. cost |
|---|---|---|
| Foundation · Significant damage visible | Major | $15,000–50,000 |
| Exterior siding · Weathered and damaged | Major | $15,000–50,000 |
| Flooring · Worn and damaged | Major | $15,000–50,000 |
| Interior walls/paint · Worn and damaged | Major | $15,000–50,000 |
| Bathrooms · Worn fixtures and damage | Major | $15,000–50,000 |
| Kitchen · Worn appliances and damage | Major | $15,000–50,000 |
| Total estimated repair cost · 6 items | $90,000–300,000 |
Value-add ROI direction
- Both Painting and updating fixtures — Enhances curb appeal and interior aesthetics ↑
- Both Flooring replacement — Improves comfort and durability ↑
- Both Appliance repair and replacement — Enhances functionality and appeal ↑
ⓘ Cost ranges are severity-bucket heuristics (US national rule-of-thumb). Get contractor quotes + a written scope before underwriting a rehab budget.
Schools (NCES district)
- District
- Delaware Valley SD
- NCES district ID
- 4207530
- Math proficiency
- 41% ▼ -12.00%
- Reading proficiency
- 66% ▼ -9.00%
- Median HH income
- $64,202
- Composite
- 46.95/100
- National rank
- #2359
- State rank
- #121 of 539 in PA
Livability — Conashaugh Lakes
- Score
- 70/100
- State rank
- #786
- US rank
- #7924
Category grades
Schools grade is shown separately in the Schools card above.
Census & demographics
- County
- Pike County · 15,799 people
- Metro
- New York-Newark-Jersey City, NY-NJ-PA
- Population (ZIP)
- 15,799
- Household income
- $93,149
- Rent vs Own
- Severe rent burden
- 275.0
Population outlook (Pike County) Hauer SSP2
- Today (2025)
- 53,548 people
- By 2030
- 51,622 · -3.6%
- By 2040
- 46,490 · -13.2%
- By 2050
- 40,372 · -24.6%
- By 2075
- 31,951 · -40.3%
- By 2100
- 26,821 · -49.9%
Race, ethnicity, and origin ACS 2023
- Neighborhood character
- Predominantly White (82%)
- Race & ethnicity
- White 82% Hispanic / Latino 10% Two or more races 7% Black 4% Asian 2%
- Hispanic origin (detail)
- Mexican 1% Puerto Rican 4% Cuban 1%
- Common ancestry
- Romanian 6% Iranian 2% Portuguese 2%
- Foreign-born
- 6% · Canada, China, South Korea
- Languages at home
- 89% English-only · Spanish 6% Russian/Polish/Slavic 2% German/W. Germanic 1%
Political lean MEDSL · Pike
- 2024 margin
- Strong R (+24.1) · D 37.6% · R 61.6%
- 2008→2024 swing
- -19.8pp toward R · 2008: -4.2pp · 2024: -24.1pp
- All cycles
- 2024: R+24.1 2020: R+19.0 2016: R+26.0 2012: R+11.0 2008: R+4.2
Not yet ingested
- Civics
- —
Market trends
- HPI YoY
- ▼ -54.81%
- Current HPI
- 194.0604
- Rent YoY
- —
- Metro
- New York-Newark-Jersey City, NY-NJ-PA
- State GDP YoY
- ▲ 1.68%
- F500 in state
- 34
Industry mix (Fortune 500 HQ in PA)
| Industry | F500 HQs | Revenue |
|---|---|---|
| Healthcare | 2 | $309B |
|
||
| Insurance | 2 | $27B |
|
||
| Telecommunications / Media | 1 | $124B |
|
||
| Industrial Distribution | 1 | $22B |
|
||
| Financial Services | 1 | $20B |
|
||
| Chemicals / Materials | 1 | $18B |
|
||
Price history
1 event — show timeline
- 2026-05-22 Listed $69,900 PWMLS
Cash-flow waterfall
monthlySold comps — $/sqft
last 12 mo · ≤1 miLoading sold comps…