 Multi-family
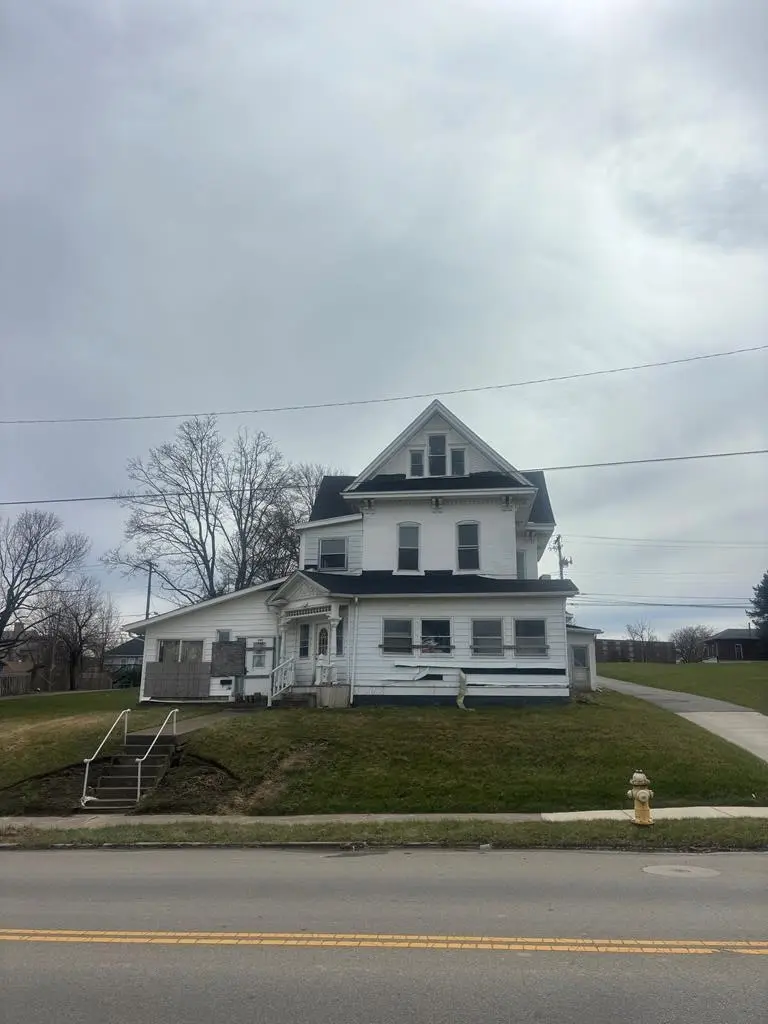
245 W Fourth St · Mansfield, OH
Flood risk No data
- FEMA flood zone
- —
- Chance of flooding over 30 yrs
- —
- Est. flood insurance / yr
- —
Fire risk No data
- Est. fire insurance / yr
- —
Heat risk No data
- Hot days now (above threshold)
- —
- Hot days in 30 yrs
- —
Wind risk No data
- Chance of severe wind over 30 yrs
- —
Air-quality risk No data
- Unhealthy air days now
- —
- Unhealthy air days in 30 yrs
- —
Risk factors via First Street. Map © Google.
Why this score? — see what drove the C grade
The composite is a weighted blend of 9 inputs, each scored 0–100. Each bar is that input's sub-score; the figure is the points it added to the 100-point composite (weight × sub-score).
- Cash flow +20.0/30.0
- ARV discount +15.0/15.0
- DSCR +6.3/10.0
- 1% rule +5.3/10.0
- Livability +3.8/5.0
- Rent growth +2.5/5.0
- Schools +2.3/10.0
- Condition / age +2.2/5.0
- Appreciation +0.0/10.0
$79,900
🖨 Deal sheet 📄 Offer letter ✓ Due diligence
Multi-family units
County records classify this as Multi-Family (2-4 Unit). Listing-text estimate: 1 unit. estimate disagrees with records
Listing remarks MLS
INVESTORS! Come bring your ideas to life with this multi-family opportunity situated in the Mansfield City School district! This property is poised to be realized & added to your portfolio! Some updates have already been completed in the last couple of years, including a roof, some plumbing, two new water heaters, some newer electrical, a new gas line for the stove, & a new water line for the property! The rest is ready for you to implement your vision! The property has a mixed use of multi-family/commercial. Come on in & bring this property back to its full potential!
Key facts
- New water line
- Updates completed
- New water heaters
Tags
Neighborhood map
What this means for you Summary
Snapshot
- This is a multifamily listed at $80k. Condition is rated fair.
Deal economics
- At list price, monthly cash flow is $97 ($1k/yr) — positive.
- The deal already cash-flows at list — no discount required.
- Meets the 1% rule at list price ($822 rent vs $80k).
- Recommended offer: $75k (6.0% below list) — sets the bar for market timing.
- Cap rate 7.8% vs local median 4.2% in Mansfield — top-decile yield for the area; either an underpriced asset or a hidden risk that comps aren't pricing in. Stress-test before assuming the spread holds.
Location & tenants
- Location reads 76/100 on livability (#224 in OH, #3,525 nationally) — a middle-class / working-renter tenant base. Strengths: commute A+, cost of living A+, housing A+; Watch: schools C-, crime D-, amenities D-.
- Mansfield City (urban): math 24% / reading 33% proficiency, ranked #590 of 656 in OH (top 90%) — low school quality limits family demand, transient renter base, plan for 1-2y turnover; 80% free/reduced lunch — lower-income household profile, screen leases tightly.
- Market conditions: 122 active listings in the ZIP; 16 comparable units currently listed for rent nearby; rentals lingering (median 44d on market — plan ~5-8 weeks vacancy on turnover, expect pricing pressure); 100% of comp listings sitting > 30 days — soft ceiling on asking rent; 145 units permitted in Richland County in 2024 (0 in 5+ unit buildings).
- This rent is only 15% of the median local income ($65k/yr) — well below the 30% rent-burden line; pricing power to push rent on renewal without tenant pushback.
Forward outlook
- Local home prices are declining (-3.0%/yr); year-one equity from $552 of loan paydown is wiped out by about $2k of value loss. Plan a longer hold.
- Richland County population projected at -18% by 2050 — secular population decline; favor cash flow + early exit over multi-decade hold.
Negotiation context
- It's been on market 66 days — a 6% lower offer ($75k) is reasonable based on typical stale-listing flexibility.
Risks & watch-outs
- Watch-outs: built in 1900 — expect roof / HVAC / electrical / plumbing capex.
Questions for the listing agent
- It's been on market 66 days. Have you received any prior offers? Is the seller open to a 6% concession, seller financing, or rate buy-down credit?
- Have any recent inspections been done? Can we get a copy of the seller's disclosures and any deferred-maintenance estimates?
- Built in 1900 — when were the roof, HVAC, electrical panel, plumbing, and water heater last replaced?
- Why hasn't it sold? Are there any deal-killer items the seller is aware of (foundation, flood, title, zoning, code violations)?
- Is there a deadline driving the sale (1031 exchange, divorce, estate, relocation)? That informs how much negotiation room exists.
- Crime grade is D in this area — have there been break-ins, vandalism, or insurance claims at this property in the last 3 years? What carrier currently insures it and at what premium?
- What's the average days-on-market for RENTAL listings here right now (not sales)? A rising rental-DOM trend means longer vacancies and softer asking-rent achievability than the comps imply.
- What's the recent tenant-quality profile in this submarket — average credit score on applications, eviction rate, late-payment / NSF rate, and stable-employment percentage? A property-management company in the area should have these aggregated.
- How much new apartment / multifamily construction is in the pipeline within 1–3 miles? Heavy new supply (>2% of stock underway) typically softens rents 12–24 months out; light construction supports rent growth.
Investment metrics
- 1% rule
- 1.03% ✓
- Cap rate
- 7.75%
- Cash-on-cash
- 5.22%
- DSCR
- 1.23
- GRM
- 8.1
CMA / ARV
- ARV (median comp)
- $111,423
- List price
- $79,900
- Delta
- -28.29%
- Verdict
- UNDERPRICED
- Comps
- 11 within 1.0 mi
Show comp detail 12 sales within ~0.75 mi
| Address | Dist | Beds/Ba | Sqft | Sold | Price | $/sf | Match |
|---|---|---|---|---|---|---|---|
| 219 W 5th St | 0.15mi | 6/— | 2,590 | 1mo | $85,000 | $33 | 80 |
| 149 W Fourth St | 0.18mi | —/— | — | 4mo | $185,000 | — | 75 |
| 81 Penn Ave | 0.38mi | 5/3.0 | — | 3mo | $185,000 | — | 67 |
| 131 Sturges Ave | 0.41mi | 4/2.0 | — | 3mo | $120,000 | — | 66 |
| 120 Distl Ave | 0.44mi | 4/— | 1,092 | 1mo | $65,000 | $60 | 66 |
| 31 Bartley Ave | 0.47mi | —/— | 3,008 | 3mo | $465,000 | $155 | 63 |
| 76 Bartley Ave | 0.53mi | 4/2.0 | 1,780 | 4mo | $90,000 | $51 | 59 |
| 38 Baldwin Ave | 0.45mi | 6/8.0 | — | 9mo | $350,000 | — | 59 |
| 185 Rowland Ave | 0.53mi | 6/2.0 | — | 7mo | $69,000 | — | 57 |
| 82 N Adams St | 0.69mi | 8/3.0 | — | 8mo | $82,000 | — | 49 |
| 100 Dawson Ave | 0.68mi | 3/2.0 | — | 9mo | $135,000 | — | 48 |
| 459 Glessner Ave | 0.70mi | 5/2.5 | — | 12mo | $180,250 | — | 45 |
Match score weights: distance 35% · size 25% · config 20% · recency 20%. Top-matched comps best support the ARV.
Projected returns pro-forma
-3.0% appreciation · 3.0% rent growth · sell at horizon
- IRR
- -8.2%
- Equity multiple
- 0.70×
- Total profit
- $-6,740
- Equity at exit
- $11,913
- IRR
- 1.4%
- Equity multiple
- 1.10×
- Total profit
- $2,159
- Equity at exit
- $6,908
Cash invested: $22,372 (down + closing). Projections, not guarantees.
Landlord ↔ Tenant lean methodology
- Overall (STATE)
- 73 Landlord-Friendly
- State Ohio
- 73 Landlord-Friendly · R+6
- County
- — inherits STATE
- City
- — inherits STATE
ZIP-level market 44903
- Home prices YoY
- -27.7%
- Active inventory
- 122
- Price-to-rent
- 8.1×
Monthly cashflow live
- Estimated rent
- $822 high interval (Pro) →
- Mortgage (P&I)
- −$419
- Tax est. 1.5%
- −$100 /mo · $1,198/yr
- Insurance
- −$33
- HOA
- −$0
- Vacancy / Maint / Mgmt
- −$173
- Net cashflow
- $97
Break-even live
UW: 25.0% down · 7.5% · 30yr · 1.5% tax · 5.0% vac · 8.0% maint · 8.0% mgmt
Financing live
Cash to close
- Down payment
- $19,975
- Closing costs
- $2,397
- Reserves months
- —
- Total cash needed
- —
Loan-product check · same deal, 3 products live
Conventional
25% down · 7.5% · 30yr
- Down + closing
- —
- Monthly P&I
- —
- Monthly cashflow
- —
- DSCR
- —
- Eligible?
- —
Personal DTI + credit; lowest rate.
DSCR
20% down · 8.5% · 30yr
- Down + closing
- —
- Monthly P&I
- —
- Monthly cashflow
- —
- DSCR
- —
- Eligible?
- —
No personal income docs; deal must DSCR.
Hard money
10% down · 12.0% · 12mo
- Down + closing
- —
- Monthly P&I
- —
- Monthly cashflow
- —
- DSCR
- —
- Eligible?
- —
Short-term bridge; refi at stabilization.
Rent comps 16 comps
| Address | Beds | Baths | Sqft | Rent | $/sqft | DOM | Units | Dist |
|---|---|---|---|---|---|---|---|---|
| 102 N Benton St Unit 112 Mansfield, OH | 3.0 | 1.5 | — | $995 | — | 43d | 1 | 0.11mi |
| 131 Pleasant Ave Unit A Mansfield, OH | 1.0 | 1.0 | 550 | $650 | $1.18 | 43d | 1 | 0.25mi |
| 92 W 2nd St Unit 4 Mansfield, OH | 1.0 | 1.0 | — | $700 | — | 43d | 1 | 0.34mi |
| 110 Blymyer Ave Apt 26 Mansfield, OH | 1.0 | 1.0 | — | $700 | — | 43d | 1 | 0.36mi |
| 140 Wood St Mansfield, OH | 1.0 | 1.0 | 487 | $700 | $1.44 | 43d | 1 | 0.42mi |
| 38 Baldwin Ave Apt 3 Mansfield, OH | 1.0 | 1.0 | 800 | $800 | $1.00 | 43d | 1 | 0.47mi |
| 46 Bartley Ave Unit 46 1/2 Mansfield, OH | 1.0 | 1.0 | 800 | $750 | $0.94 | 43d | 1 | 0.52mi |
| 454 Parnell Dr Mansfield, OH | 2.0 | 1.0 | 757 | $795 | $1.05 | 43d | 1 | 0.77mi |
| 520 Lida St Mansfield, OH | 3.0 | 1.0 | 1300 | $850 | $0.65 | 43d | 1 | 0.85mi |
| 383 Wood St Mansfield, OH | 1.0 | 1.0 | 500 | $625 | $1.25 | 43d | 1 | 0.89mi |
| 147 Ford St Mansfield, OH | 3.0 | 1.5 | 1286 | $995 | $0.77 | 43d | 1 | 1.09mi |
| 640 King St Mansfield, OH | 1.0–3.0 | 1.0 | 938 | $938 | $1.00 | 43d | 11 | 1.17mi |
| 750 Burns St Unit A6 Mansfield, OH | 2.0 | 1.0 | 960 | $950 | $0.99 | 43d | 1 | 1.24mi |
| 19 State St Mansfield, OH | 3.0 | 1.0 | 1040 | $995 | $0.96 | 43d | 1 | 1.24mi |
| 776 King St Unit B7 Mansfield, OH | 2.0 | 1.0 | 960 | $950 | $0.99 | 43d | 1 | 1.30mi |
| 100 Winwood Dr Mansfield, OH | 2.0 | 1.0 | 700 | $725 | $1.04 | 43d | 1 | 1.43mi |
Listing history 17 events
-
2026-06-18days on market $79,900 Active 66 DOM
-
2026-06-17days on market $79,900 Active 65 DOM
-
2026-06-16days on market $79,900 Active 64 DOM
-
2026-06-15days on market $79,900 Active 63 DOM
-
2026-06-14days on market $79,900 Active 61 DOM
-
2026-06-12days on market $79,900 Active 60 DOM
-
2026-06-09days on market $79,900 Active 57 DOM
-
2026-06-08days on market $79,900 Active 56 DOM
-
2026-06-07days on market $79,900 Active 55 DOM
-
2026-06-05days on market $79,900 Active 52 DOM
-
2026-06-03days on market $79,900 Active 51 DOM
-
2026-06-02days on market $79,900 Active 50 DOM
-
2026-06-01days on market $79,900 Active 49 DOM
-
2026-05-31days on market $79,900 Active 48 DOM
-
2026-05-30days on market $79,900 Active 47 DOM
-
2026-05-04status Pending 594-char remark
Show marketing remark (594 chars)
INVESTORS! Come bring your ideas to life with this multi-family opportunity situated in the Mansfield City School district! This property is poised to be realized & added to your portfolio! Some updates have already been completed in the last couple of years, including a roof, some plumbing, two new water heaters, some newer electrical, a new gas line for the stove, & a new water line for the property! The rest is ready for you to implement your vision! The property has a mixed use of multi-family/commercial. Come on in & bring this property back to its full potential!
-
2026-03-25$79,900 Active 594-char remark
Show marketing remark (594 chars)
INVESTORS! Come bring your ideas to life with this multi-family opportunity situated in the Mansfield City School district! This property is poised to be realized & added to your portfolio! Some updates have already been completed in the last couple of years, including a roof, some plumbing, two new water heaters, some newer electrical, a new gas line for the stove, & a new water line for the property! The rest is ready for you to implement your vision! The property has a mixed use of multi-family/commercial. Come on in & bring this property back to its full potential!
ⓘ Source: listings_history table (triggers on properties + properties_extension) + one-shot
backfill from property_details.listing_events for pre-trigger history.
Nearby sold comps map
Loading sold comps map…
Walkable amenities ~0.75 mi
Loading nearby amenities…
Taxation est. · year 1
- Rental income
- $9,865
- − Mortgage interest
- −$4,476
- − Property taxes
- −$1,198
- − Insurance
- −$400
- − Repairs & maintenance
- −$789
- − Management
- −$789
- − Depreciation
- −$2,324
- Taxable loss
- −$111
- Est. tax savings @ 24.0%
- +$27
- After-tax cash flow
- $1,194/yr
For passive investors: Depreciation is non-cash, so a rental often shows a tax loss while cash-flowing — sheltering income. Rental losses are passive: they offset passive income freely, and up to $25,000/yr can offset ordinary (W-2) income if you actively participate and your MAGI is under $100k (phasing out to $0 by $150k); unused losses carry forward. On sale, claimed depreciation is recaptured at up to 25%, and gains may owe capital-gains tax (a 1031 exchange can defer both). Figures are a year-1 estimate at your 24.0% rate — not tax advice; consult a CPA.
Condition & rehab AI · 1 photo
This multi-family property has a good condition with some minor maintenance needed. It's ready for a moderate renovation to enhance its curb appeal and value.
Value-add opportunities
- Both Paint exterior — Enhances curb appeal and value
- Both Landscaping — Improves curb appeal and rental appeal
- Both Replace gutters — Prevents water damage and enhances curb appeal
Renovation cost estimate screening
Value-add ROI direction
- Both Paint exterior — Enhances curb appeal and value ↑
- Both Landscaping — Improves curb appeal and rental appeal ↑
- Both Replace gutters — Prevents water damage and enhances curb appeal ↑
ⓘ Cost ranges are severity-bucket heuristics (US national rule-of-thumb). Get contractor quotes + a written scope before underwriting a rehab budget.
Schools (NCES district)
- District
- Mansfield City
- NCES district ID
- 3904429
- Math proficiency
- 24% ▼ -19.00%
- Reading proficiency
- 33% ▼ -12.00%
- Median HH income
- $32,435
- Composite
- 23.25/100
- National rank
- #7934
- State rank
- #590 of 656 in OH
Livability — Mansfield
- Score
- 76/100
- State rank
- #224
- US rank
- #3525
Category grades
Schools grade is shown separately in the Schools card above.
Census & demographics
- Census place
- Mansfield, OH
- County
- Richland · 128,966 people
- City population
- 16,349
- Metro
- Mansfield, OH
- Population (ZIP)
- 26,804
- Household income
- $65,421
- Rent vs Own
- Severe rent burden
- 9.5
Population outlook (Richland County) Hauer SSP2
- Today (2025)
- 115,577 people
- By 2030
- 111,669 · -3.4%
- By 2040
- 103,323 · -10.6%
- By 2050
- 95,135 · -17.7%
- By 2075
- 76,719 · -33.6%
- By 2100
- 57,188 · -50.5%
Race, ethnicity, and origin ACS 2023
- Neighborhood character
- Predominantly White (80%)
- Race & ethnicity
- White 80% Two or more races 9% Black 9% Hispanic / Latino 2% Asian 1%
- Common ancestry
- Slovak 2% Iranian 1% Romanian 1%
- Foreign-born
- 1%
- Languages at home
- 97% English-only · Spanish 1% Other Indo-European 1%
Political lean MEDSL · Richland
- 2024 margin
- Solid R (+42.3) · D 28.4% · R 70.8%
- 2008→2024 swing
- -28.8pp toward R · 2008: -13.6pp · 2024: -42.3pp
- All cycles
- 2024: R+42.3 2020: R+39.7 2016: R+37.5 2012: R+20.1 2008: R+13.6
Not yet ingested
- Civics
- —
Market trends
- HPI YoY
- ▼ -92.50%
- Current HPI
- 241.9342
- Rent YoY
- —
- Metro
- —
- State GDP YoY
- ▲ 1.98%
- F500 in state
- 48
Industry mix (Fortune 500 HQ in OH)
| Industry | F500 HQs | Revenue |
|---|---|---|
| Insurance | 3 | $145B |
|
||
| Industrial Machinery | 3 | $49B |
|
||
| Financial Services | 3 | $24B |
|
||
| Consumer Goods | 2 | $93B |
|
||
| Aerospace / Defense | 2 | $47B |
|
||
| Utilities | 2 | $33B |
|
||
Price history
2 events — show timeline
- 2026-05-04 Pending — MARMLS
- 2026-03-25 Listed $79,900 MARMLS
Cash-flow waterfall
monthlySold comps — $/sqft
last 12 mo · ≤1 miLoading sold comps…