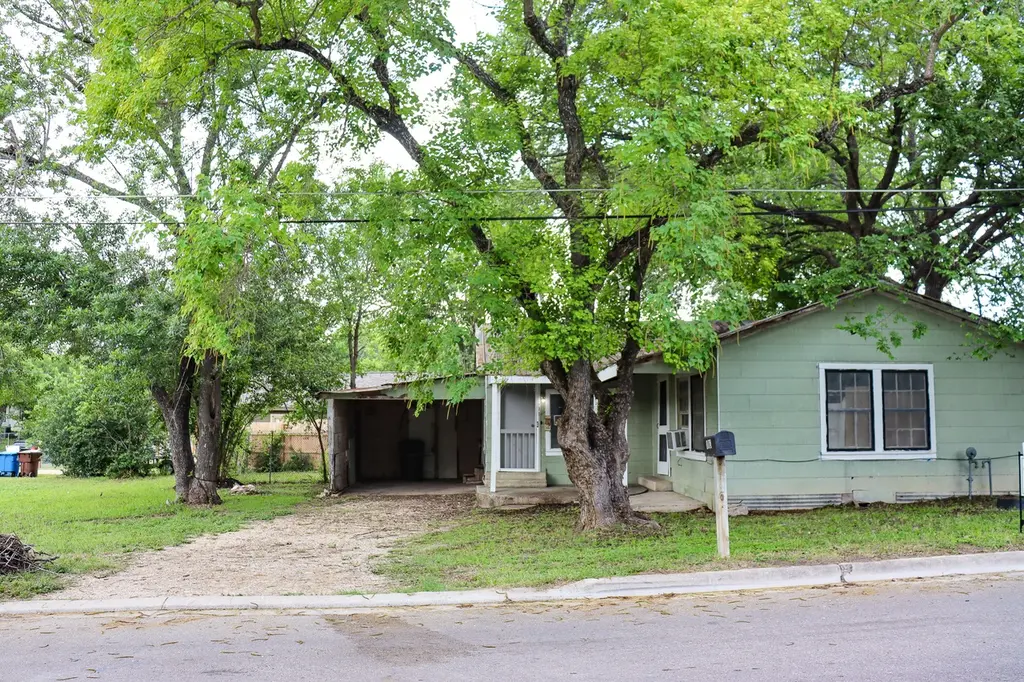
803 Third St · Lockhart, TX
Flood risk 1/10 · Minimal
- FEMA flood zone
- X (unshaded)
- Chance of flooding over 30 yrs
- 0.0%
- Est. flood insurance / yr
- $507 – $1,088
Fire risk 6/10 · Moderate
- Est. fire insurance / yr
- $1,222 – $2,270
Heat risk 8/10 · Major
- Hot days now (above 108°F)
- 6 days/yr
- Hot days in 30 yrs
- 19 days/yr
Wind risk 8/10 · Major
- Chance of severe wind over 30 yrs
- 80.0%
Air-quality risk 1/10 · Minimal
- Unhealthy air days now
- 0 days/yr
- Unhealthy air days in 30 yrs
- 0 days/yr
Risk factors via First Street. Map © Google.
Why this score? — see what drove the C grade
The composite is a weighted blend of 9 inputs, each scored 0–100. Each bar is that input's sub-score; the figure is the points it added to the 100-point composite (weight × sub-score).
- Cash flow +22.8/30.0
- ARV discount +7.5/15.0
- DSCR +7.3/10.0
- 1% rule +6.7/10.0
- Livability +3.4/5.0
- Rent growth +2.5/5.0
- Condition / age +2.5/5.0
- Schools +2.4/10.0
- Appreciation +0.0/10.0
$140,000
🖨 Deal sheet 📄 Offer letter ✓ Due diligence
Listing remarks
Great opportunity in the heart of Lockhart! This 3-bedroom, 1-bath home sits on 2 lots and offers plenty of potential for the right buyer. Whether you're an investor, flipper, or buyer looking to customize a home to your own taste, this property is ready for your vision. The layout features a living area, kitchen, and dining space, along with a 1-car carport and a fenced backyard — great for pets, kids, or outdoor entertaining. The home needs some work but the bones are there, and the value is undeniable. As an added bonus, an additional corner lot adjacent to the property is available for sale separately, offering even more opportunity to expand, build, or invest. Located close to Lo
Key facts
- Fenced backyard
- Corner lot
- 6,534 sq ft lot
Tags
Property features AI
Finance
- HOA & community: Curbs
Exterior
- Parking: Off-street parking for four; Outside parking
- Utilities: Electricity available; Public water; Public sewer
- Home design: Single-story home; Faces north; Pillar/post/pier foundation
- Construction: Built (year per public records); Asbestos construction material; Composition roof
- Exterior features: Private yard; Exterior steps; Porch; Back yard and front yard; Level lot with few trees; Chain-link fencing with gate
Interior
- Bedrooms: One main-level bedroom
- Flooring: Linoleum; Carpet-free
- Bathrooms: One full bathroom
- Interior features: See remarks
Neighborhood map
What this means for you Summary
Snapshot
- This is a 3-bed/1.0-bath single-family listed at $140k.
Deal economics
- At list price, monthly cash flow is $244 ($3k/yr) — positive.
- The deal already cash-flows at list — no discount required.
- Meets the 1% rule at list price ($2k rent vs $140k).
- Recommended offer: $138k (1.5% below list) — sets the bar for market timing.
- Cap rate 8.4% vs local median 3.0% in Lockhart — top-decile yield for the area; either an underpriced asset or a hidden risk that comps aren't pricing in. Stress-test before assuming the spread holds.
Location & tenants
- Location reads 67/100 on livability (#535 in TX) — a middle-class / working-renter tenant base. Strengths: cost of living A+, housing A+, crime B+; Watch: schools D-, amenities F, commute F.
- Lockhart ISD (town): math 27% / reading 29% proficiency, ranked #657 of 826 in TX (top 80%) — low school quality limits family demand, transient renter base, plan for 1-2y turnover; 62% free/reduced lunch — lower-income household profile, screen leases tightly.
- Market conditions: 452 active listings in the ZIP; 24 comparable units currently listed for rent nearby; rentals at typical pace (median 24d on market — plan ~3-4 weeks tenant-placement turnaround); 42% of comp listings sitting > 30 days — soft ceiling on asking rent; 529 units permitted in Caldwell County in 2024 (6 in 5+ unit buildings).
Forward outlook
- Local home prices are declining (-3.0%/yr); year-one equity from $968 of loan paydown is wiped out by about $4k of value loss. Plan a longer hold.
- Caldwell County population projected at +33% by 2050 — long-run rental-demand tailwind backs the buy-and-hold thesis.
Negotiation context
- It's been on market 22 days — a 2% lower offer ($138k) is reasonable based on typical stale-listing flexibility.
Risks & watch-outs
- Watch-outs: built in 1935 — expect roof / HVAC / electrical / plumbing capex.
- Climate carrying-cost: severe wind risk, 80% chance of damaging wind over 30y; major wildfire risk; extreme-heat days projected 6→19/yr by 2055 (HVAC capex compounding) — expect insurance premiums to compound above CPI over the hold.
Questions for the listing agent
- Built in 1935 — when were the roof, HVAC, electrical panel, plumbing, and water heater last replaced?
- Is there a deadline driving the sale (1031 exchange, divorce, estate, relocation)? That informs how much negotiation room exists.
- Schools are D-rated, which usually means shorter tenancies and higher turnover. Who's the typical renter profile here, and what's been the actual vacancy rate?
- What's the average days-on-market for RENTAL listings here right now (not sales)? A rising rental-DOM trend means longer vacancies and softer asking-rent achievability than the comps imply.
- What's the recent tenant-quality profile in this submarket — average credit score on applications, eviction rate, late-payment / NSF rate, and stable-employment percentage? A property-management company in the area should have these aggregated.
- How much new for-sale + rental construction is in the pipeline within 1–3 miles? Heavy new supply typically softens prices + rents 12–24 months out; constrained supply supports both.
Investment metrics
- 1% rule
- 1.17% ✓
- Cap rate
- 8.38%
- Cash-on-cash
- 7.46%
- DSCR
- 1.33
- GRM
- 7.1
CMA / ARV
- ARV (on-the-fly)
- $298,704
- Comps found
- 12
Show comp detail 12 sales within ~0.75 mi
| Address | Dist | Beds/Ba | Sqft | Sold | Price | $/sf | Match |
|---|---|---|---|---|---|---|---|
| 905 Luann Ln | 0.10mi | 3/1.5 | 1,089 (-7%) | 6mo | $119,000 | $109 | 76 |
| 712 Neches St | 0.30mi | 3/2.0 | 1,152 (-2%) | 7mo | $80,000 | $69 | 73 |
| 67 Trinity Cir | 0.16mi | 3/2.5 | 1,189 (+1%) | 21mo | $214,720 | $181 | 67 |
| 904 Chihuahua St | 0.08mi | 3/2.0 | 1,067 (-9%) | 12mo | $284,900 | $267 | 67 |
| 1409 4th St | 0.28mi | 3/2.0 | 1,062 (-10%) | 6mo | $219,000 | $206 | 62 |
| 516 Neches St | 0.42mi | 3/2.0 | 1,220 (+4%) | 16mo | $310,000 | $254 | 56 |
| 902 Chihuahua St | 0.09mi | 2/2.0 (-1) | 1,000 (-15%) | 7mo | $259,900 | $260 | 56 |
| 717 S Commerce St | 0.44mi | 2/1.0 (-1) | 1,090 (-7%) | 8mo | $180,000 | $165 | 56 |
| 512 San Saba St | 0.45mi | 3/2.0 | 1,260 (+7%) | 13mo | $269,990 | $214 | 53 |
| 721 Chihuahua St | 0.24mi | 2/2.0 (-1) | 1,000 (-15%) | 11mo | $255,000 | $255 | 46 |
| 515 S Blanco | 0.70mi | 2/2.0 (-1) | 1,230 (+5%) | 15mo | $475,000 | $386 | 39 |
| 510 S Guadalupe St | 0.75mi | 2/1.0 (-1) | 1,335 (+14%) | 2mo | $475,000 | $356 | 36 |
Match score weights: distance 35% · size 25% · config 20% · recency 20%. Top-matched comps best support the ARV.
Projected returns pro-forma
-3.0% appreciation · 3.0% rent growth · sell at horizon
- IRR
- -4.8%
- Equity multiple
- 0.82×
- Total profit
- $-7,094
- Equity at exit
- $20,874
- IRR
- 4.9%
- Equity multiple
- 1.36×
- Total profit
- $14,107
- Equity at exit
- $12,105
Cash invested: $39,200 (down + closing). Projections, not guarantees.
Landlord ↔ Tenant lean methodology
- Overall (STATE)
- 87 Strongly Landlord-Friendly
- State Texas
- 87 Strongly Landlord-Friendly · R+5
- County
- — inherits STATE
- City
- — inherits STATE
ZIP-level market 78644
- Home prices YoY
- -29.4%
- Active inventory
- 452
- Price-to-rent
- 7.1×
Monthly cashflow live
- Estimated rent
- $1,636 high interval (Pro) →
- Mortgage (P&I)
- −$734
- Tax from tax record
- −$257 /mo · $3,079/yr
- Insurance
- −$58
- HOA
- −$0
- Vacancy / Maint / Mgmt
- −$344
- Net cashflow
- $244
Break-even live
UW: 25.0% down · 7.5% · 30yr · 1.5% tax · 5.0% vac · 8.0% maint · 8.0% mgmt
Financing live
Cash to close
- Down payment
- $35,000
- Closing costs
- $4,200
- Reserves months
- —
- Total cash needed
- —
Loan-product check · same deal, 3 products live
Conventional
25% down · 7.5% · 30yr
- Down + closing
- —
- Monthly P&I
- —
- Monthly cashflow
- —
- DSCR
- —
- Eligible?
- —
Personal DTI + credit; lowest rate.
DSCR
20% down · 8.5% · 30yr
- Down + closing
- —
- Monthly P&I
- —
- Monthly cashflow
- —
- DSCR
- —
- Eligible?
- —
No personal income docs; deal must DSCR.
Hard money
10% down · 12.0% · 12mo
- Down + closing
- —
- Monthly P&I
- —
- Monthly cashflow
- —
- DSCR
- —
- Eligible?
- —
Short-term bridge; refi at stabilization.
Rent comps 24 comps
| Address | Beds | Baths | Sqft | Rent | $/sqft | DOM | Units | Dist |
|---|---|---|---|---|---|---|---|---|
| 61 Trinity Cir Lockhart, TX | 3.0 | 2.5 | 1468 | $1,670 | $1.14 | 4d | 1 | 0.11mi |
| 63 Trinity Cir Lockhart, TX | 3.0 | 2.5 | 1468 | $1,595 | $1.09 | 1d | 1 | 0.12mi |
| 67 Trinity Cir Lockhart, TX | 3.0 | 2.5 | 1253 | $1,700 | $1.36 | 23d | 1 | 0.13mi |
| 609 Cottonwood St Unit A Lockhart, TX | 2.0 | 1.0 | 1084 | $1,295 | $1.19 | 43d | 1 | 0.20mi |
| 1204 Blackjack St Unit B Lockhart, TX | 2.0 | 1.0 | 750 | $1,150 | $1.53 | 23d | 1 | 0.34mi |
| 703 San Saba St Lockhart, TX | 2.0 | 1.0 | 814 | $1,700 | $2.09 | 4d | 1 | 0.37mi |
| 750 S Main St Lockhart, TX | 3.0 | 2.0 | 1377 | $1,850 | $1.34 | 43d | 1 | 0.40mi |
| 908 S Guadalupe St Lockhart, TX | 2.0 | 2.0 | 1107 | $1,300 | $1.17 | 43d | 1 | 0.56mi |
| 903 E Live Oak St Unit A Lockhart, TX | 3.0 | 1.0 | 800 | $1,300 | $1.62 | 43d | 1 | 0.58mi |
| 903 E Live Oak St Unit B Lockhart, TX | 3.0 | 1.0 | 1200 | $1,450 | $1.21 | 43d | 1 | 0.58mi |
| 1001 Guadalupe St Lockhart, TX | 1.0–2.0 | 1.0–2.0 | 864 | $1,061 | $1.23 | 1d | 1 | 0.59mi |
| 100 N Brazos St Lockhart, TX | 3.0 | 1.0 | 1299 | $1,600 | $1.23 | 23d | 1 | 0.78mi |
| 1510 S Medina St Lockhart, TX | 3.0 | 2.0 | 1008 | $1,350 | $1.34 | 43d | 1 | 0.83mi |
| 1502 Oak Knoll Ln Lockhart, TX | 3.0 | 2.0 | 1388 | $2,050 | $1.48 | 43d | 1 | 0.91mi |
| 1010 Crockett St Unit A Lockhart, TX | 2.0 | 2.5 | 1140 | $1,200 | $1.05 | 21d | 1 | 0.93mi |
| 1010 Crockett St Lockhart, TX | 2.0 | 3.0 | 1140 | $1,200 | $1.05 | 20d | 1 | 0.93mi |
| 115 S Frio St Unit A Lockhart, TX | 2.0 | 1.5 | 959 | $1,125 | $1.17 | 4d | 1 | 1.06mi |
| 115 S Frio St Unit H Lockhart, TX | 2.0 | 1.5 | 959 | $1,125 | $1.17 | 43d | 1 | 1.06mi |
| 728 W San Antonio St Lockhart, TX | 2.0 | 1.0 | 944 | $1,125 | $1.19 | 4d | 1 | 1.15mi |
| 728 W San Antonio St Unit 730 A Lockhart, TX | 2.0 | 1.0 | 944 | $1,000 | $1.06 | 4d | 1 | 1.15mi |
| 329 Flores St Lockhart, TX | 2.0 | 1.0 | 1116 | $1,500 | $1.34 | 43d | 1 | 1.28mi |
| 518 Laredo St Lockhart, TX | 2.0 | 1.0 | 720 | $1,050 | $1.46 | 43d | 1 | 1.30mi |
| 1015 Fir Ln Lockhart, TX | 2.0 | 1.0 | 900 | $1,100 | $1.22 | 4d | 1 | 1.44mi |
| 1015 Fir Ln Lockhart, TX | 2.0 | 1.0 | 900 | $1,100 | $1.22 | 11d | 1 | 1.44mi |
Listing history 15 events
-
2026-06-18days on market $140,000 Active 22 DOM
-
2026-06-17days on market $140,000 Active 21 DOM
-
2026-06-16days on market $140,000 Active 20 DOM
-
2026-06-15days on market $140,000 Active 19 DOM
-
2026-06-13days on market $140,000 Active 17 DOM
-
2026-06-09days on market $140,000 Active 13 DOM
-
2026-06-08days on market $140,000 Active 12 DOM
-
2026-06-07days on market $140,000 Active 11 DOM
-
2026-06-04days on market $140,000 Active 8 DOM
-
2026-06-03days on market $140,000 Active 7 DOM
-
2026-06-02days on market $140,000 Active 6 DOM
-
2026-06-01days on market $140,000 Active 5 DOM
-
2026-05-31days on market $140,000 Active 4 DOM
-
2026-05-27$140,000 Active
-
2006-08-24soldstatus
ⓘ Source: listings_history table (triggers on properties + properties_extension) + one-shot
backfill from property_details.listing_events for pre-trigger history.
Tax reassessment forecast TX · Resets to sale price
- Current annual tax
- $3,079 · $257/mo
- Projected year-2 tax
- $3,079 · $257/mo
- Expected delta
- $0/yr ($0/mo · 0.0%)
ⓘ Screening estimate from a state-policy table — verify with the county assessor before closing.
Climate risk First Street
- Flood 1/10 Low FEMA zone X (unshaded) · 0% chance over 30 yrs
- Wildfire 6/10 Major
- Heat 8/10 Severe 6 d/yr ≥108°F today · 19 d/yr by 30 yrs out
- Wind 8/10 Severe 80% chance of damaging wind over 30 yrs
- Air quality 1/10 Low 0 unhealthy d/yr today · 0 by 30 yrs out
Nearby sold comps map
Loading sold comps map…
Walkable amenities ~0.75 mi
Loading nearby amenities…
Taxation est. · year 1
- Rental income
- $19,636
- − Mortgage interest
- −$7,842
- − Property taxes
- −$3,079
- − Insurance
- −$700
- − Repairs & maintenance
- −$1,571
- − Management
- −$1,571
- − Depreciation
- −$4,073
- Taxable income
- $801
- Est. tax owed @ 24.0%
- −$192
- After-tax cash flow
- $2,731/yr
For passive investors: Depreciation is non-cash, so a rental often shows a tax loss while cash-flowing — sheltering income. Rental losses are passive: they offset passive income freely, and up to $25,000/yr can offset ordinary (W-2) income if you actively participate and your MAGI is under $100k (phasing out to $0 by $150k); unused losses carry forward. On sale, claimed depreciation is recaptured at up to 25%, and gains may owe capital-gains tax (a 1031 exchange can defer both). Figures are a year-1 estimate at your 24.0% rate — not tax advice; consult a CPA.
Schools (NCES district)
- District
- Lockhart ISD
- NCES district ID
- 4827870
- Math proficiency
- 27% ▼ -12.00%
- Reading proficiency
- 29% ▼ -2.00%
- Median HH income
- $48,868
- Composite
- 24.44/100
- National rank
- #7674
- State rank
- #657 of 826 in TX
Livability — Lockhart
- Score
- 67/100
- State rank
- #535
- US rank
- #10453
Category grades
Schools grade is shown separately in the Schools card above.
Census & demographics
- Census place
- Lockhart, TX
- County
- Caldwell County · 25,195 people
- City population
- 22,348
- Metro
- Austin-Round Rock-Georgetown, TX
- Population (ZIP)
- 22,348
- Household income
- $74,709
- Rent vs Own
- Severe rent burden
- 324.0
Population outlook (Caldwell County) Hauer SSP2
- Today (2025)
- 46,557 people
- By 2030
- 49,673 · +6.7%
- By 2040
- 55,827 · +19.9%
- By 2050
- 61,832 · +32.8%
- By 2075
- 77,212 · +65.8%
- By 2100
- 89,225 · +91.6%
Race, ethnicity, and origin ACS 2023
- Neighborhood character
- Diverse neighborhood (Simpson 0.57)
- Race & ethnicity
- Hispanic / Latino 52% White 39% Two or more races 23% Black 4% Asian 1%
- Hispanic origin (detail)
- Mexican 45% Puerto Rican 2%
- Common ancestry
- Italian 1% Lithuanian 1% Serbian 1%
- Foreign-born
- 9% · Canada
- Languages at home
- 67% English-only · Spanish 32%
Political lean MEDSL · Caldwell
- 2024 margin
- R (+14.4) · D 42.2% · R 56.6% · Other 1.2%
- 2008→2024 swing
- -8.4pp toward R · 2008: -6.0pp · 2024: -14.4pp
- All cycles
- 2024: R+14.4 2020: R+9.1 2016: R+15.8 2012: R+11.1 2008: R+6.0
Not yet ingested
- Civics
- —
Market trends
- HPI YoY
- ▼ -99.62%
- Current HPI
- 239.7906
- Rent YoY
- —
- Metro
- Austin-Round Rock-Georgetown, TX
- State GDP YoY
- ▲ 3.95%
- F500 in state
- 110
Industry mix (Fortune 500 HQ in TX)
| Industry | F500 HQs | Revenue |
|---|---|---|
| Energy | 16 | $1,198B |
|
||
| Technology | 5 | $198B |
|
||
| Engineering / Construction | 4 | $72B |
|
||
| Energy Services | 3 | $60B |
|
||
| Utilities | 3 | $41B |
|
||
| Healthcare | 2 | $330B |
|
||
Price history
2 events — show timeline
- 2026-05-27 Listed $140,000 Unlock MLS
- 2006-08-24 Sold (Public Records) — Public Records
Property tax history
+6.9%/yrLatest (2025): $3,079 · -11.3% YoY. Source: county tax records.
Cash-flow waterfall
monthlySold comps — $/sqft
last 12 mo · ≤1 miLoading sold comps…