6050 Melody Ln #121 · Dallas, TX
Flood risk 1/10 · Minimal
- FEMA flood zone
- X (unshaded)
- Chance of flooding over 30 yrs
- 0.0%
- Est. flood insurance / yr
- $507 – $1,088
Fire risk 1/10 · Minimal
- Est. fire insurance / yr
- $1,222 – $2,270
Heat risk 7/10 · Major
- Hot days now (above 109°F)
- 7 days/yr
- Hot days in 30 yrs
- 23 days/yr
Wind risk 6/10 · Moderate
- Chance of severe wind over 30 yrs
- 27.0%
Air-quality risk 3/10 · Minor
- Unhealthy air days now
- 3 days/yr
- Unhealthy air days in 30 yrs
- 3 days/yr
Risk factors via First Street. Map © Google.
Why this score? — see what drove the D- grade
The composite is a weighted blend of 9 inputs, each scored 0–100. Each bar is that input's sub-score; the figure is the points it added to the 100-point composite (weight × sub-score).
- 1% rule +8.6/10.0
- Cash flow +7.7/30.0
- ARV discount +7.5/15.0
- Livability +4.0/5.0
- Rent growth +3.0/5.0
- Schools +2.8/10.0
- Condition / age +2.5/5.0
- DSCR +1.8/10.0
- Appreciation +0.0/10.0
$119,000
🖨 Deal sheet (PDF) 📄 Offer letter ✓ Due diligence
Listing remarks MLS
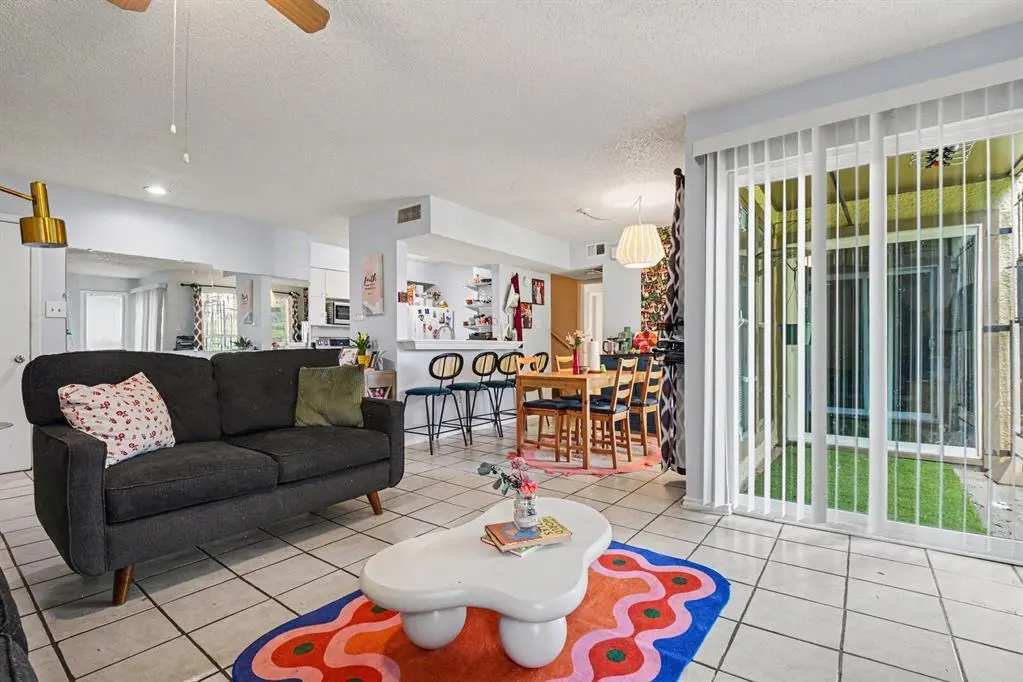
Beautiful 2- story condo conveniently located near Northpark center with easy access to 75,30, and dart rail system. The home comes with updated floors, kitchen, and HVAC system. The living room is open to the kitchen and has a cute outdoor space for relaxing. Each bedroom is located on different floors and each has full bathroom for privacy . This could be a great place for first time home buyer or investor looking for a rental. Come see today!
Key facts
- Dallas isd
- Community pool
- Spacious living area
Tags
Property features AI
Finance
- Financial info: Loan type: Treat As Clear; No second mortgage indicated
- HOA & community: Mandatory association with monthly fee; HOA fee covers grounds maintenance, sewer, and water; HOA management: PMI Metroplex
Exterior
- Parking: Covered carport with 2 spaces; Additional parking
- Security: Fire alarm
- Utilities: City water; City sewer; Electricity available and connected; Cable available; Phone available; Not in a municipal utility district
- Home design: Residential single-family residence; Attached property; Two-story entry level
- Construction: Built in 1979; Brick, concrete, and stucco construction
- Exterior features: Half- to under one-acre lot; Located in Tealwood On-The-Creek community; Access to US-75 and nearby amenities
Interior
- Kitchen: Dishwasher; Gas range; Refrigerator
- Bedrooms: 2 bedrooms (Primary bedroom on level 1)
- Bathrooms: 2 full bathrooms
- Heating & cooling: Central heating; Central air; Ceiling fan(s)
- Interior features: Cable TV available; Eat-in kitchen; Walk-in closet(s); One living area; One dining area; Two levels; One fireplace (wood burning)
Neighborhood map
What this means for you Summary
Snapshot
- This is a 2-bed/2.0-bath condo listed at $119k.
Deal economics
- At list price, monthly cash flow is $-139 ($-2k/yr) — negative.
- To cash-flow at today's rent, offer at most $94k (20.7% below list).
- Meets the 1% rule at list price ($2k rent vs $119k).
- Recommended offer: $94k (20.7% below list) — sets the bar for cash-flow.
- Cap rate 4.9% vs local median 2.3% in Dallas — top-decile yield for the area; either an underpriced asset or a hidden risk that comps aren't pricing in. Stress-test before assuming the spread holds.
Location & tenants
- Location reads 81/100 on livability (#24 in TX, #1,380 nationally) — a professional / high-income tenant draw. Strengths: amenities A+, commute A+, housing A+; Watch: crime F.
- Dallas ISD (urban): math 31% / reading 36% proficiency, ranked #559 of 826 in TX (top 68%) — families likely to look elsewhere, expect single-tenant / working-renter base with shorter leases; 83% free/reduced lunch — lower-income household profile, screen leases tightly.
- Zoned schools: Dan D Rogers El (math 52% / reading 52%, grade C-, #742 of 4,322 statewide, top 19%, 428 students, 76% FRL).
- Zoned-school proficiency averages 52% at this address vs 34% district-wide (+18 pts) — the actual schools serving this property are materially stronger than the Dallas ISD average implies; a family-tenant draw the district grade alone would hide.
- Market conditions: Rents rising (+2.0%/yr); 214 active listings in the ZIP; 40 comparable units currently listed for rent nearby; rentals at typical pace (median 15d on market — plan ~3-4 weeks tenant-placement turnaround); 12,577 units permitted in Dallas County in 2024 (6,829 in 5+ unit buildings).
Forward outlook
- Local home prices are declining (-3.0%/yr); year-one equity from $823 of loan paydown is wiped out by about $4k of value loss. Plan a longer hold.
- Dallas County population projected at +35% by 2050 — long-run rental-demand tailwind backs the buy-and-hold thesis.
Negotiation context
- It's been on market 20 days — a 2% lower offer ($117k) is reasonable based on typical stale-listing flexibility.
- 9 sale attempts since 16y ago; this cycle's ask has dropped $16k (12%) from the opening price — seller is motivated, your offer sets the floor, not the list.
- Current owner paid $16k; list at $119k implies a 639% gain — meaningful room to come down on a strong offer.
Risks & watch-outs
- Watch-outs: HOA is 31% of rent.
- Climate carrying-cost: major wind risk, 27% chance of damaging wind over 30y; extreme-heat days projected 7→23/yr by 2055 (HVAC capex compounding) — expect insurance premiums to compound above CPI over the hold.
Questions for the listing agent
- What do current leases actually rent for vs. the listed asking? Can we see a recent rent roll and the last 12 months of T-12 income?
- Built in 1979 — when were the roof, HVAC, electrical panel, plumbing, and water heater last replaced?
- What does the HOA fee cover, when was the last increase, and are there any pending special assessments or reserve-fund shortfalls?
- Any open or pending special assessments — roof, HVAC, plumbing, elevator, façade? What's the per-unit balance and payoff schedule, and is the seller paying it off at close or rolling it to the buyer?
- Is there a deadline driving the sale (1031 exchange, divorce, estate, relocation)? That informs how much negotiation room exists.
- Crime grade is F in this area — have there been break-ins, vandalism, or insurance claims at this property in the last 3 years? What carrier currently insures it and at what premium?
- The area grade is low — what's the realistic commute time and amenity access for the typical tenant pool here? Any planned neighborhood developments (good or bad) we should know about?
- What's the average days-on-market for RENTAL listings here right now (not sales)? A rising rental-DOM trend means longer vacancies and softer asking-rent achievability than the comps imply.
- What's the recent tenant-quality profile in this submarket — average credit score on applications, eviction rate, late-payment / NSF rate, and stable-employment percentage? A property-management company in the area should have these aggregated.
- How much new apartment / multifamily construction is in the pipeline within 1–3 miles? Heavy new supply (>2% of stock underway) typically softens rents 12–24 months out; light construction supports rent growth.
Investment metrics
- 1% rule
- 1.36% ✓
- Cap rate
- 4.89%
- Cash-on-cash
- -5.01%
- DSCR
- 0.78
- GRM
- 6.1
CMA / ARV
No comps found within radius.
Projected returns pro-forma
-3.0% appreciation · 1.96% rent growth · sell at horizon
- IRR
- -26.5%
- Equity multiple
- 0.12×
- Total profit
- $-29,436
- Equity at exit
- $17,743
- IRR
- -29.7%
- Equity multiple
- -0.27×
- Total profit
- $-42,199
- Equity at exit
- $10,289
Cash invested: $33,320 (down + closing). Projections, not guarantees.
Landlord ↔ Tenant lean methodology
- Overall (STATE)
- 87 Strongly Landlord-Friendly
- State Texas
- 87 Strongly Landlord-Friendly · R+5
- County
- — inherits STATE
- City
- — inherits STATE
ZIP-level market 75231
- Rents YoY
- 2.0%
- Active inventory
- 214
- Price-to-rent
- 6.1×
Monthly cashflow live
- Estimated rent
- $1,618 high interval (Pro) →
- Mortgage (P&I)
- −$624
- Tax from tax record
- −$244 /mo · $2,925/yr
- Insurance
- −$50
- HOA
- −$500
- Vacancy / Maint / Mgmt
- −$340
- Net cashflow
- $-139
Break-even live
Sensitivity live
| Price | -10% $-72 | -5% $-106 | +0% $-139 | +5% $-173 | +10% $-207 |
|---|---|---|---|---|---|
| Rent | -10% $-267 | -5% $-203 | +0% $-139 | +5% $-75 | +10% $-11 |
| Rate | -1.0pp $-79 | -0.5pp $-109 | base $-139 | +0.5pp $-170 | +1.0pp $-201 |
UW: 25.0% down · 7.5% · 30yr · 1.5% tax · 5.0% vac · 8.0% maint · 8.0% mgmt
Financing live
Cash to close
- Down payment
- $29,750
- Closing costs
- $3,570
- Reserves months
- —
- Total cash needed
- —
Loan-product check · same deal, 3 products live
Conventional
25% down · 7.5% · 30yr
- Down + closing
- —
- Monthly P&I
- —
- Monthly cashflow
- —
- DSCR
- —
- Eligible?
- —
Personal DTI + credit; lowest rate.
DSCR
20% down · 8.5% · 30yr
- Down + closing
- —
- Monthly P&I
- —
- Monthly cashflow
- —
- DSCR
- —
- Eligible?
- —
No personal income docs; deal must DSCR.
Hard money
10% down · 12.0% · 12mo
- Down + closing
- —
- Monthly P&I
- —
- Monthly cashflow
- —
- DSCR
- —
- Eligible?
- —
Short-term bridge; refi at stabilization.
Rent comps 40 comps
| Address | Beds | Baths | Sqft | Rent | $/sqft | DOM | Units | Dist |
|---|---|---|---|---|---|---|---|---|
| 6050 Melody Ln Dallas, TX | 1.0–2.0 | 1.0–2.0 | 992 | $1,382 | $1.39 | 0d | 8 | 0.04mi |
| 6121 Melody Ln Dallas, TX | 2.0 | 2.0 | 871 | $1,390 | $1.60 | 5d | 1 | 0.11mi |
| 6050 Ridgecrest Rd Dallas, TX | 2.0 | 1.0–2.0 | 732 | $1,295 | $1.77 | 4d | 14 | 0.14mi |
| 6014 Ridgecrest Rd Dallas, TX | 1.0 | 1.0 | 734 | $975 | $1.33 | 45d | 1 | 0.15mi |
| 6019 Ridgecrest Rd Unit 202B Dallas, TX | 2.0 | 2.5 | 1102 | $1,895 | $1.72 | 23d | 1 | 0.17mi |
| 8510 Park Ln #203 Dallas, TX | 1.0 | 1.0 | 700 | $1,275 | $1.82 | 12d | 1 | 0.20mi |
| 8510 Park Ln #102 Dallas, TX | 1.0 | 1.0 | 700 | $1,195 | $1.71 | 12d | 1 | 0.20mi |
| 6251 Melody Ln Dallas, TX | 1.0–2.0 | 1.0–2.0 | 819 | $1,395 | $1.70 | 0d | 39 | 0.23mi |
| 8560 Park Ln Unit 130 Dallas, TX | 3.0 | 2.0 | 1310 | $1,795 | $1.37 | 45d | 1 | 0.25mi |
| 7025 Hemlock Ave #305 Dallas, TX | 1.0 | 1.0 | 720 | $1,100 | $1.53 | 45d | 1 | 0.26mi |
| 6262 Melody Ln Dallas, TX | 1.0–2.0 | 1.0–2.0 | 865 | $1,485 | $1.72 | 13d | 3 | 0.26mi |
| 6262 Melody Ln Dallas, TX | 2.0 | 1.0–2.0 | 750 | $1,395 | $1.86 | 0d | 6 | 0.26mi |
| 6262 Melody Ln Dallas, TX | 2.0 | 1.0–2.0 | 750 | $1,395 | $1.86 | 0d | 4 | 0.26mi |
| 6262 Melody Ln Dallas, TX | 1.0–2.0 | 1.0–2.0 | 820 | $1,225 | $1.49 | 25d | 2 | 0.26mi |
| 5827 Blackwell St Dallas, TX | 2.0 | 1.0 | 669 | $840 | $1.26 | 4d | 4 | 0.27mi |
| 7030 Fair Oaks Ave Unit 108 Dallas, TX | 2.0 | 2.5 | 983 | $1,290 | $1.31 | 45d | 1 | 0.27mi |
| 8560 Park Ln Dallas, TX | 3.0 | 2.0 | 1310 | $1,995 | $1.52 | 45d | 1 | 0.28mi |
| 8560 Park Ln #136 Dallas, TX | 2.0 | 2.0 | 1100 | $1,300 | $1.18 | 25d | 1 | 0.28mi |
| 7107 Holly Hill Dr Unit 104 1 Dallas, TX | 1.0 | 1.0 | 865 | $1,350 | $1.56 | 9d | 1 | 0.46mi |
| 8116 Park Ln Dallas, TX | 1.0 | 1.0 | 836 | $2,100 | $2.51 | 25d | 1 | 0.46mi |
| 8116 Park Ln Dallas, TX | 2.0 | 2.0 | 1125 | $3,682 | $3.27 | 45d | 1 | 0.46mi |
| 8116 Park Ln Dallas, TX | 2.0 | 2.0 | 1125 | $3,682 | $3.27 | 23d | 1 | 0.46mi |
| 8110 Park Ln Dallas, TX | 2.0 | 1.0–2.0 | 1064 | $3,263 | $3.07 | 0d | 20 | 0.49mi |
| 6503 Ridgecrest Rd Apt J Dallas, TX | 1.0 | 1.5 | 943 | $1,250 | $1.33 | 45d | 1 | 0.51mi |
| 8611 Southwestern Blvd Unit 8634 Dallas, TX | 2.0 | 2.0 | 899 | $1,864 | $2.07 | 0d | 1 | 0.53mi |
| 8611 Southwestern Blvd Unit 8668 Dallas, TX | 2.0 | 2.0 | 899 | $1,609 | $1.79 | 15d | 1 | 0.53mi |
| 5829 Phoenix Dr Dallas, TX | 2.0 | 2.0 | 1493 | $1,650 | $1.11 | 25d | 1 | 0.53mi |
| 6211 Northwest Hwy Unit 400 Dallas, TX | 2.0 | 2.0 | 1132 | $3,000 | $2.65 | 20d | 1 | 0.53mi |
| 6211 E Northwest Hwy Unit G224 Dallas, TX | 1.0 | 1.0 | 721 | $1,950 | $2.70 | 25d | 1 | 0.53mi |
| 6211 E Northwest Hwy Unit 500 Dallas, TX | 2.0 | 2.0 | 1129 | $3,300 | $2.92 | 3d | 1 | 0.53mi |
| 6808 Eastridge Dr Unit D3 Dallas, TX | 1.0 | 1.5 | 1187 | $1,600 | $1.35 | 20d | 1 | 0.54mi |
| 6760 Eastridge Dr Unit 102 Dallas, TX | 1.0 | 1.0 | 725 | $1,350 | $1.86 | 20d | 1 | 0.55mi |
| 5750 Phoenix Dr #51 Dallas, TX | 1.0 | 1.0 | 817 | $1,350 | $1.65 | 16d | 1 | 0.56mi |
| 8750 Park Ln Unit 1546129P Dallas, TX | 2.0 | 2.0 | 1248 | $2,663 | $2.13 | 9d | 1 | 0.59mi |
| 5605 Village Glen Dr Dallas, TX | 1.0–3.0 | 1.0–2.5 | 813 | $3,348 | $4.11 | 0d | 1 | 0.62mi |
| 8705 Southwestern Blvd Unit 8738 Dallas, TX | 3.0 | 2.0 | 1286 | $2,903 | $2.26 | 0d | 1 | 0.64mi |
| 8705 Southwestern Blvd Unit 412 Dallas, TX | 1.0 | 1.0 | 722 | $1,780 | $2.47 | 14d | 1 | 0.64mi |
| 8705 Southwestern Blvd Unit 8742 Dallas, TX | 2.0 | 2.0 | 1045 | $2,051 | $1.96 | 0d | 1 | 0.64mi |
| 8705 Southwestern Blvd Unit 8720 Dallas, TX | 1.0 | 1.0 | 722 | $1,992 | $2.76 | 16d | 1 | 0.64mi |
| 8705 Southwestern Blvd Unit 8720 Dallas, TX | 1.0 | 1.0 | 722 | $1,780 | $2.47 | 0d | 1 | 0.64mi |
HOA detail condo
- Monthly dues
- $500 · $6,000/yr
- Assessments
- None detected in remarks — confirm with the listing agent.
Listing history 13 events
-
2026-06-21days on market $119,000 Active 20 DOM
-
2026-06-18days on market $119,000 Active 17 DOM
-
2026-06-17days on market $119,000 Active 16 DOM
-
2026-06-16days on market $119,000 Active 15 DOM
-
2026-06-15days on market $119,000 Active 14 DOM
-
2026-06-13pricedays on market $119,000 Active 12 DOM
-
2026-06-09days on market $135,000 Active 8 DOM
-
2026-06-08days on market $135,000 Active 7 DOM
-
2026-06-07days on market $135,000 Active 6 DOM
-
2026-06-04days on market $135,000 Active 3 DOM
-
2026-06-03days on market $135,000 Active 2 DOM
-
2026-06-02remarks 564-char remark
-
2026-06-02$135,000 Active 1 DOM
ⓘ Source: listings_history table (triggers on properties + properties_extension) + one-shot
backfill from property_details.listing_events for pre-trigger history.
Tax reassessment forecast TX · Resets to sale price
- Current annual tax
- $2,925 · $244/mo
- Projected year-2 tax
- $2,925 · $244/mo
- Expected delta
- $0/yr ($0/mo · 0.0%)
ⓘ Screening estimate from a state-policy table — verify with the county assessor before closing.
Climate risk First Street
- Flood 1/10 Low FEMA zone X (unshaded) · 0% chance over 30 yrs
- Wildfire 1/10 Low
- Heat 7/10 Severe 7 d/yr ≥109°F today · 23 d/yr by 30 yrs out
- Wind 6/10 Major 27% chance of damaging wind over 30 yrs
- Air quality 3/10 Moderate 3 unhealthy d/yr today · 3 by 30 yrs out
Nearby sold comps map
Loading sold comps map…
Walkable amenities ~0.75 mi
Loading nearby amenities…
Taxation est. · year 1
- Rental income
- $19,416
- − Mortgage interest
- −$6,666
- − Property taxes
- −$2,925
- − Insurance
- −$595
- − Repairs & maintenance
- −$1,553
- − Management
- −$1,553
- − HOA
- −$6,000
- − Depreciation
- −$3,462
- Taxable loss
- −$3,339
- Est. tax savings @ 24.0%
- +$801
- After-tax cash flow
- $-869/yr
For passive investors: Depreciation is non-cash, so a rental often shows a tax loss while cash-flowing — sheltering income. Rental losses are passive: they offset passive income freely, and up to $25,000/yr can offset ordinary (W-2) income if you actively participate and your MAGI is under $100k (phasing out to $0 by $150k); unused losses carry forward. On sale, claimed depreciation is recaptured at up to 25%, and gains may owe capital-gains tax (a 1031 exchange can defer both). Figures are a year-1 estimate at your 24.0% rate — not tax advice; consult a CPA.
Schools (NCES district)
- District
- Dallas ISD
- NCES district ID
- 4816230
- Math proficiency
- 31% ▼ -16.00%
- Reading proficiency
- 36% ▼ -4.00%
- Median HH income
- $42,881
- Composite
- 28.41/100
- National rank
- #6763
- State rank
- #559 of 826 in TX
Livability — Dallas
- Score
- 81/100
- State rank
- #24
- US rank
- #1380
Category grades
Schools grade is shown separately in the Schools card above.
Census & demographics
- Census place
- Dallas, TX
- County
- Dallas County · 2,612,404 people
- City population
- 1,168,437
- Metro
- Dallas-Fort Worth-Arlington, TX
- Population (ZIP)
- 38,370
- Household income
- $58,540
- Rent vs Own
- Severe rent burden
- 3482.0
Population outlook (Dallas County) Hauer SSP2
- Today (2025)
- 2,979,839 people
- By 2030
- 3,191,823 · +7.1%
- By 2040
- 3,619,611 · +21.5%
- By 2050
- 4,026,915 · +35.1%
- By 2075
- 4,957,073 · +66.4%
- By 2100
- 5,508,725 · +84.9%
Race, ethnicity, and origin ACS 2023
- Neighborhood character
- Highly diverse neighborhood (Simpson 0.74)
- Race & ethnicity
- Hispanic / Latino 33% White 29% Black 24% Two or more races 13% Asian 9%
- Hispanic origin (detail)
- Mexican 26%
- Common ancestry
- Slovak 1% Lithuanian 1% Romanian 1%
- Foreign-born
- 29% · Canada, Philippines, India
- Languages at home
- 57% English-only · Spanish 27% Other Asian/Pacific 4% Other Indo-European 3%
Political lean MEDSL · Dallas
- 2024 margin
- Strong D (+22.2) · D 60.2% · R 38.0% · Other 1.8%
- 2008→2024 swing
- +6.9pp toward D · 2008: 15.3pp · 2024: 22.2pp
- All cycles
- 2024: D+22.2 2020: D+31.6 2016: D+26.2 2012: D+15.4 2008: D+15.3
Not yet ingested
- Civics
- —
Market trends
- HPI YoY
- ▼ -359.41%
- Current HPI
- 249.5841
- Rent YoY
- ▲ 1.96%
- Metro
- Dallas-Fort Worth-Arlington, TX
- State GDP YoY
- ▲ 3.95%
- F500 in state
- 110
Industry mix (Fortune 500 HQ in TX)
| Industry | F500 HQs | Revenue |
|---|---|---|
| Energy | 16 | $1,198B |
|
||
| Technology | 5 | $198B |
|
||
| Engineering / Construction | 4 | $72B |
|
||
| Energy Services | 3 | $60B |
|
||
| Utilities | 3 | $41B |
|
||
| Healthcare | 2 | $330B |
|
||
Price history
+738.9% since first listed34 events — show timeline
- 2026-06-01 Listed $135,000 NTREIS
- 2022-09-15 Sold (Public Records) — Public Records
- 2019-07-03 Sold (Public Records) — Public Records
- 2019-07-01 Sold (MLS) — NTREIS
- 2019-06-24 Pending — NTREIS
- 2019-06-18 Contingent — NTREIS
- 2019-06-06 Listed $79,000 NTREIS
- 2018-09-01 Listing Removed — NTREIS
- 2018-08-13 Price Changed $68,000 NTREIS
- 2018-08-13 Relisted — NTREIS
- 2018-07-30 Listing Removed — NTREIS
- 2018-07-17 Price Changed $75,000 NTREIS
- 2018-07-06 Price Changed $95,000 NTREIS
- 2018-06-30 Relisted — NTREIS
- 2018-06-29 Relisted — NTREIS
- 2018-06-29 Listing Removed — NTREIS
- 2018-06-29 Listing Removed — NTREIS
- 2018-06-27 Listed $75,000 NTREIS
- 2017-04-03 Sold (Public Records) — Public Records
- 2017-03-31 Sold (MLS) — NTREIS
- 2017-03-14 Pending — NTREIS
- 2017-03-01 Listed $49,500 NTREIS
- 2011-06-18 Sold (MLS) — NTREIS
- 2011-06-16 Sold (Public Records) — Public Records
- 2011-06-10 Pending — NTREIS
- 2011-06-01 Contingent — NTREIS
- 2011-05-25 Price Changed $19,900 NTREIS
- 2010-11-29 Relisted — NTREIS
- 2010-11-26 Listing Removed — NTREIS
- 2010-09-03 Listed $24,900 NTREIS
- 1999-04-12 Sold (Public Records) — Public Records
- 1998-02-26 Sold (Public Records) — Public Records
- 1997-04-07 Sold (Public Records) $16,093 Public Records
- 1981-12-31 Sold (Public Records) — Public Records
Property tax history
+7.3%/yrLatest (2025): $2,925 · +12.0% YoY. Source: county tax records.
Cash-flow waterfall
monthlySold comps — $/sqft
last 12 mo · ≤1 miLoading sold comps…