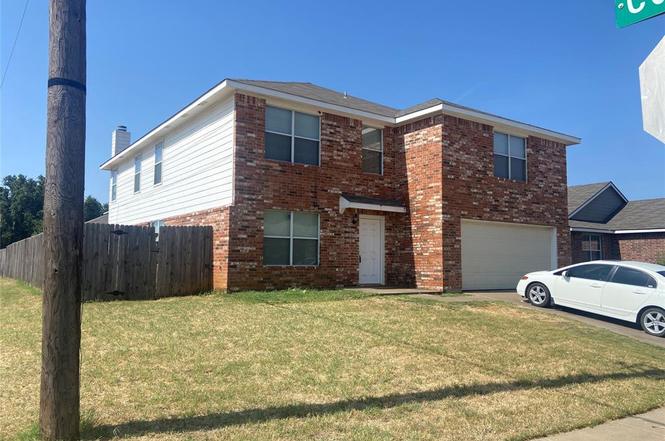
2701 Maegen Cir · Fort Worth, TX
Flood risk 1/10 · Minimal
- FEMA flood zone
- X (unshaded)
- Chance of flooding over 30 yrs
- 0.0%
- Est. flood insurance / yr
- $507 – $1,088
Fire risk 2/10 · Minimal
- Est. fire insurance / yr
- $1,222 – $2,270
Heat risk 8/10 · Major
- Hot days now (above 109°F)
- 7 days/yr
- Hot days in 30 yrs
- 24 days/yr
Wind risk 4/10 · Minor
- Chance of severe wind over 30 yrs
- 24.0%
Air-quality risk 3/10 · Minor
- Unhealthy air days now
- 2 days/yr
- Unhealthy air days in 30 yrs
- 4 days/yr
Risk factors via First Street. Map © Google.
Why this score? — see what drove the F grade
The composite is a weighted blend of 9 inputs, each scored 0–100. Each bar is that input's sub-score; the figure is the points it added to the 100-point composite (weight × sub-score).
- ARV discount +15.0/15.0
- Cash flow +4.2/30.0
- Livability +4.0/5.0
- Condition / age +2.5/5.0
- Rent growth +2.4/5.0
- Schools +2.0/10.0
- 1% rule +1.3/10.0
- DSCR +0.0/10.0
- Appreciation +0.0/10.0
$375,000
🖨 Deal sheet 📄 Offer letter ✓ Due diligence
Listing remarks
You have to see it. Big home for the price over 3500 square foots 4 bedrooms 2.5 baths in the corner of Cooks Lane & Maegen Circle. There is two living areas, spacious master bedrooms, ceiling fans in all rooms, flooring carpets in all rooms laminated in the living ceramic tile in the kitchen. Tenants occupied, PROPERTY TO BE SOLD AS IT IS.
Key facts
- 5,924 sq ft lot
- 2 garage spots
- Built 2006
Property features AI
Finance
- Other: Lot size less than 0.5 acre (about 0.136 acres); Subdivision: Blairbrook Fields Add; County: Tarrant; Directions: I-30 west from Arlington, exit on Cooks Ln and go south about 1 mile, pass school and look for Maegen Circle at the right; house is on the corner.
- Financial info: Listing terms include Cash, Conventional, FHA
- HOA & community: No homeowners association
Exterior
- Parking: Attached 2-car garage (approx. 20' x 18'); 2 covered parking spaces; Driveway with direct access; Concrete parking surfaces
- Utilities: City water; City sewer; Electricity connected; Municipal utility district: No
- Home design: Single family residence; Two levels; Residential property
- Construction: Built in 2006; Brick and fiber cement exterior; Composition roof; Slab foundation
- Exterior features: Wood fencing; Curbs; Concrete driveway
Interior
- Kitchen: Dishwasher; Disposal; Electric cooktop
- Bedrooms: 4 bedrooms (primary bedroom on 2nd level; additional bedrooms on 2nd level)
- Flooring: Carpet; Laminate
- Bathrooms: 2 full bathrooms, 1 half bathroom
- Heating & cooling: Central air; Electric heating; Ceiling fans
- Interior features: Pantry; Walk-in closets; Two living areas; Breakfast bar; Built-in cabinets
- Laundry & utility: Electric dryer hookup; Utility room; Electric water heater
Neighborhood map
What this means for you Summary
Snapshot
- This is a 3-bed/2.0-bath single-family listed at $375k.
Deal economics
- At list price, monthly cash flow is $-1k ($-12k/yr) — negative.
- To cash-flow at today's rent, offer at most $195k (48.0% below list).
- To meet the 1% rule (rent ≥ 1% of price), the offer needs to be $236k (37.0% below list).
- Recommended offer: $195k (48.0% below list) — sets the bar for cash-flow.
- Cap rate 3.0% vs local median 3.9% in Fort Worth — below-typical yield; the buyer is paying a premium for something (appreciation thesis, condition, location) that the cap rate doesn't capture.
Location & tenants
- Location reads 80/100 on livability (#49 in TX, #1,954 nationally) — a professional / high-income tenant draw. Strengths: amenities A+, cost of living A+, housing A+; Watch: crime F.
- Fort Worth ISD (urban): math 18% / reading 28% proficiency, ranked #742 of 826 in TX (top 90%) — low school quality limits family demand, transient renter base, plan for 1-2y turnover; 73% free/reduced lunch — lower-income household profile, screen leases tightly.
- Zoned schools: Bill J Elliott El (math 12% / reading 17%, grade F, #4,048 of 4,322 statewide, top 95%, 398 students, 92% FRL) — zoned schools average 92% FRL vs 73% district-wide (20 pts higher); higher-poverty schools than district average — tighter screening recommended.
- Market conditions: Rents soft (-0.4%/yr); 169 active listings in the ZIP; 2 comparable units currently listed for rent nearby; 18,938 units permitted in Tarrant County in 2024 (8,336 in 5+ unit buildings).
- At $2,362/mo this rent would consume 49% of the median local household income ($58k/yr) (locally 3056% of renters already pay >50% of income on rent) — very limited rent-growth headroom before tenants either downsize or default.
Forward outlook
- Local home prices are declining (-3.0%/yr); year-one equity from $3k of loan paydown is wiped out by about $11k of value loss. Plan a longer hold.
- Tarrant County population projected at +41% by 2050 — long-run rental-demand tailwind backs the buy-and-hold thesis.
Negotiation context
- Only 2 days on market — expect competitive offers; lowballing is unlikely to land.
- 5 sale attempts since 8y ago with the ask held roughly flat each time — persistent listings suggest the price (not the market) is what's stuck; bring a comps-based counter.
Risks & watch-outs
- Climate carrying-cost: extreme-heat days projected 7→24/yr by 2055 (HVAC capex compounding) — expect insurance premiums to compound above CPI over the hold.
Questions for the listing agent
- What do current leases actually rent for vs. the listed asking? Can we see a recent rent roll and the last 12 months of T-12 income?
- Is there a deadline driving the sale (1031 exchange, divorce, estate, relocation)? That informs how much negotiation room exists.
- Schools are D-rated, which usually means shorter tenancies and higher turnover. Who's the typical renter profile here, and what's been the actual vacancy rate?
- Crime grade is F in this area — have there been break-ins, vandalism, or insurance claims at this property in the last 3 years? What carrier currently insures it and at what premium?
- The area grade is low — what's the realistic commute time and amenity access for the typical tenant pool here? Any planned neighborhood developments (good or bad) we should know about?
- What's the average days-on-market for RENTAL listings here right now (not sales)? A rising rental-DOM trend means longer vacancies and softer asking-rent achievability than the comps imply.
- What's the recent tenant-quality profile in this submarket — average credit score on applications, eviction rate, late-payment / NSF rate, and stable-employment percentage? A property-management company in the area should have these aggregated.
- How much new for-sale + rental construction is in the pipeline within 1–3 miles? Heavy new supply typically softens prices + rents 12–24 months out; constrained supply supports both.
Investment metrics
- 1% rule
- 0.63% ✗
- Cap rate
- 3.03%
- Cash-on-cash
- -11.64%
- DSCR
- 0.48
- GRM
- 13.2
CMA / ARV
- ARV (on-the-fly)
- $724,675
- Comps found
- 1
Show comp detail 1 sale within ~0.75 mi
| Address | Dist | Beds/Ba | Sqft | Sold | Price | $/sf | Match |
|---|---|---|---|---|---|---|---|
| 7708 Meadowbrook Dr | 0.47mi | 3/4.0 | 3,533 (-0%) | 23mo | $725,000 | $205 | 50 |
Match score weights: distance 35% · size 25% · config 20% · recency 20%. Top-matched comps best support the ARV.
Projected returns pro-forma
-3.0% appreciation · 0.0% rent growth · sell at horizon
- IRR
- -41.4%
- Equity multiple
- -0.26×
- Total profit
- $-132,359
- Equity at exit
- $55,914
- IRR
- -94.4%
- Equity multiple
- -1.14×
- Total profit
- $-224,683
- Equity at exit
- $32,423
Cash invested: $105,000 (down + closing). Projections, not guarantees.
Landlord ↔ Tenant lean methodology
- Overall (STATE)
- 87 Strongly Landlord-Friendly
- State Texas
- 87 Strongly Landlord-Friendly · R+5
- County
- — inherits STATE
- City
- — inherits STATE
ZIP-level market 76112
- Home prices YoY
- -32.0%
- Rents YoY
- -0.4%
- Active inventory
- 169
- Price-to-rent
- 13.2×
Monthly cashflow live
- Estimated rent
- $2,362 medium interval (Pro) →
- Mortgage (P&I)
- −$1,967
- Tax from tax record
- −$762 /mo · $9,146/yr
- Insurance
- −$156
- HOA
- −$0
- Vacancy / Maint / Mgmt
- −$496
- Net cashflow
- $-1,019
Break-even live
UW: 25.0% down · 7.5% · 30yr · 1.5% tax · 5.0% vac · 8.0% maint · 8.0% mgmt
Financing live
Cash to close
- Down payment
- $93,750
- Closing costs
- $11,250
- Reserves months
- —
- Total cash needed
- —
Loan-product check · same deal, 3 products live
Conventional
25% down · 7.5% · 30yr
- Down + closing
- —
- Monthly P&I
- —
- Monthly cashflow
- —
- DSCR
- —
- Eligible?
- —
Personal DTI + credit; lowest rate.
DSCR
20% down · 8.5% · 30yr
- Down + closing
- —
- Monthly P&I
- —
- Monthly cashflow
- —
- DSCR
- —
- Eligible?
- —
No personal income docs; deal must DSCR.
Hard money
10% down · 12.0% · 12mo
- Down + closing
- —
- Monthly P&I
- —
- Monthly cashflow
- —
- DSCR
- —
- Eligible?
- —
Short-term bridge; refi at stabilization.
Rent comps 2 comps
| Address | Beds | Baths | Sqft | Rent | $/sqft | DOM | Units | Dist |
|---|---|---|---|---|---|---|---|---|
| 8129 Trudy Ln Fort Worth, TX | 4.0 | 3.0 | 2647 | $3,500 | $1.32 | 43d | 1 | 1.08mi |
| 7313 Monterrey Dr Fort Worth, TX | 4.0 | 2.0 | 2596 | $2,670 | $1.03 | 43d | 1 | 1.27mi |
Listing history 3 events
-
2026-06-18days on market $375,000 Active 2 DOM
-
2026-06-17remarks 344-char remark
-
2026-06-17$375,000 Active 1 DOM
ⓘ Source: listings_history table (triggers on properties + properties_extension) + one-shot
backfill from property_details.listing_events for pre-trigger history.
Tax reassessment forecast TX · Resets to sale price
- Current annual tax
- $9,146 · $762/mo
- Projected year-2 tax
- $9,146 · $762/mo
- Expected delta
- $0/yr ($0/mo · 0.0%)
ⓘ Screening estimate from a state-policy table — verify with the county assessor before closing.
Climate risk First Street
- Flood 1/10 Low FEMA zone X (unshaded) · 0% chance over 30 yrs
- Wildfire 2/10 Low
- Heat 8/10 Severe 7 d/yr ≥109°F today · 24 d/yr by 30 yrs out
- Wind 4/10 Moderate 24% chance of damaging wind over 30 yrs
- Air quality 3/10 Moderate 2 unhealthy d/yr today · 4 by 30 yrs out
Nearby sold comps map
Loading sold comps map…
Walkable amenities ~0.75 mi
Loading nearby amenities…
Taxation est. · year 1
- Rental income
- $28,347
- − Mortgage interest
- −$21,006
- − Property taxes
- −$9,146
- − Insurance
- −$1,875
- − Repairs & maintenance
- −$2,268
- − Management
- −$2,268
- − Depreciation
- −$10,909
- Taxable loss
- −$19,124
- Est. tax savings @ 24.0%
- +$4,590
- After-tax cash flow
- $-7,635/yr
For passive investors: Depreciation is non-cash, so a rental often shows a tax loss while cash-flowing — sheltering income. Rental losses are passive: they offset passive income freely, and up to $25,000/yr can offset ordinary (W-2) income if you actively participate and your MAGI is under $100k (phasing out to $0 by $150k); unused losses carry forward. On sale, claimed depreciation is recaptured at up to 25%, and gains may owe capital-gains tax (a 1031 exchange can defer both). Figures are a year-1 estimate at your 24.0% rate — not tax advice; consult a CPA.
Schools (NCES district)
- District
- Fort Worth ISD
- NCES district ID
- 4819700
- Math proficiency
- 18% ▼ -16.00%
- Reading proficiency
- 28% ▼ -6.00%
- Median HH income
- $42,109
- Composite
- 19.61/100
- National rank
- #8753
- State rank
- #742 of 826 in TX
Livability — Fort Worth
- Score
- 80/100
- State rank
- #49
- US rank
- #1954
Category grades
Schools grade is shown separately in the Schools card above.
Census & demographics
- Census place
- Fort Worth, TX
- County
- Tarrant County · 2,033,669 people
- City population
- 911,619
- Metro
- Dallas-Fort Worth-Arlington, TX
- Population (ZIP)
- 44,514
- Household income
- $57,724
- Rent vs Own
- Severe rent burden
- 3056.0
Population outlook (Tarrant County) Hauer SSP2
- Today (2025)
- 2,380,417 people
- By 2030
- 2,578,900 · +8.3%
- By 2040
- 2,974,995 · +25.0%
- By 2050
- 3,350,489 · +40.8%
- By 2075
- 4,216,909 · +77.2%
- By 2100
- 4,741,527 · +99.2%
Race, ethnicity, and origin ACS 2023
- Neighborhood character
- Diverse neighborhood (Simpson 0.69)
- Race & ethnicity
- Black 38% Hispanic / Latino 34% White 21% Two or more races 19% Asian 3%
- Hispanic origin (detail)
- Mexican 28% Puerto Rican 1%
- Common ancestry
- Lithuanian 1% Slovak 1% Swiss 1%
- Foreign-born
- 15% · Canada, Vietnam
- Languages at home
- 67% English-only · Spanish 29% Other Indo-European 1% Vietnamese 1%
Political lean MEDSL · Tarrant
- 2024 margin
- Lean R (+5.1) · D 46.7% · R 51.9% · Other 1.4%
- 2008→2024 swing
- +6.6pp toward D · 2008: -11.7pp · 2024: -5.1pp
- All cycles
- 2024: R+5.1 2020: D+0.2 2016: R+8.7 2012: R+15.7 2008: R+11.7
Not yet ingested
- Civics
- —
Market trends
- HPI YoY
- ▼ -158.49%
- Current HPI
- 336.6297
- Rent YoY
- ▼ -0.43%
- Metro
- Dallas-Fort Worth-Arlington, TX
- State GDP YoY
- ▲ 3.95%
- F500 in state
- 110
Industry mix (Fortune 500 HQ in TX)
| Industry | F500 HQs | Revenue |
|---|---|---|
| Energy | 16 | $1,198B |
|
||
| Technology | 5 | $198B |
|
||
| Engineering / Construction | 4 | $72B |
|
||
| Energy Services | 3 | $60B |
|
||
| Utilities | 3 | $41B |
|
||
| Healthcare | 2 | $330B |
|
||
Price history
+38.9% since first listed12 events — show timeline
- 2026-06-16 Listed $375,000 NTREIS
- 2023-09-23 Rental Removed $2,450 NTREIS
- 2023-09-22 Listed for Rent $2,450 NTREIS
- 2023-08-05 Listing Removed — NTREIS
- 2023-07-30 Price Changed $380,000 NTREIS
- 2023-07-26 Listed $401,199 NTREIS
- 2018-10-18 Listing Removed — NTREIS
- 2018-10-14 Price Changed $230,000 NTREIS
- 2018-10-02 Price Changed $255,500 NTREIS
- 2018-10-02 Relisted — NTREIS
- 2018-04-23 Listing Removed — NTREIS
- 2018-04-06 Listed $270,000 NTREIS
Property tax history
+3.6%/yrLatest (2025): $9,146 · +17.1% YoY. Source: county tax records.
Cash-flow waterfall
monthlySold comps — $/sqft
last 12 mo · ≤1 miLoading sold comps…