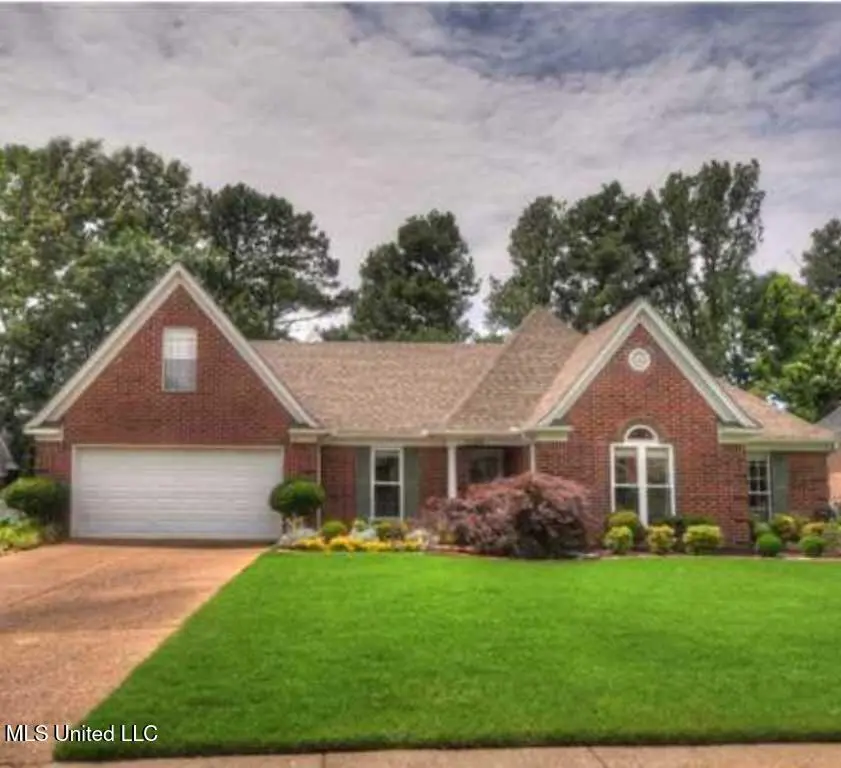
9389 Bryant Trent Blvd · Olive Branch, MS
Flood risk 1/10 · Minimal
- FEMA flood zone
- X (unshaded)
- Chance of flooding over 30 yrs
- 0.0%
- Est. flood insurance / yr
- $507 – $1,088
Fire risk 2/10 · Minimal
- Est. fire insurance / yr
- $1,241 – $2,305
Heat risk 7/10 · Major
- Hot days now (above 109°F)
- 7 days/yr
- Hot days in 30 yrs
- 21 days/yr
Wind risk 4/10 · Minor
- Chance of severe wind over 30 yrs
- 20.0%
Air-quality risk 2/10 · Minimal
- Unhealthy air days now
- 2 days/yr
- Unhealthy air days in 30 yrs
- 2 days/yr
Risk factors via First Street. Map © Google.
Why this score? — see what drove the D grade
The composite is a weighted blend of 9 inputs, each scored 0–100. Each bar is that input's sub-score; the figure is the points it added to the 100-point composite (weight × sub-score).
- Cash flow +12.6/30.0
- ARV discount +9.5/15.0
- Schools +4.0/10.0
- DSCR +3.8/10.0
- Livability +3.6/5.0
- Condition / age +2.5/5.0
- Rent growth +2.4/5.0
- 1% rule +2.2/10.0
- Appreciation +0.0/10.0
$285,000
🖨 Deal sheet (PDF) 📄 Offer letter ✓ Due diligence
Listing remarks MLS
~~DOWN PAYMENT ASSISTANCE AVAILABLE~~Perfect Home for Entertaining~ There is so much to Love about this Home~ Featuring 3 bedrooms and 2 baths~ Bonus Room could be 4th bedroom~ Beautiful reclaimed wood laminate floors that leads you to spacious Great Room with vaulted ceilings and gas fireplace~ Dining Room with reclaimed wood laminate floors~ Kitchen offers plenty of cabinets, granite counter tops, tile backsplash and pantry~ The Primary Suite offers tray ceilings and walk-in closet. Primary bath has walk-in shower, jetted tub and double sinks~ Laundry Room~ Upstairs has Bonus Room or 4th Bedroom~ Manicured Lawn~ Perfect home for family gatherings~~Covered Screened In Patio~~
Key facts
- Pantry
- Spacious great room
- Gas fireplace
Tags
Neighborhood map
What this means for you Summary
Snapshot
- This is a 3-bed/2.0-bath single-family listed at $285k.
Deal economics
- At list price, monthly cash flow is $-36 ($-435/yr) — negative.
- To cash-flow at today's rent, offer at most $279k (2.2% below list).
- To meet the 1% rule (rent ≥ 1% of price), the offer needs to be $206k (27.8% below list).
- Recommended offer: $206k (27.8% below list) — sets the bar for 1% rule.
- Cap rate 6.1% vs local median 4.3% in Olive Branch — top-decile yield for the area; either an underpriced asset or a hidden risk that comps aren't pricing in. Stress-test before assuming the spread holds.
Location & tenants
- Location reads 72/100 on livability (#29 in MS) — a middle-class / working-renter tenant base. Strengths: cost of living A+, housing A+, employment A; Watch: amenities F, commute F.
- Desoto County School District (suburban): math 48% / reading 42% proficiency, ranked #20 of 130 in MS (top 15%) — families likely to look elsewhere, expect single-tenant / working-renter base with shorter leases.
- Zoned schools: Overpark Elementary (math 47% / reading 50%, grade D, #80 of 375 statewide, top 21%, 677 students, 100% FRL); Center Hill Middle (math 65% / reading 44%, grade B-, #17 of 179 statewide, top 9%, 775 students, 100% FRL); Center Hill High School (math 57% / reading 53%, grade C, #9 of 197 statewide, top 4%, 1,075 students, 100% FRL) — zoned schools average 100% FRL vs 43% district-wide (56 pts higher); higher-poverty schools than district average — tighter screening recommended.
- Market conditions: Rents soft (-0.3%/yr); 575 active listings in the ZIP; 21 comparable units currently listed for rent nearby; rentals at typical pace (median 19d on market — plan ~3-4 weeks tenant-placement turnaround); solid renter incomes; 1,155 units permitted in DeSoto County in 2024 (0 in 5+ unit buildings).
Forward outlook
- Local home prices are declining (-3.0%/yr); year-one equity from $2k of loan paydown is wiped out by about $9k of value loss. Plan a longer hold.
- DeSoto County population projected at +33% by 2050 — long-run rental-demand tailwind backs the buy-and-hold thesis.
Negotiation context
- It's been on market 92 days — a 9% lower offer ($259k) is reasonable based on typical stale-listing flexibility.
- 5 sale attempts since 28y ago with the ask held roughly flat each time — persistent listings suggest the price (not the market) is what's stuck; bring a comps-based counter.
- Current owner paid $142k; list at $285k implies a 101% gain — meaningful room to come down on a strong offer.
Risks & watch-outs
- Climate carrying-cost: extreme-heat days projected 7→21/yr by 2055 (HVAC capex compounding) — expect insurance premiums to compound above CPI over the hold.
Questions for the listing agent
- What do current leases actually rent for vs. the listed asking? Can we see a recent rent roll and the last 12 months of T-12 income?
- It's been on market 92 days. Have you received any prior offers? Is the seller open to a 28% concession, seller financing, or rate buy-down credit?
- Why hasn't it sold? Are there any deal-killer items the seller is aware of (foundation, flood, title, zoning, code violations)?
- Is there a deadline driving the sale (1031 exchange, divorce, estate, relocation)? That informs how much negotiation room exists.
- Schools are B-rated — typically a magnet for longer-tenancy family renters. What's the average tenant stay here, and is there a school-zone premium baked into asking?
- The area grade is low — what's the realistic commute time and amenity access for the typical tenant pool here? Any planned neighborhood developments (good or bad) we should know about?
- What's the average days-on-market for RENTAL listings here right now (not sales)? A rising rental-DOM trend means longer vacancies and softer asking-rent achievability than the comps imply.
- What's the recent tenant-quality profile in this submarket — average credit score on applications, eviction rate, late-payment / NSF rate, and stable-employment percentage? A property-management company in the area should have these aggregated.
- How much new for-sale + rental construction is in the pipeline within 1–3 miles? Heavy new supply typically softens prices + rents 12–24 months out; constrained supply supports both.
Investment metrics
- 1% rule
- 0.72% ✗
- Cap rate
- 6.14%
- Cash-on-cash
- -0.55%
- DSCR
- 0.98
- GRM
- 11.5
CMA / ARV
- ARV (median comp)
- $298,283
- List price
- $285,000
- Delta
- -4.45%
- Verdict
- FAIR
- Comps
- 20 within 1.0 mi
Show comp detail 12 sales within ~0.75 mi
| Address | Dist | Beds/Ba | Sqft | Sold | Price | $/sf | Match |
|---|---|---|---|---|---|---|---|
| 9178 William Paul Dr | 0.25mi | 3/2.0 | 1,733 (+8%) | 6mo | $295,000 | $170 | 70 |
| 9444 E Geneva Loop | 0.29mi | 3/2.0 | 1,520 (-6%) | 8mo | $260,000 | $171 | 70 |
| 9320 Lacee Ln | 0.11mi | 3/2.0 | 1,802 (+12%) | 11mo | $299,000 | $166 | 66 |
| 9899 Wynngate Dr | 0.46mi | 3/2.0 | 1,520 (-6%) | 8mo | $240,000 | $158 | 62 |
| 9076 Champlain Dr | 0.47mi | 3/2.0 | 1,555 (-4%) | 13mo | $269,900 | $174 | 61 |
| 9129 Tremont Dr | 0.59mi | 3/2.0 | 1,525 (-5%) | 4mo | $255,000 | $167 | 61 |
| 9209 Hickory Dr | 0.44mi | 3/2.0 | 1,781 (+10%) | 2mo | $294,900 | $166 | 60 |
| 9908 Vista Ridge Dr | 0.37mi | 4/2.0 (+1) | 1,523 (-6%) | 11mo | $234,900 | $154 | 59 |
| 8318 Waverly Cv | 0.73mi | 3/2.0 | 1,555 (-4%) | 2mo | $259,900 | $167 | 58 |
| 8850 Travis Dr | 0.65mi | 3/2.0 | 1,677 (+4%) | 14mo | $275,000 | $164 | 51 |
| 9240 Huron Dr | 0.73mi | 3/2.0 | 1,540 (-4%) | 13mo | $289,900 | $188 | 48 |
| 9857 Tremont Dr | 0.57mi | 3/2.0 | 1,382 (-14%) | 8mo | $215,000 | $156 | 43 |
Match score weights: distance 35% · size 25% · config 20% · recency 20%. Top-matched comps best support the ARV.
Projected returns pro-forma
-3.0% appreciation · 0.0% rent growth · sell at horizon
- IRR
- -20.1%
- Equity multiple
- 0.31×
- Total profit
- $-54,682
- Equity at exit
- $42,494
- IRR
- -20.0%
- Equity multiple
- 0.07×
- Total profit
- $-74,545
- Equity at exit
- $24,642
Cash invested: $79,800 (down + closing). Projections, not guarantees.
Landlord ↔ Tenant lean methodology
- Overall (STATE)
- 90 Strongly Landlord-Friendly
- State Mississippi
- 90 Strongly Landlord-Friendly · R+11
- County
- — inherits STATE
- City
- — inherits STATE
ZIP-level market 38654
- Home prices YoY
- -26.1%
- Rents YoY
- -0.3%
- Active inventory
- 575
- Price-to-rent
- 11.5×
Monthly cashflow live
- Estimated rent
- $2,058 high interval (Pro) →
- Mortgage (P&I)
- −$1,495
- Tax from tax record
- −$49 /mo · $589/yr
- Insurance
- −$119
- HOA
- −$0
- Vacancy / Maint / Mgmt
- −$432
- Net cashflow
- $-36
Break-even live
Sensitivity live
| Price | -10% $125 | -5% $44 | +0% $-36 | +5% $-442 | +10% $-540 |
|---|---|---|---|---|---|
| Rent | -10% $-199 | -5% $-118 | +0% $-36 | +5% $45 | +10% $126 |
| Rate | -1.0pp $107 | -0.5pp $36 | base $-36 | +0.5pp $-110 | +1.0pp $-185 |
UW: 25.0% down · 7.5% · 30yr · 1.5% tax · 5.0% vac · 8.0% maint · 8.0% mgmt
Financing live
Cash to close
- Down payment
- $71,250
- Closing costs
- $8,550
- Reserves months
- —
- Total cash needed
- —
Loan-product check · same deal, 3 products live
Conventional
25% down · 7.5% · 30yr
- Down + closing
- —
- Monthly P&I
- —
- Monthly cashflow
- —
- DSCR
- —
- Eligible?
- —
Personal DTI + credit; lowest rate.
DSCR
20% down · 8.5% · 30yr
- Down + closing
- —
- Monthly P&I
- —
- Monthly cashflow
- —
- DSCR
- —
- Eligible?
- —
No personal income docs; deal must DSCR.
Hard money
10% down · 12.0% · 12mo
- Down + closing
- —
- Monthly P&I
- —
- Monthly cashflow
- —
- DSCR
- —
- Eligible?
- —
Short-term bridge; refi at stabilization.
Rent comps 21 comps
| Address | Beds | Baths | Sqft | Rent | $/sqft | DOM | Units | Dist |
|---|---|---|---|---|---|---|---|---|
| 9913 Vista Ridge Dr Olive Branch, MS | 3.0 | 2.0 | 1312 | $1,680 | $1.28 | 5d | 1 | 0.41mi |
| 9117 Billy Pat Dr Olive Branch, MS | 3.0 | 2.0 | 1727 | $1,850 | $1.07 | 45d | 1 | 0.42mi |
| 9069 Gavin Dr Olive Branch, MS | 4.0 | 2.0 | 1889 | $2,185 | $1.16 | 4d | 1 | 0.42mi |
| 9085 Billy Pat Dr Olive Branch, MS | 4.0 | 2.0 | 1457 | $2,000 | $1.37 | 22d | 1 | 0.45mi |
| 9042 Billy Pat Dr Olive Branch, MS | 3.0 | 2.0 | 1877 | $2,000 | $1.07 | 19d | 1 | 0.50mi |
| 9908 Tremont Dr Olive Branch, MS | 3.0 | 2.0 | 1507 | $1,770 | $1.17 | 19d | 1 | 0.54mi |
| 9305 Stateline Rd Olive Branch, MS | 1.0–2.0 | 1.0–2.0 | 927 | $1,600 | $1.73 | 4d | 12 | 0.55mi |
| 9007 Billy Pat Dr Olive Branch, MS | 4.0 | 2.0 | 1877 | $2,035 | $1.08 | 4d | 1 | 0.56mi |
| 9135 Tremont Dr Olive Branch, MS | 4.0 | 2.0 | 1774 | $2,220 | $1.25 | 25d | 1 | 0.59mi |
| 9083 Erie Cv Olive Branch, MS | 3.0 | 2.0 | 1600 | $1,995 | $1.25 | 22d | 1 | 0.72mi |
| 8255 Cross Point Dr Olive Branch, MS | 3.0 | 2.0 | 1380 | $1,725 | $1.25 | 5d | 1 | 0.86mi |
| 8260 Clubview Dr Olive Branch, MS | 3.0 | 2.0 | 1588 | $1,875 | $1.18 | 21d | 1 | 0.86mi |
| 8243 Cross Point Dr Olive Branch, MS | 3.0 | 2.0 | 1398 | $1,720 | $1.23 | 4d | 1 | 0.87mi |
| 9112 Lakeshore Dr Olive Branch, MS | 4.0 | 2.5 | 1985 | $2,350 | $1.18 | 45d | 1 | 0.87mi |
| 9025 Creekside Dr Olive Branch, MS | 3.0 | 2.5 | 1800 | $1,995 | $1.11 | 6d | 1 | 0.95mi |
| 7843 Plantation Ridge Cv Olive Branch, MS | 3.0 | 2.0 | 1750 | $1,935 | $1.11 | 19d | 1 | 1.21mi |
| 7831 Plantation Ridge Cv Olive Branch, MS | 3.0 | 2.0 | 1543 | $1,980 | $1.28 | 6d | 1 | 1.22mi |
| 7838 Alexanders Crossing Dr Olive Branch, MS | 4.0 | 3.0 | 2159 | $2,220 | $1.03 | 4d | 1 | 1.22mi |
| 8564 Courtly Cir N Olive Branch, MS | 4.0 | 3.0 | 2207 | $2,140 | $0.97 | 45d | 1 | 1.40mi |
| 7665 Fox Hunt Dr E Olive Branch, MS | 3.0 | 2.0 | 1320 | $1,695 | $1.28 | 45d | 1 | 1.47mi |
| 7642 Fox Hunt Dr E Olive Branch, MS | 3.0 | 2.0 | 1286 | $1,675 | $1.30 | 25d | 1 | 1.50mi |
Listing history 14 events
-
2026-05-13price $279,000 689-char remark
Show marketing remark (689 chars)
~~DOWN PAYMENT ASSISTANCE AVAILABLE~~Perfect Home for Entertaining~ There is so much to Love about this Home~ Featuring 3 bedrooms and 2 baths~ Bonus Room could be 4th bedroom~ Beautiful reclaimed wood laminate floors that leads you to spacious Great Room with vaulted ceilings and gas fireplace~ Dining Room with reclaimed wood laminate floors~ Kitchen offers plenty of cabinets, granite counter tops, tile backsplash and pantry~ The Primary Suite offers tray ceilings and walk-in closet. Primary bath has walk-in shower, jetted tub and double sinks~ Laundry Room~ Upstairs has Bonus Room or 4th Bedroom~ Manicured Lawn~ Perfect home for family gatherings~~Covered Screened In Patio~~
-
2026-04-27price $284,000 689-char remark
Show marketing remark (689 chars)
~~DOWN PAYMENT ASSISTANCE AVAILABLE~~Perfect Home for Entertaining~ There is so much to Love about this Home~ Featuring 3 bedrooms and 2 baths~ Bonus Room could be 4th bedroom~ Beautiful reclaimed wood laminate floors that leads you to spacious Great Room with vaulted ceilings and gas fireplace~ Dining Room with reclaimed wood laminate floors~ Kitchen offers plenty of cabinets, granite counter tops, tile backsplash and pantry~ The Primary Suite offers tray ceilings and walk-in closet. Primary bath has walk-in shower, jetted tub and double sinks~ Laundry Room~ Upstairs has Bonus Room or 4th Bedroom~ Manicured Lawn~ Perfect home for family gatherings~~Covered Screened In Patio~~
-
2026-02-24$289,000 Active 689-char remark
Show marketing remark (689 chars)
~~DOWN PAYMENT ASSISTANCE AVAILABLE~~Perfect Home for Entertaining~ There is so much to Love about this Home~ Featuring 3 bedrooms and 2 baths~ Bonus Room could be 4th bedroom~ Beautiful reclaimed wood laminate floors that leads you to spacious Great Room with vaulted ceilings and gas fireplace~ Dining Room with reclaimed wood laminate floors~ Kitchen offers plenty of cabinets, granite counter tops, tile backsplash and pantry~ The Primary Suite offers tray ceilings and walk-in closet. Primary bath has walk-in shower, jetted tub and double sinks~ Laundry Room~ Upstairs has Bonus Room or 4th Bedroom~ Manicured Lawn~ Perfect home for family gatherings~~Covered Screened In Patio~~
-
2016-06-27historical
-
2016-06-16$165,000
-
2003-05-07soldstatus
-
2003-04-16soldstatus
-
2003-04-16soldstatus $142,000
-
2003-03-01historical
-
2003-01-06$145,000
-
2003-01-06$145,000
-
1998-12-29soldstatus $127,900
-
1998-11-23historical
-
1998-08-25$127,900
ⓘ Source: listings_history table (triggers on properties + properties_extension) + one-shot
backfill from property_details.listing_events for pre-trigger history.
Tax reassessment forecast MS · Resets to sale price
- Current annual tax
- $589 · $49/mo
- Projected year-2 tax
- $2,252 · $188/mo
- Expected delta
- +$1,662/yr (+$139/mo · 282.2%)
ⓘ Screening estimate from a state-policy table — verify with the county assessor before closing.
Climate risk First Street
- Flood 1/10 Low FEMA zone X (unshaded) · 0% chance over 30 yrs
- Wildfire 2/10 Low
- Heat 7/10 Severe 7 d/yr ≥109°F today · 21 d/yr by 30 yrs out
- Wind 4/10 Moderate 20% chance of damaging wind over 30 yrs
- Air quality 2/10 Low 2 unhealthy d/yr today · 2 by 30 yrs out
Nearby sold comps map
Loading sold comps map…
Walkable amenities ~0.75 mi
Loading nearby amenities…
Taxation est. · year 1
- Rental income
- $24,701
- − Mortgage interest
- −$15,964
- − Property taxes
- −$589
- − Insurance
- −$1,425
- − Repairs & maintenance
- −$1,976
- − Management
- −$1,976
- − Depreciation
- −$8,291
- Taxable loss
- −$5,521
- Est. tax savings @ 24.0%
- +$1,325
- After-tax cash flow
- $890/yr
For passive investors: Depreciation is non-cash, so a rental often shows a tax loss while cash-flowing — sheltering income. Rental losses are passive: they offset passive income freely, and up to $25,000/yr can offset ordinary (W-2) income if you actively participate and your MAGI is under $100k (phasing out to $0 by $150k); unused losses carry forward. On sale, claimed depreciation is recaptured at up to 25%, and gains may owe capital-gains tax (a 1031 exchange can defer both). Figures are a year-1 estimate at your 24.0% rate — not tax advice; consult a CPA.
Schools (NCES district)
- District
- Desoto County School District
- NCES district ID
- 2801320
- Math proficiency
- 48% ▼ -13.00%
- Reading proficiency
- 42% ▼ -6.00%
- Median HH income
- $59,272
- Composite
- 39.56/100
- National rank
- #3933
- State rank
- #20 of 130 in MS
Livability — Olive Branch
- Score
- 72/100
- State rank
- #29
- US rank
- #6509
Category grades
Schools grade is shown separately in the Schools card above.
Census & demographics
- Census place
- Olive Branch, MS
- County
- DeSoto County · 176,513 people
- City population
- 57,898
- Metro
- Memphis, TN-MS-AR
- Population (ZIP)
- 57,898
- Household income
- $103,092
- Rent vs Own
- Severe rent burden
- 801.0
Population outlook (DeSoto County) Hauer SSP2
- Today (2025)
- 203,338 people
- By 2030
- 217,692 · +7.1%
- By 2040
- 245,320 · +20.6%
- By 2050
- 270,133 · +32.8%
- By 2075
- 323,341 · +59.0%
- By 2100
- 348,742 · +71.5%
Race, ethnicity, and origin ACS 2023
- Neighborhood character
- Diverse neighborhood (Simpson 0.57)
- Race & ethnicity
- White 57% Black 32% Hispanic / Latino 5% Two or more races 5% Asian 2%
- Hispanic origin (detail)
- Mexican 4%
- Common ancestry
- Slovak 2% Lithuanian 1% Romanian 1%
- Foreign-born
- 4% · Canada, Vietnam, China
- Languages at home
- 93% English-only · Spanish 4% Vietnamese 1% Arabic 1%
Political lean MEDSL · DeSoto
- 2024 margin
- Strong R (+24.1) · D 36.7% · R 60.8% · Other 2.5%
- 2008→2024 swing
- +14.2pp toward D · 2008: -38.2pp · 2024: -24.1pp
- All cycles
- 2024: R+24.1 2020: R+23.9 2016: R+34.8 2012: R+33.5 2008: R+38.2
Not yet ingested
- Civics
- —
Market trends
- HPI YoY
- ▼ -66.27%
- Current HPI
- 187.2114
- Rent YoY
- ▼ -0.34%
- Metro
- Memphis, TN-MS-AR
- State GDP YoY
- —
- F500 in state
- 0
Price history
+118.1% since first listed14 events — show timeline
- 2026-05-13 Price Changed $279,000 MLSU
- 2026-04-27 Price Changed $284,000 MLSU
- 2026-02-24 Listed $289,000 MLSU
- 2016-06-27 Listing Removed — MLSU
- 2016-06-16 Listed $165,000 MLSU
- 2003-05-07 Sold (Public Records) — Public Records
- 2003-04-16 Sold (MLS) $142,000 Memphis Area Association of Realtors(R) MLS
- 2003-04-16 Sold (MLS) — MLSU
- 2003-03-01 Delisted — Memphis Area Association of Realtors(R) MLS
- 2003-01-06 Listed $145,000 Memphis Area Association of Realtors(R) MLS
- 2003-01-06 Listed $145,000 MLSU
- 1998-12-29 Sold (MLS) $127,900 Memphis Area Association of Realtors(R) MLS
- 1998-11-23 Delisted — Memphis Area Association of Realtors(R) MLS
- 1998-08-25 Listed $127,900 Memphis Area Association of Realtors(R) MLS
Property tax history
-0.8%/yrLatest (2025): $589 · -15.2% YoY. Source: county tax records.
Cash-flow waterfall
monthlySold comps — $/sqft
last 12 mo · ≤1 miLoading sold comps…